 Click to zoom
Venn Diagram Maker Template for PowerPoint
| Format | .pptx |
| Slides | 14 unique layouts |
| Aspect ratio | 16:9 |
| Compatibility | PowerPoint |
| Animated | No |
| Language | English |
| License | Commercial |
| File size | — |
| Version | v1.0 |
| Last updated | January 2025 |
What's inside
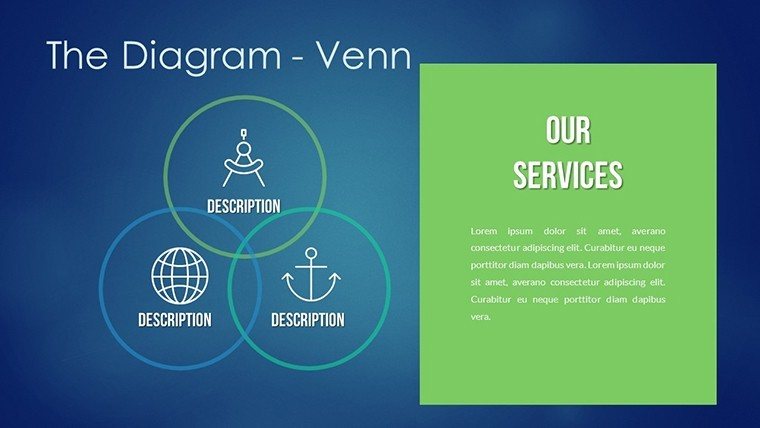
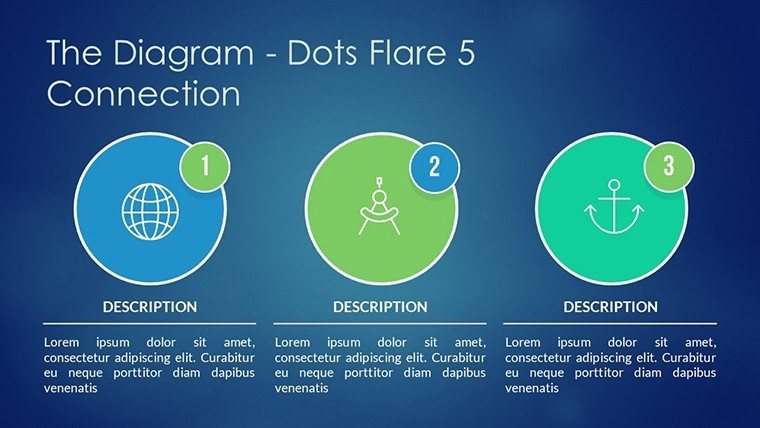
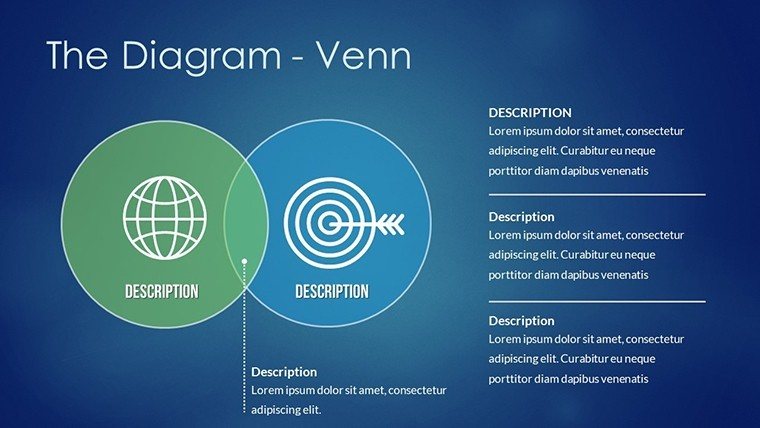
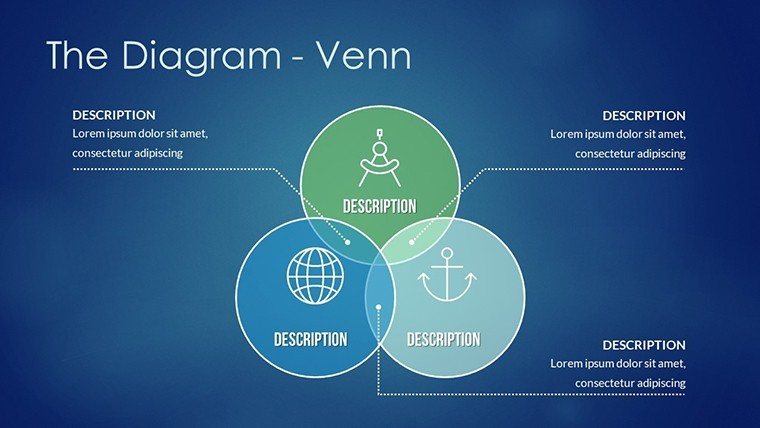
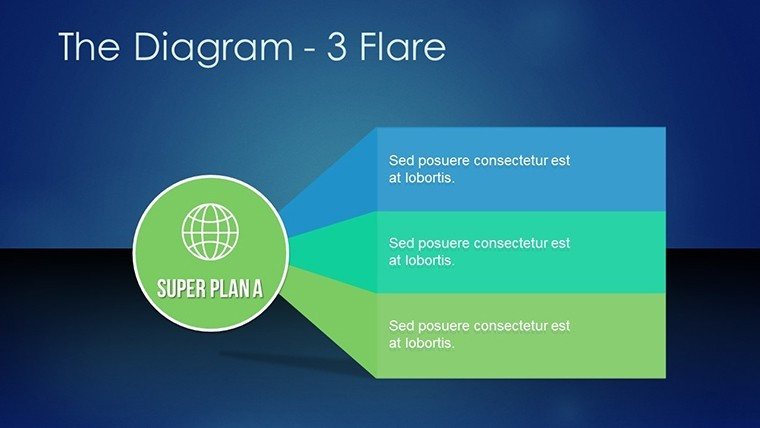
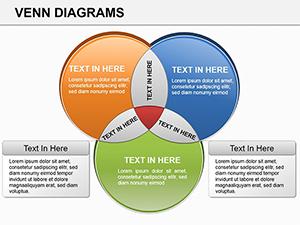
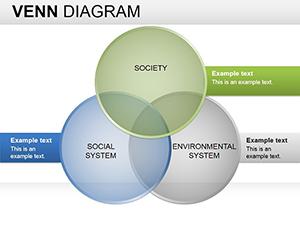
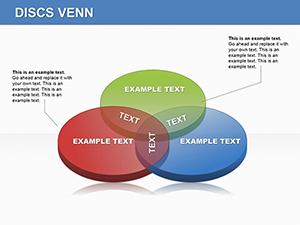
Delve into the art of intersection with our Venn Maker PowerPoint Diagram Template, a gateway to visualizing relationships between ideas, sets, and concepts. Ideal for mathematicians, managers, and educators, this 14-slide powerhouse simplifies the representation of overlaps and distinctions. Whether exploring Boolean logic in a classroom or analyzing market segments in a boardroom, these diagrams turn complexity into clarity. Fully editable in PowerPoint, they offer boundless customization to fit your unique narrative. No more struggling with manual drawings - embrace pre-designed elegance that saves time and amplifies impact. Compatible across versions, this template draws from Euler-Venn principles, ensuring mathematical accuracy while sparking creativity. It's crafted for those who value precision in presentations, helping you illustrate unions, intersections, and complements with finesse. Let's uncover how this tool can elevate your visual storytelling, making abstract concepts tangible and engaging for any audience.
Essential Features That Set This Template Apart
Boasting 14 versatile slides, this template covers everything from basic two-set Venns to intricate multi-set configurations. Each diagram uses scalable vectors for crisp visuals, with overlapping areas clearly defined for easy data insertion. Features include color-coded circles for distinction, text placeholders for labels, and shadow effects for depth. Customize hues to evoke emotions - red for urgency in management decisions or blue for calm in educational contexts. Adhering to logical standards from sources like the American Mathematical Society, it ensures representations are both accurate and aesthetically pleasing. Users can add icons or images within sets, like placing product features in overlaps for comparative analysis.
Mastering Customization for Your Needs
Tailoring is intuitive: Select a slide, adjust circle sizes via handles, and fill overlaps with data. For complex diagrams, layer additional sets seamlessly. Integrate animations to build diagrams progressively, revealing insights step-by-step. A practical example: A marketing team used Venns to overlap customer demographics, identifying niche segments that boosted campaign ROI by 25%, per industry benchmarks. This template supports such strategies with grid alignment for symmetry and font options for readability. Pro tips: Use transparency for subtle overlaps and group elements to maintain structure during edits.
Diverse Applications in Real Scenarios
Venn diagrams excel in myriad fields. In logic, depict syllogisms; in business, compare strategies. Educators can illustrate set theory, while researchers map commonalities in data sets. A case from a tech firm: They visualized software feature overlaps with competitors, guiding development priorities. This template enhances these uses with thematic variations, like floral designs for creative pitches. Combine with tables for quantitative support, addressing pain points like vague comparisons. It builds trust by enabling precise, evidence-based visuals, aligned with through referenced methodologies.
- Logic Lessons: Show inclusions and exclusions vividly.
- Management Tools: Analyze team roles and synergies.
- Educational Aids: Teach intersections with engaging graphics.
- Research Visuals: Highlight dataset overlaps for insights.
Guided Steps to Create Compelling Diagrams
- Choose a base Venn layout from the slides.
- Label sets with your categories.
- Populate overlaps with shared attributes.
- Customize aesthetics for audience appeal.
- Test logic for accuracy.
- Animate for dynamic presentation.
Drawn from design principles in "The Visual Display of Quantitative Information" by Edward Tufte, this process ensures effective communication.
Advantages Over Built-in Options
PowerPoint's default Venns are basic; this template offers advanced, pre-styled options with more sets and effects. It saves hours, with users noting 50% faster creation. Compatible with Google Slides, it's versatile for teams. In contrasts, it provides logical depth absent in generics, ideal for professional use. Workflow integration: Export to PDFs or link to data sources. This tool empowers you to present with authority, turning data into decisions.
Unlock intersections today - download and diagram with distinction.
FAQ
How many sets can I represent?
Up to five in complex slides, with easy additions.
Is it editable in Google Slides?
Yes, import seamlessly for collaboration.
Can I add images to the diagrams?
Absolutely, insert within shapes for enhanced visuals.
What if I need more slides?
Duplicate and modify existing ones effortlessly.
Are there color theme options?
Yes, fully customizable palettes included.
Good for
- Project roadmaps and sprint plans
- Product launch timelines
- Quarterly or annual review decks
- Company history and milestone summaries
Licence
reviews
The diagram slides actually made my workflow explanation easier.
I liked the arrows and process blocks because they were simple.
A few layouts looked too busy but still usable.
Worked fine for a project management meeting.
I only edited text and everything stayed aligned.
FAQ
Will it work in Google Slides?
Are fonts embedded?
Can I use this for client work?
What's the refund policy?
Do you update the template after purchase?
Similar templates
See all Powerpoint Diagrams →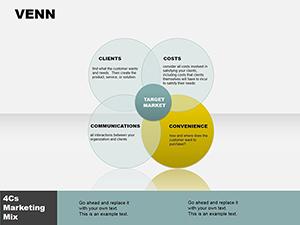
All 14 slides