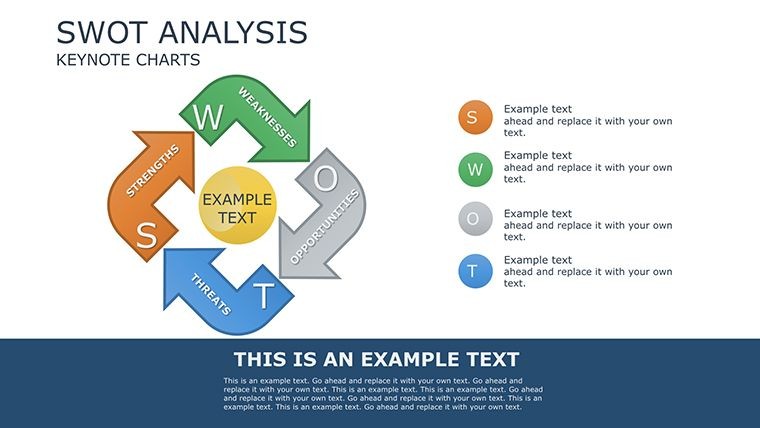
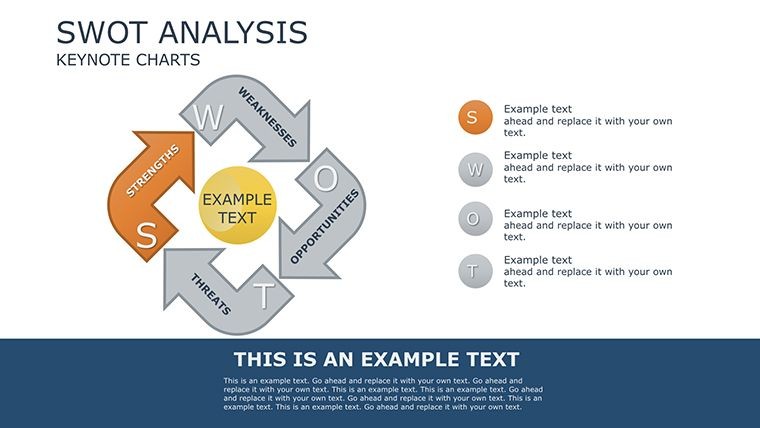
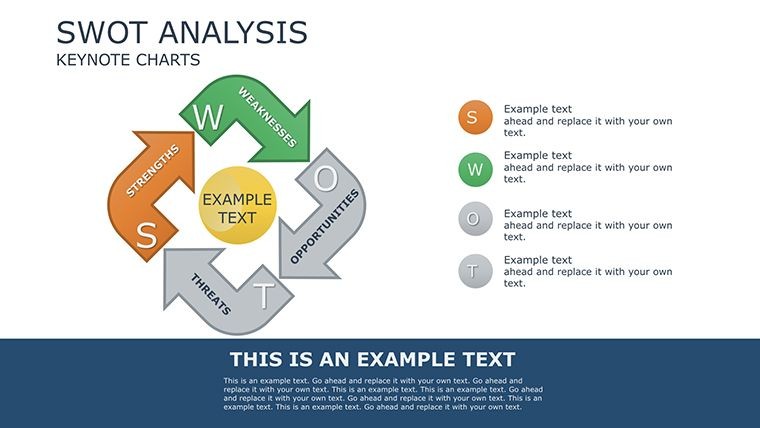
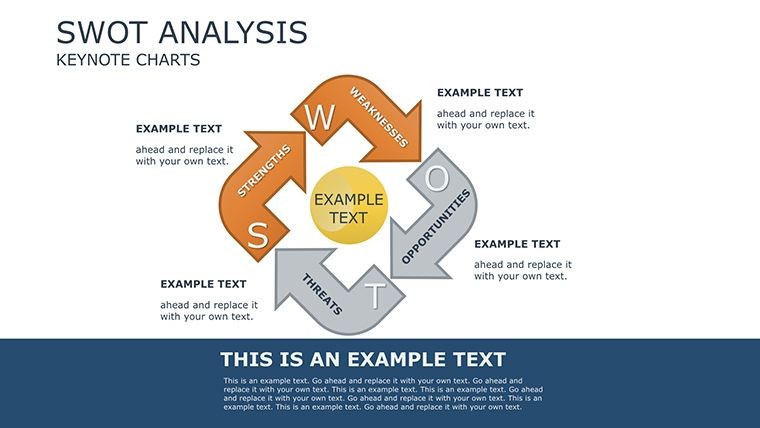
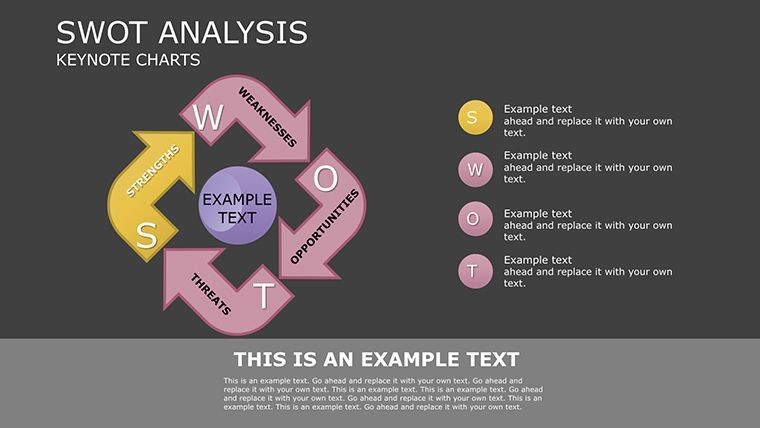
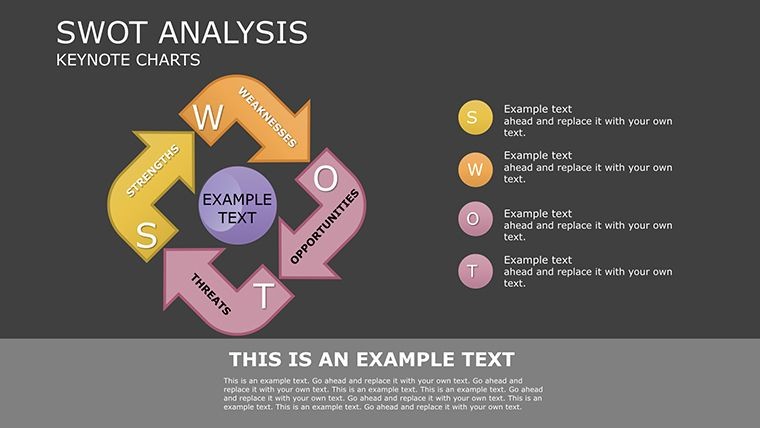
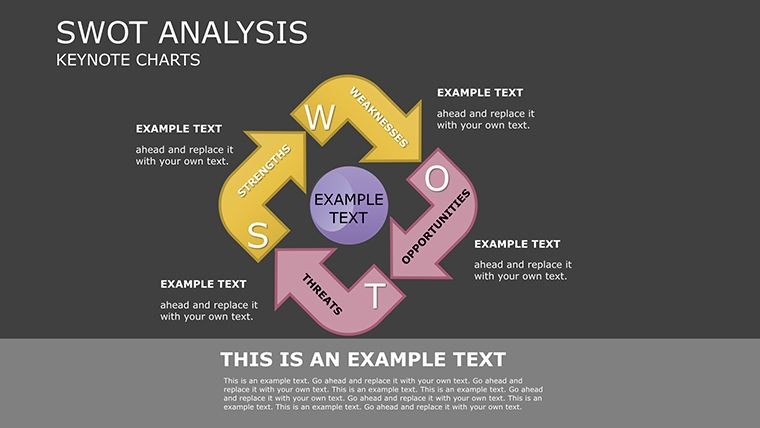
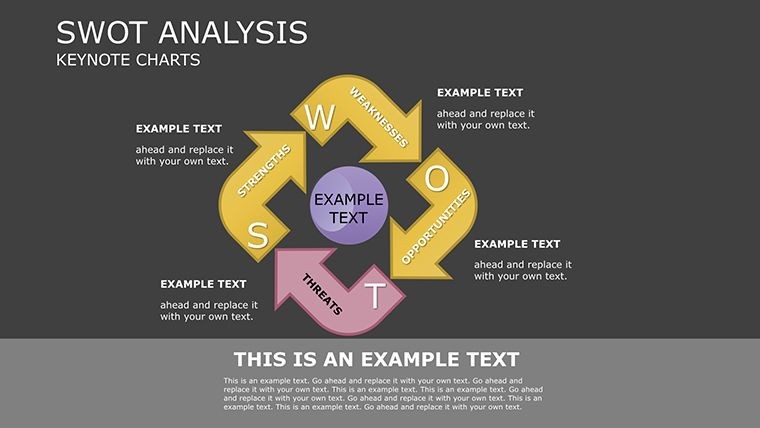
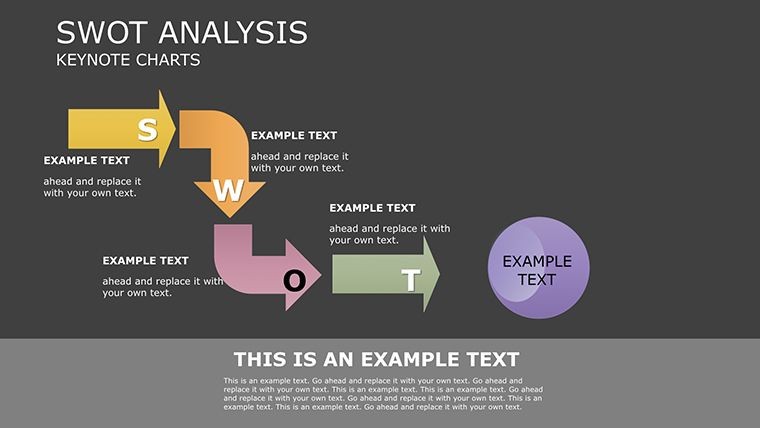
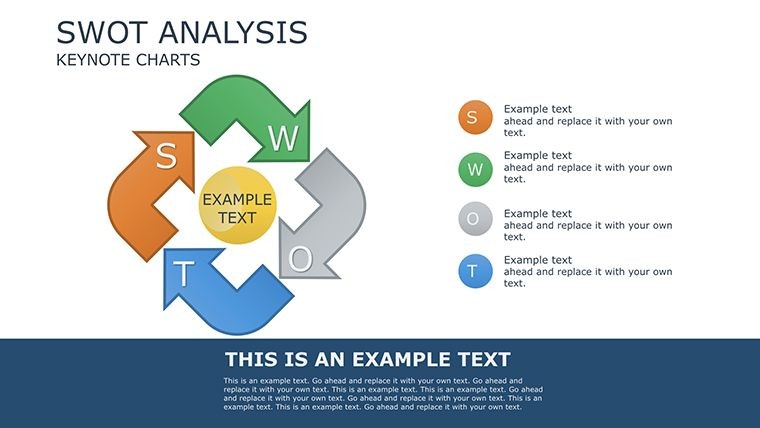
 Click to zoom
SWOT Analysis Keynote Charts: Decode Your Business Landscape
| Format | .pptx |
| Slides | 22 unique layouts |
| Aspect ratio | 16:9 |
| Compatibility | PowerPoint |
| Animated | No |
| Language | English |
| License | Commercial |
| File size | — |
| Version | v1.0 |
| Last updated | September 2021 |
What's inside
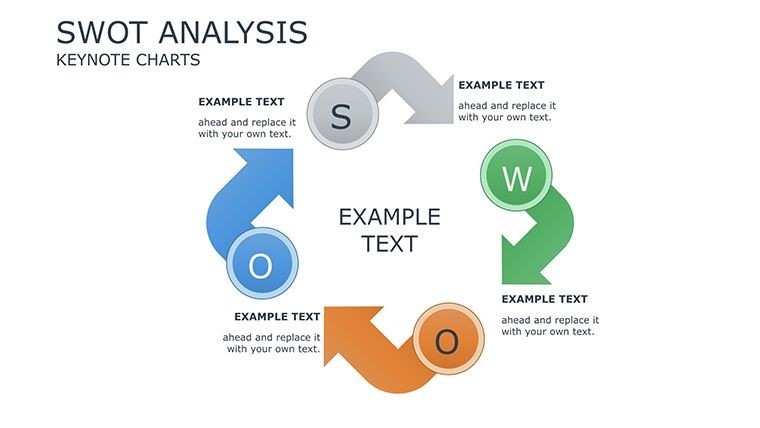
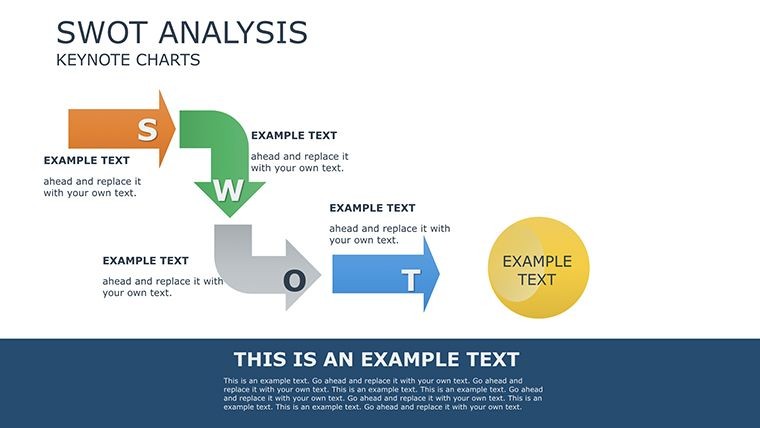
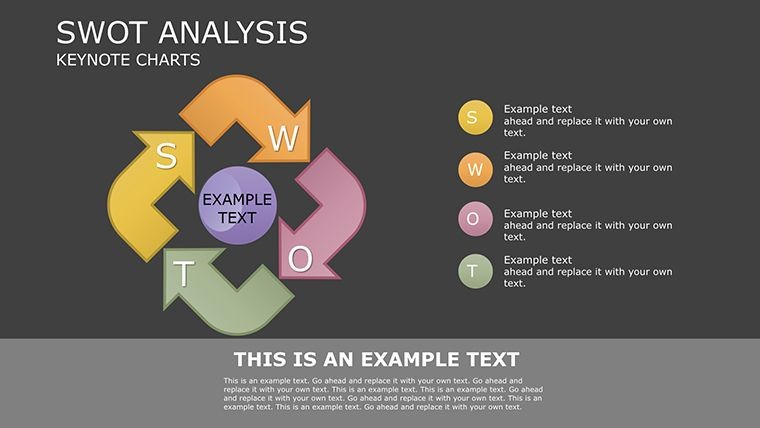
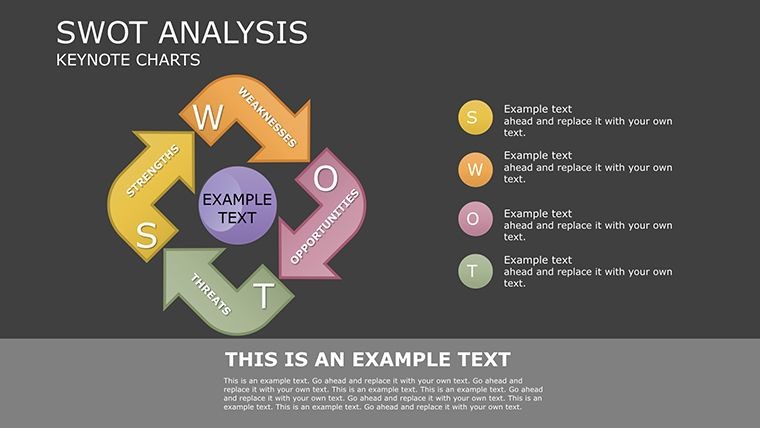
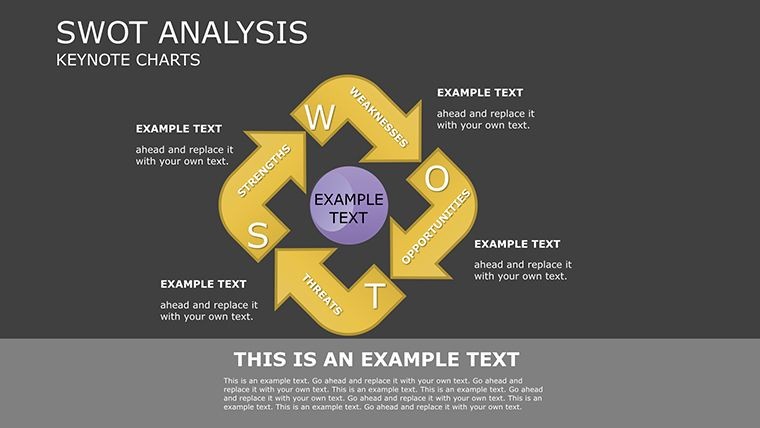
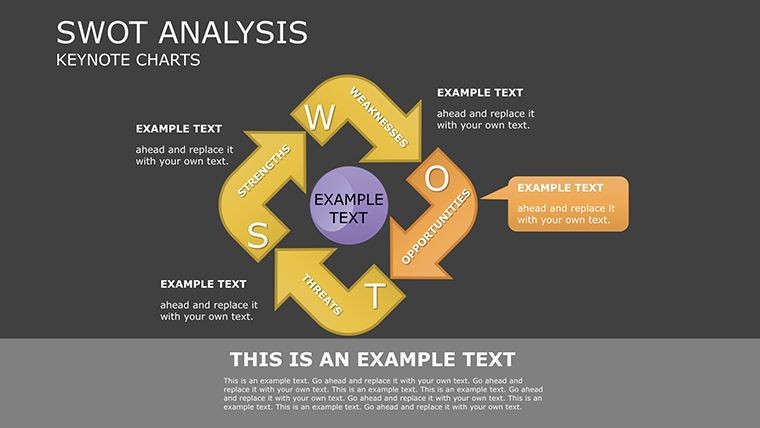
In the high-stakes world of corporate strategy, clarity isn't a luxury - it's a necessity. Enter the SWOT Analysis Keynote Charts template, a powerhouse of 22 editable slides engineered to dissect strengths, weaknesses, opportunities, and threats with surgical precision. Tailored for executives navigating market turbulence or analysts plotting competitive edges, this template transforms abstract assessments into actionable visuals. Drawing from frameworks like those in Michael Porter's competitive strategy playbook, it empowers you to not just analyze, but anticipate.
Why does it matter? In an era where decisions hinge on data, a poorly visualized SWOT can bury insights under clutter. This template counters that with elegant, modular designs - think quadrant matrices that expand into detailed breakdowns, color-coded quadrants for instant scanning, and integrated scoring systems for prioritizing factors. Compatible with Keynote's robust ecosystem, it's your shortcut to presentations that command attention and catalyze change.
Standout Features for Strategic Depth
Crafted with input from seasoned strategists, this SWOT Keynote Charts template goes beyond basics. Its 22 slides offer layered complexity, from simple 2x2 grids to advanced radar charts that quantify impact probabilities - mirroring tools used in McKinsey-style consulting decks.
- Quadrant Mastery: Four core slides dedicated to each SWOT element, with expandable text fields and icon libraries for visual punch.
- Quantitative Layers: Built-in rating scales (1-10) and probability sliders to weigh factors objectively, turning qualitative gut feels into data-backed arguments.
- Integration Tools: Cross-referencing hyperlinks between slides, so threats on slide 12 link back to mitigating strengths on slide 3.
- Export Flexibility: Seamless conversion to PDF or PowerPoint, maintaining interactive elements for collaborative reviews.
A real-world win: A fintech startup's CMO used slide 15's opportunity matrix to pivot their go-to-market strategy, identifying a 30% revenue upside from untapped partnerships - validated in their next quarter's earnings call.
Navigating the Slides: A Strategic Roadmap
Each slide is a building block in your SWOT fortress. Here's a guided tour to spark your creativity.
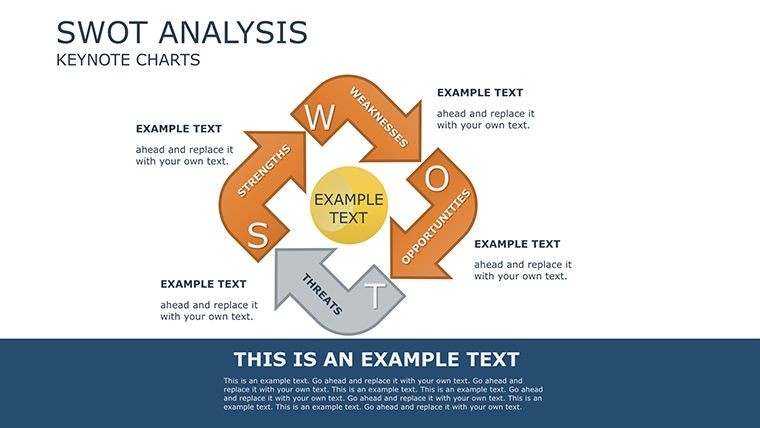
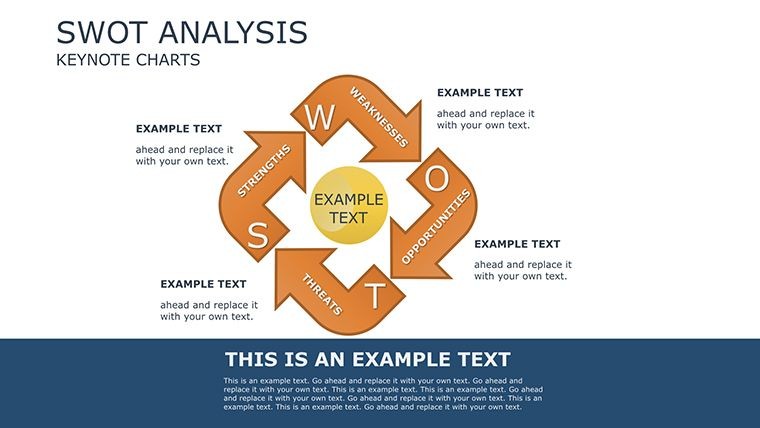
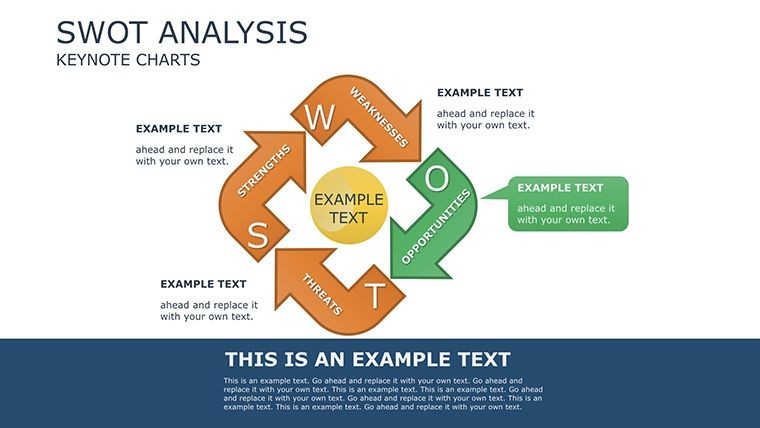
- Slide 1: SWOT Overview Dashboard – A holistic infographic summarizing all quadrants, with progress bars for completion status.
- Slides 2-5: Strengths Deep Dive – Bullet hierarchies, SWOT wheels, and comparative bars to benchmark against competitors like in Gartner reports.
- Slides 6-9: Weaknesses Audit – Gap analysis charts, fishbone diagrams for root causes, and remediation timelines.
- Slides 10-13: Opportunities Horizon – Trend radars, scenario funnels, and PESTLE overlays for external scanning.
- Slides 14-17: Threats Radar – Risk heat maps, contingency trees, and sensitivity analyses.
- Slides 18-20: Synthesis Matrices – TOWS strategies (threats-opportunities-weaknesses-strengths) for action planning.
- Slides 21-22: Action Roadmap & Recap – Gantt integrations and executive summaries with KPI trackers.
For non-profits, adapt the threats radar to geopolitical risks, ensuring compliance with standards from organizations like the Nonprofit Risk Management Center.
Applications That Drive Results
This template thrives in boardrooms, workshops, and one-on-ones. In mergers and acquisitions, use the synthesis matrices to align teams on post-deal synergies. Marketing leads can harness opportunity horizons for campaign brainstorming, as seen in a Coca-Cola-esque pivot toward digital trends.
Implement with this workflow:
- Gather Inputs: Brainstorm with stakeholders using collaborative tools like Miro, then import to Keynote.
- Populate Quadrants: Assign scores via slide formulas - yes, simple calculations are embedded for auto-updates.
- Visualize Risks: Apply conditional formatting: green for strengths, red for threats, for at-a-glance insights.
- Simulate Scenarios: Duplicate slides for what-if analyses, testing resilience against market shifts.
- Present with Poise: Leverage Keynote's notes pane for speaker cues tied to each visual.
Versus off-the-shelf SWOT tools, this saves 50% on design time, with users citing its modularity as a game-changer for iterative planning.
Expert Hacks for Maximum Impact
Channel Edward Deming's quality principles: Focus on actionable items, limiting each quadrant to 5-7 entries. Incorporate diverse perspectives - pair with anonymous surveys for unbiased weaknesses. For virtual pitches, embed hyperlinks to source docs, boosting credibility.
Seize your strategic advantage - grab the SWOT Analysis Keynote Charts template now and turn analysis into ascent. Check our strategy suite for complementary tools.
Frequently Asked Questions
How does this template handle quantitative SWOT data?
It includes scoring sliders and auto-calculating fields to quantify impacts, making your analysis more robust than traditional lists.
Is it suitable for team collaborations?
Yes, share via Keynote's cloud sync or export to shared drives, preserving edits for group input.
Can I customize colors for brand alignment?
Effortlessly - global theme swaps apply across all 22 slides in one click.
What's the learning curve for non-experts?
Minimal; guided tooltips and video tutorials get you up to speed in 15 minutes.
Does it support international formats?
Absolutely, with metric/imperial toggles and multilingual icon sets.
How often are updates released?
Quarterly, incorporating user feedback and new Keynote features.
Good for
- Project roadmaps and sprint plans
- Product launch timelines
- Quarterly or annual review decks
- Company history and milestone summaries
Licence
reviews
Made office slides and charts were easy to read
Used for school assignment and it worked fine
Nothing special in design but practical
Some slides feel similar but usable
FAQ
Will it work in Google Slides?
Are fonts embedded?
Can I use this for client work?
What's the refund policy?
Do you update the template after purchase?
Similar templates
See all Keynote Charts →


All 22 slides