 Click to zoom
Simple and Useful Tricks for Analysis Keynote Charts
| Format | .pptx |
| Slides | 28 unique layouts |
| Aspect ratio | 16:9 |
| Compatibility | PowerPoint |
| Animated | No |
| Language | English |
| License | Commercial |
| File size | — |
| Version | v1.0 |
| Last updated | January 2022 |
What's inside
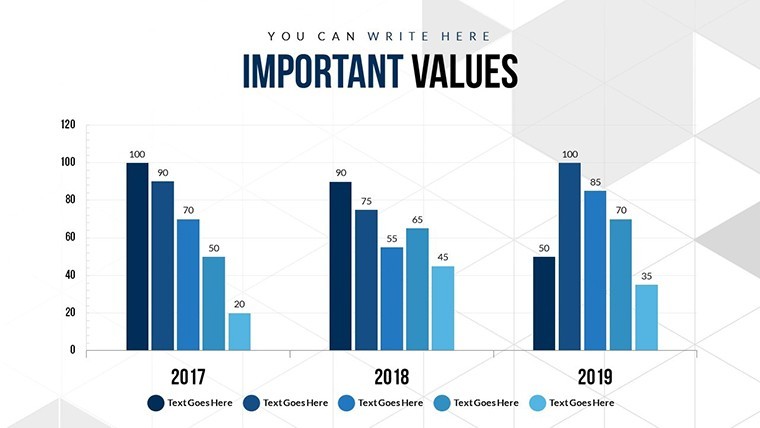
In today's fast-paced business environment, conveying complex data effectively can make or break your presentation. Imagine having a toolkit that transforms raw numbers into compelling visuals, saving you hours of design work while captivating your audience. Our Simple and Useful Tricks for Analysis Keynote charts template is designed precisely for professionals like you - analysts, managers, and educators who need to present insights with clarity and flair. With 28 fully editable slides, this template focuses on cycle and pie charts, ideal for illustrating processes, distributions, and trends. Whether you're pitching a new strategy to stakeholders or teaching concepts in a workshop, these charts come with color variations, custom animations, vector icons, and PNG files to enhance your narrative. Compatible with iWork Keynote on Mac, it's easy to customize colors, text, and photos, ensuring your presentation aligns perfectly with your brand. Say goodbye to bland slides and hello to engaging, professional visuals that drive decisions and inspire action.
Key Features That Set This Template Apart
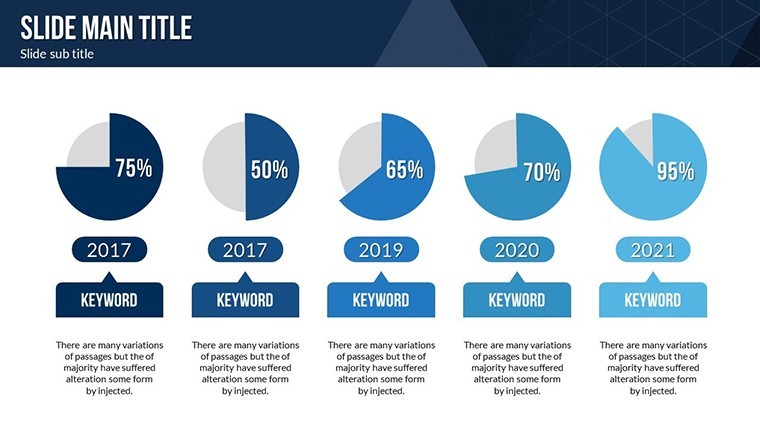
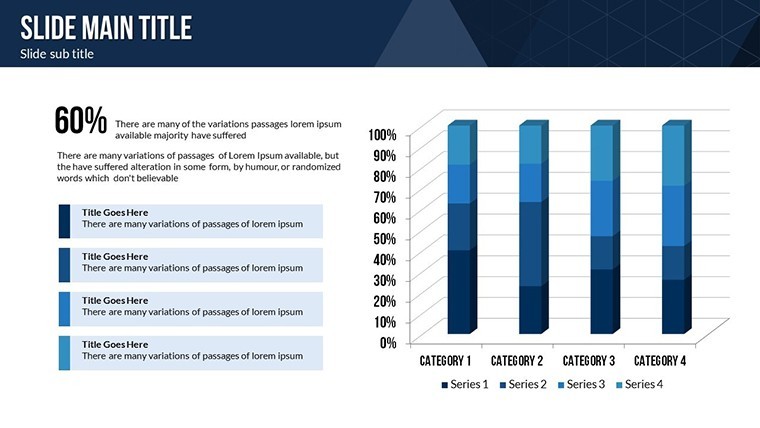
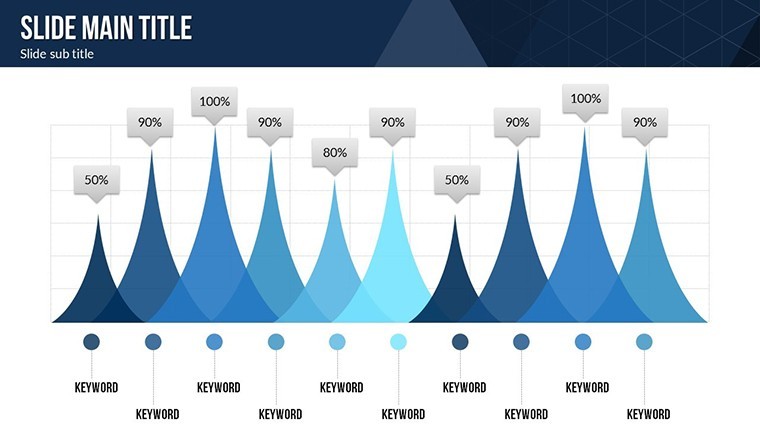
What makes this Keynote charts template a must-have? It's not just about the quantity of slides but the quality and versatility they offer. Each of the 28 slides is crafted with precision, incorporating modern design principles to ensure your analysis stands out. For instance, the cycle charts allow you to depict iterative processes like product development lifecycle or marketing funnels, where each stage flows seamlessly into the next. Pie charts, on the other hand, excel at showing proportions, such as market share breakdowns or budget allocations, making abstract data tangible and easy to grasp.
- Color Full Variations: Choose from a palette of vibrant colors to match your corporate identity or emphasize key data points, ensuring visual consistency across your deck.
- Custom Animated Effects: Bring your charts to life with subtle animations that reveal data progressively, keeping your audience engaged without overwhelming them.
- Vector Icons and PNG Included: Access a library of scalable icons for added illustration, perfect for highlighting steps in a cycle or segments in a pie chart.
- Fully Editable Elements: Adjust every aspect - from fonts and layouts to images - making it adaptable for any analytical scenario.
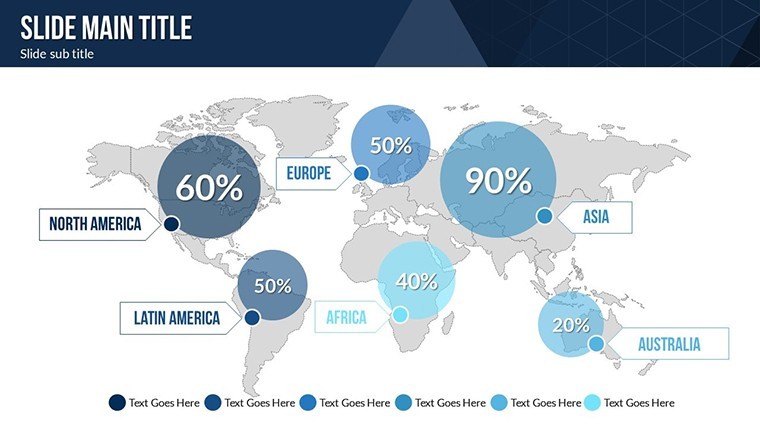
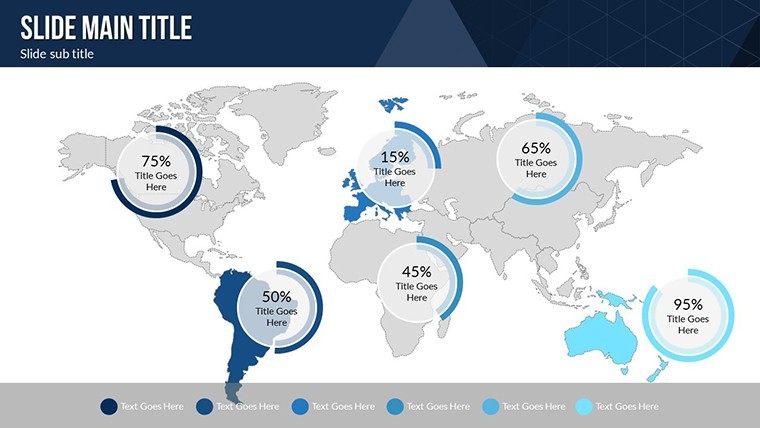
- World Maps and Illustrations: Integrate global perspectives with included maps, ideal for international business analysis or regional data comparisons.
These features draw from best practices in data visualization, inspired by experts like Edward Tufte, who emphasize clarity and efficiency in presenting information. By using this template, you're not just creating slides; you're crafting stories that resonate.
Real-World Applications and Use Cases
Let's dive into how this template can be applied in everyday professional settings. Picture a financial analyst preparing a quarterly report: Use the pie charts to showcase revenue streams by category, animating each slice to appear one by one for dramatic effect. This approach not only highlights key contributors but also facilitates discussion on underperforming areas.
In project management, cycle charts become invaluable for outlining workflows. For example, in an agile team retrospective, map out the sprint cycle - from planning to review - using customizable icons to represent team roles. This visual aid helps identify bottlenecks and fosters collaborative improvements, much like how companies like Google use similar tools in their OKR frameworks.
Educators and trainers will appreciate the template's versatility too. When teaching statistics, employ pie charts to demonstrate probability distributions, adding world maps for real-world examples like global population demographics. The animations ensure students follow along without getting lost in static data dumps.
- Customize Your Charts: Open the .key file in Keynote and select a slide. Edit text placeholders with your data, then tweak colors via the inspector panel for instant updates.
- Add Animations: Use Keynote's build effects to animate chart elements, such as having cycle arrows rotate smoothly to simulate process flow.
- Incorporate Icons: Drag and drop included vector icons onto slides, resizing them without loss of quality to enhance visual appeal.
- Present with Confidence: Rehearse with the full deck, leveraging the editable photos to include relevant images, like team photos in a company overview cycle.
Compared to basic Keynote tools, this template offers pre-built sophistication, reducing design time by up to 70% while adhering to accessibility standards like high-contrast colors for better readability. It's like having a design consultant at your fingertips, ensuring your presentations meet professional benchmarks.
Detailed Slide Breakdown
To give you a clearer picture, here's a breakdown of select slides:
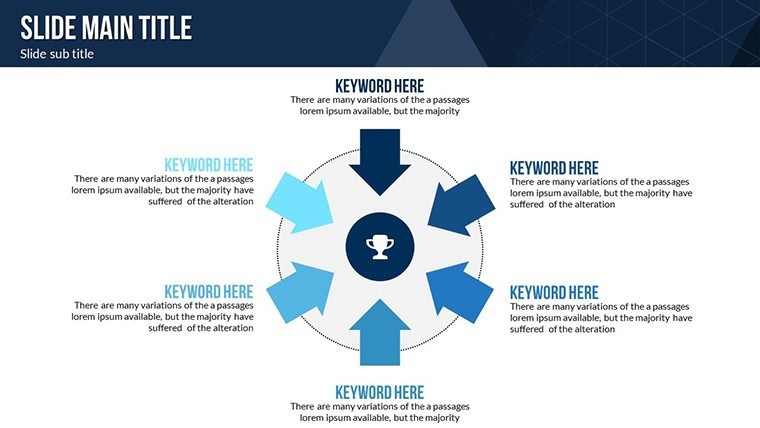
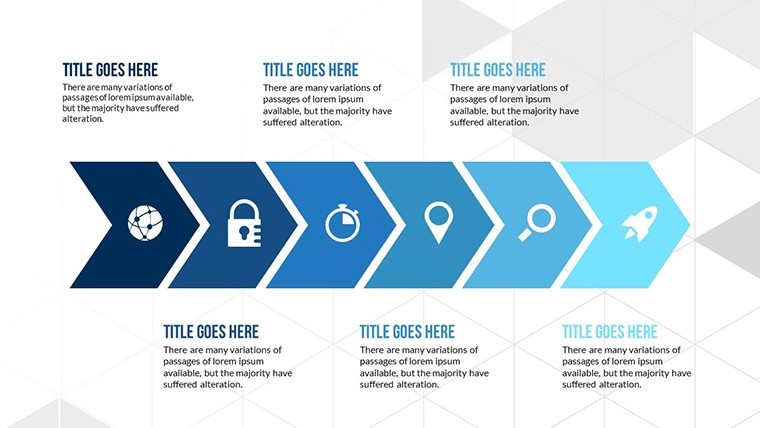
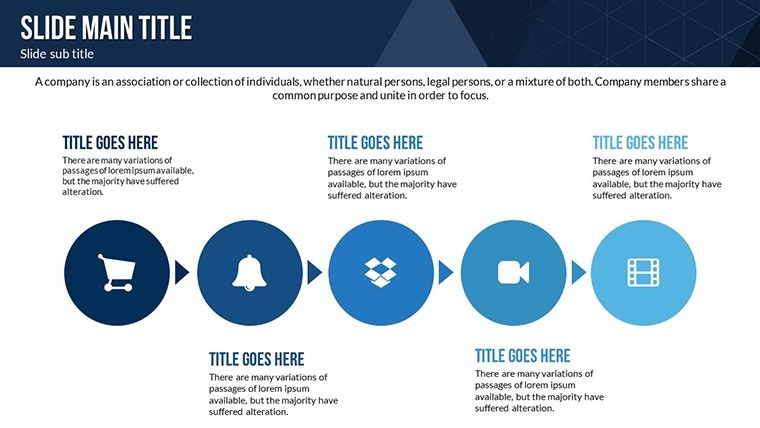
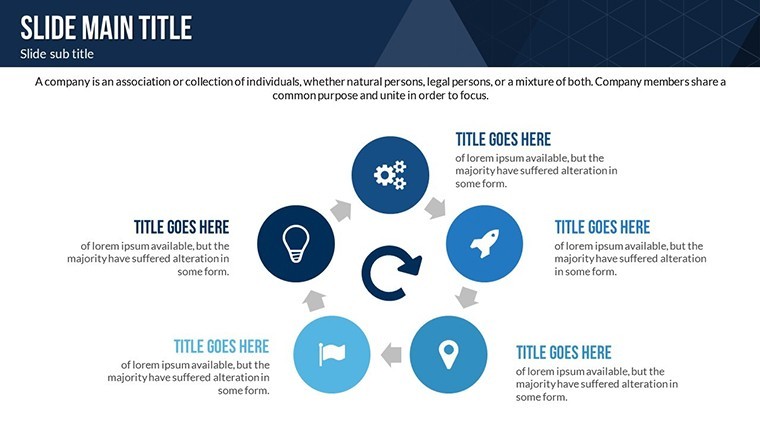
- Slide 1-5: Basic Cycle Charts: Simple loops for introductory processes, with options for 3-6 stages, each with icon placeholders.
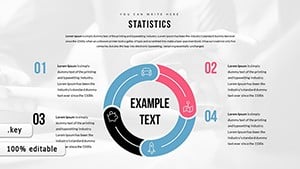
- Slide 6-10: Advanced Pie Charts: Multi-segment pies with data labels, supporting up to 8 categories, and animation for segment explosion effects.
- Slide 11-15: Combined Visuals: Hybrid slides merging cycles and pies, useful for showing how processes lead to outcomes, like sales cycles resulting in market share pies.
- Slide 16-20: Map-Integrated Charts: World maps overlaid with pie charts for geographic data, editable for country-specific highlights.
- Slide 21-28: Illustration-Enhanced Slides: Custom illustrations complementing charts, with full editability for tailored storytelling.
These slides are optimized for widescreen formats, ensuring they look sharp on any projector or screen share. Tips for maximum impact include using consistent fonts (e.g., Helvetica for modernity) and limiting text to bullet points, allowing visuals to take center stage.
Why Choose This Template for Your Next Presentation?
In a world where attention spans are short, this template empowers you to deliver punchy, persuasive analysis. Drawing from real-world successes, such as how firms like McKinsey use cycle charts in strategy decks to win clients, you'll gain an edge in communicating ideas. It's not just about data - it's about driving results, whether closing a deal or educating a team.
Integrate it seamlessly into your workflow: Start with data import from Excel, customize in Keynote, and export to PDF for sharing. For those new to animations, our included effects are beginner-friendly yet professional-grade.
Elevate your analysis game today - download this versatile Keynote charts template and turn data into decisions.
Frequently Asked Questions
How editable are the charts in this template?
Every element is fully editable; you can change colors, text, sizes, and even replace icons or add your own photos directly in Keynote.
Is this template compatible with older versions of Keynote?
Yes, it works with iWork Keynote versions from 6.0 onward, ensuring broad compatibility on Mac devices.
Can I use these charts for commercial presentations?
Absolutely, the template is licensed for both personal and commercial use, making it ideal for business pitches and reports.
What file formats are included?
The download includes .key files for Keynote, along with vector icons and PNG images for additional customization.
How do the animations enhance my presentation?
Custom animations reveal data step-by-step, improving audience retention and making complex cycles or pies easier to follow.
Good for
- Project roadmaps and sprint plans
- Product launch timelines
- Quarterly or annual review decks
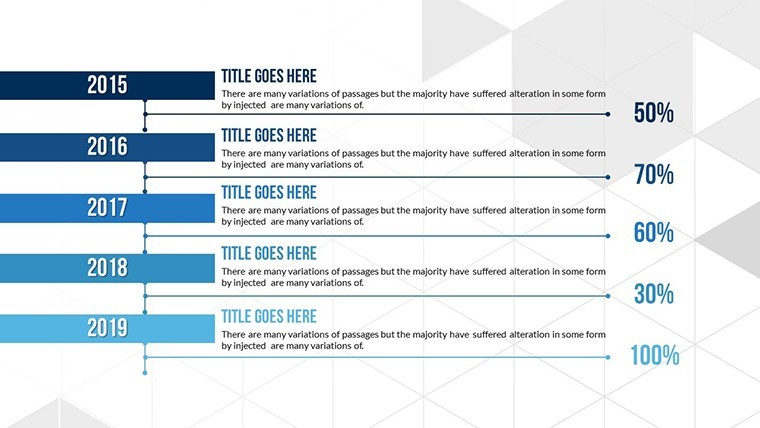
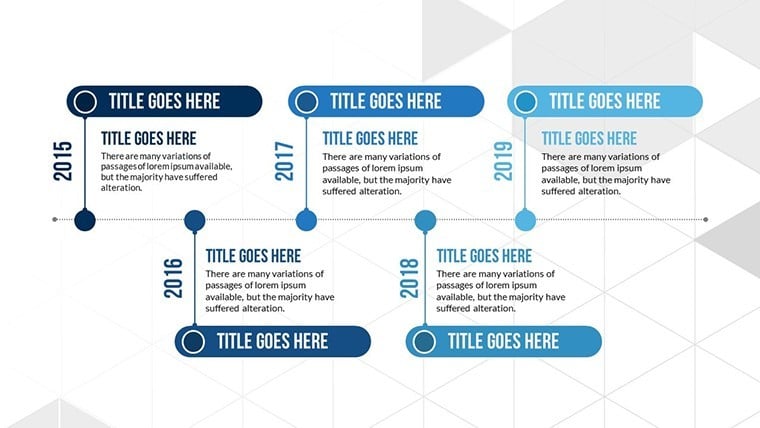
- Company history and milestone summaries
Licence
reviews
Downloaded this before a last minute presentation.
The graph layouts looked decent on screen.
A few icons felt outdated.
Overall helped me save time.
FAQ
Will it work in Google Slides?
Are fonts embedded?
Can I use this for client work?
What's the refund policy?
Do you update the template after purchase?
Similar templates
See all Keynote Charts →


All 28 slides