 Click to zoom
SWAP Folium Objects PowerPoint Template - Geo Charts
| Format | .pptx |
| Slides | 18 unique layouts |
| Aspect ratio | 16:9 |
| Compatibility | PowerPoint |
| Animated | No |
| Language | English |
| License | Commercial |
| File size | — |
| Version | v1.0 |
| Last updated | March 2023 |
What's inside
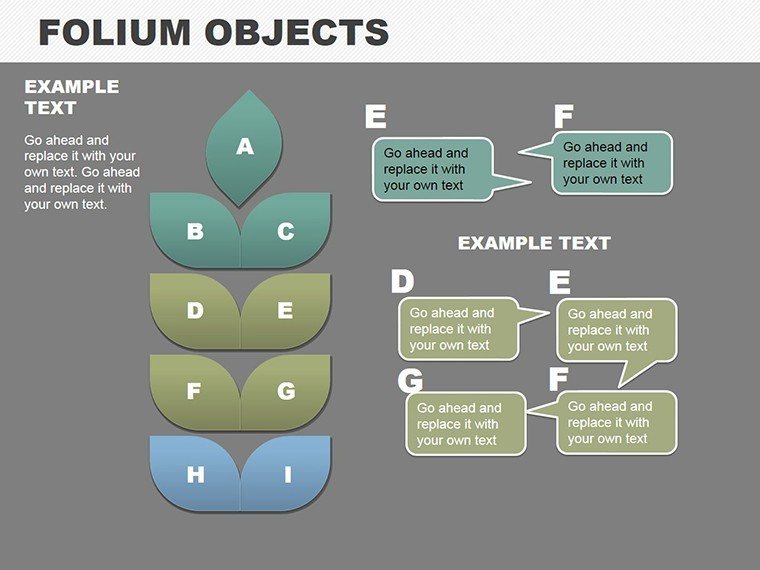
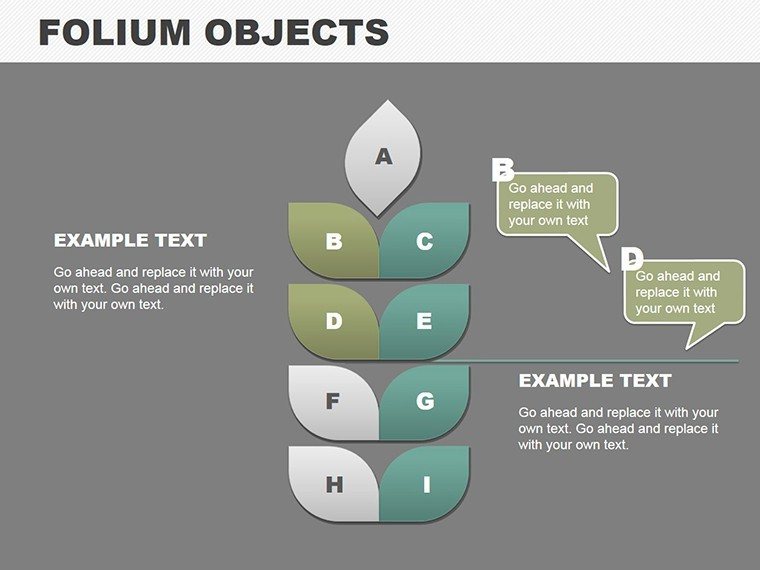
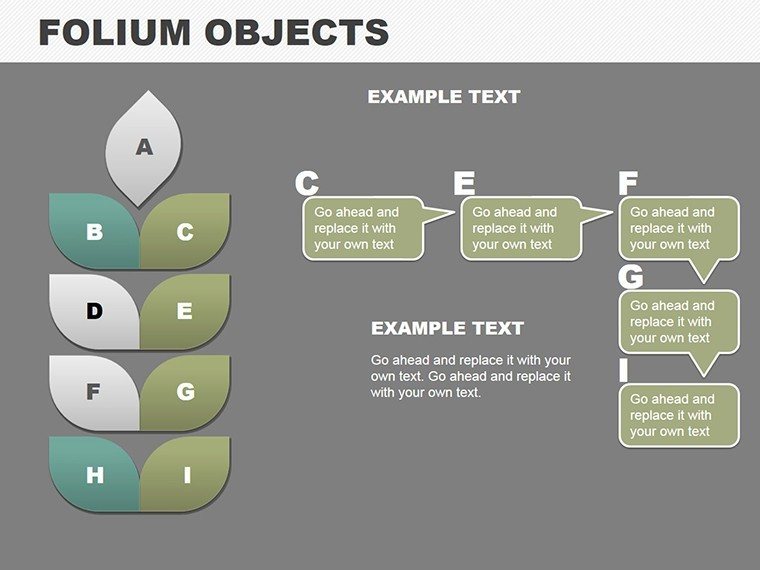
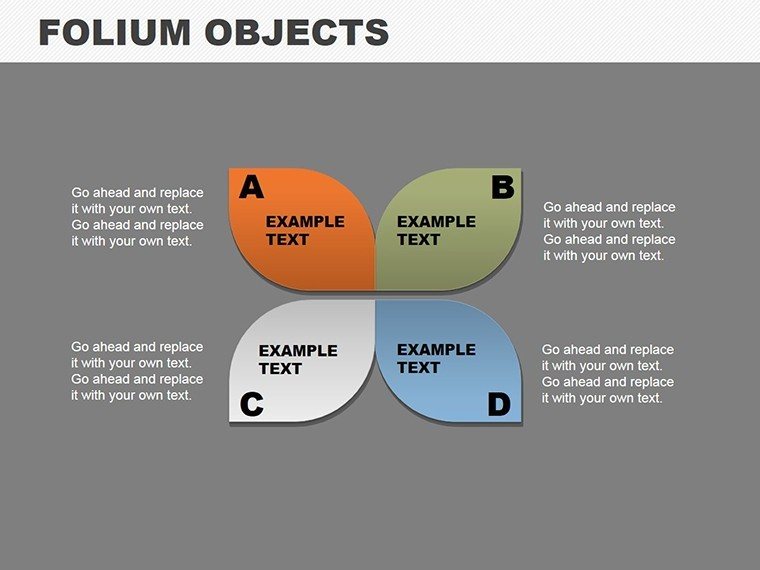
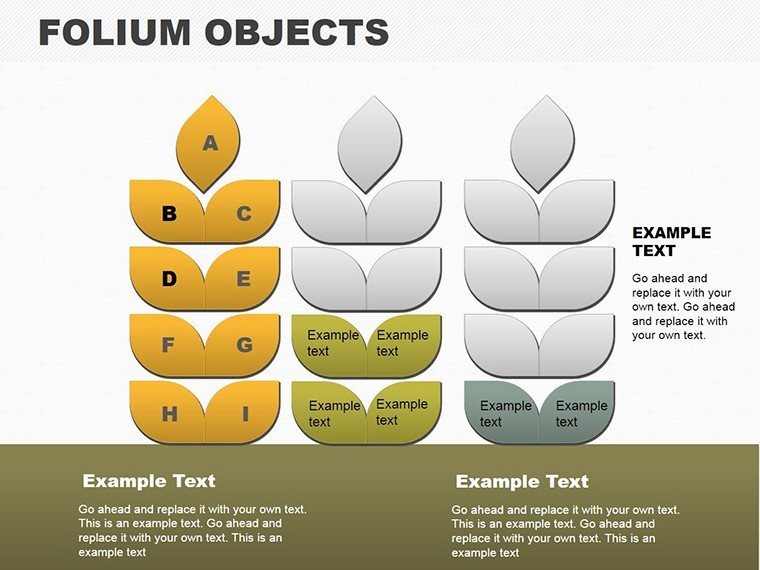
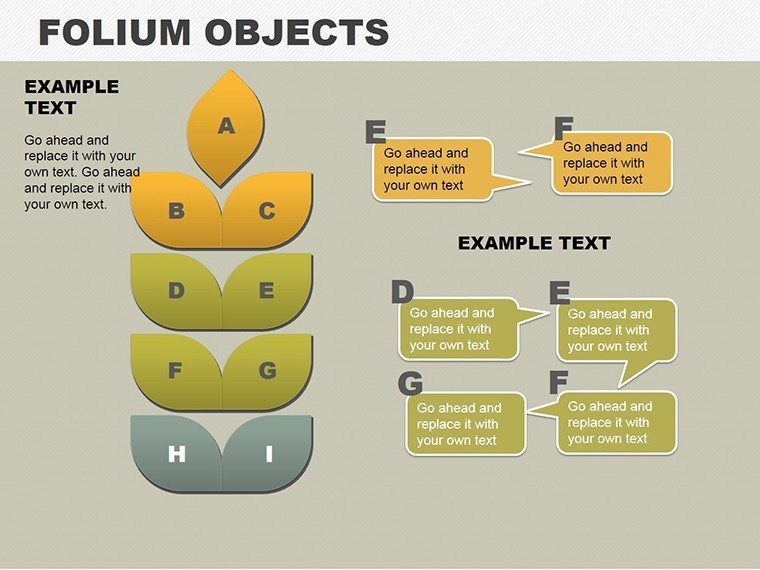
In an era where location data drives decisions, our SWAP Folium Objects PowerPoint Template offers a sophisticated solution for integrating maps and charts seamlessly. With 18 editable slides, this template specializes in folium-inspired objects - interactive map elements - that pair with traditional graphs for comprehensive geo-visualizations. Whether you're an urban planner mapping development zones per APA standards or a marketer analyzing regional sales, these tools turn spatial data into compelling stories that inform and influence.
Blending clean, modern design with powerful functionality, it's tailored for professionals who need to convey geographic contexts without complexity, ensuring your presentations are as insightful as they are visually striking.
Geo-Visualization: Merging Maps and Metrics
Folium objects, drawing from open-source mapping tech, enable interactive layers like markers and heatmaps within PowerPoint. This template embodies that, offering matrix-style layouts where maps intersect with bar, pie, and line graphs. Aligning with GIS best practices from ESRI, it promotes accurate spatial representations that enhance data integrity.
What distinguishes it is the SWAP mechanism - switch, adapt, populate - for quick reconfiguration, ideal for dynamic fields like real estate or epidemiology, where maps reveal patterns charts alone miss.
Core Features Enhancing Geo-Data Handling
The template's strength lies in its geo-centric features. High-resolution map bases are customizable, with marker and label edits for precise annotations. Vector charts ensure clarity, scalable for detailed zooms.
- Interactive Folium Elements: Add clickable markers, polygons, and choropleths for layered insights.
- Chart Variety: Bar, pie, and line integrations tied to map data.
- Customization Depth: Adjust colors, scales, and legends to match analytical needs.
- Data Connectivity: Link to CSV or Excel for geo-tagged updates.
- Compatibility: Smooth operation in PowerPoint and Google Slides.
In a marketing pitch, select a slide with a regional map, overlay sales pies, and SWAP data to highlight top performers, creating an interactive narrative that engages clients.
Slide-by-Slide Geo Toolkit
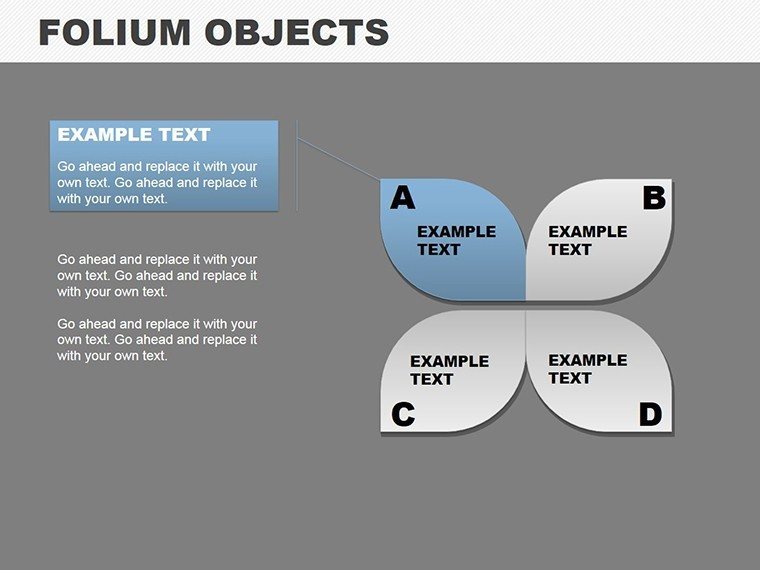
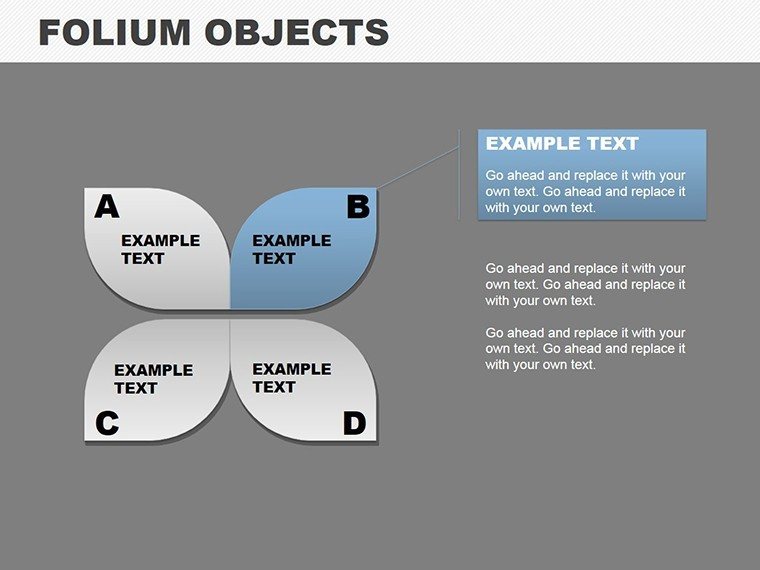
Starting with Slide 1's base map for overviews, progressing to Slides 2-7 with marker-focused folium objects for point data. Slides 8-12 introduce matrix charts, combining geo with quantitative visuals.
Final Slides 13-18 offer advanced hybrids, like heatmaps with line graphs for trend analysis. Each includes thematic icons for geo-themes, facilitating quick assembly of professional decks.
Targeted Applications in Spatial Analysis
This template thrives in geo-intensive scenarios. In academia, use it for lectures on climate patterns, with maps showing temperature gradients via folium layers. Business reports benefit from visualizing supply chains, identifying bottlenecks geographically.
Real-world examples include urban planning firms using it for zoning proposals, or health organizations mapping outbreak data, as seen in WHO-inspired visualizations. Its matrix category supports comparative geo-studies, boosting analytical depth.
- Collect Geo-Data: Gather coordinates, metrics, and categories.
- Select Folium Base: Choose maps or matrices suiting your scale.
- SWAP Elements: Switch views, adapt visuals, populate with data.
- Refine Integration: Align charts with maps for cohesive stories.
- Validate and Share: Check accuracy and present interactively.
This streamlined workflow accelerates creation, often halving time for complex geo-presentations.
Advanced Tips for Geo-Chart Excellence
Employ projections wisely - use Mercator for global views, local for precision. Ensure data privacy in maps, complying with GDPR. Enhance with tooltips on hover (in presentation mode), adding layers of info without clutter.
Balance visuals: Pair busy maps with simple charts, following cartographic principles for optimal readability and impact.
Unleash Geo-Insights with SWAP
Ready to map your success? Download this Folium Objects Template and elevate your presentations to new dimensions of understanding.
Frequently Asked Questions
What are Folium Objects in this context?
Interactive map elements like markers and layers, emulated in PowerPoint for geo-visuals.
Can I import real map data?
Yes, via embeddings or links to tools like Google Maps.
Is it for advanced users only?
No, user-friendly with guides for all levels.
How do I handle large datasets?
Use summarization in charts, detail in maps for balance.
Are updates dynamic?
Link to sources for refreshes, keeping content current.
Good for
- Project roadmaps and sprint plans
- Product launch timelines
- Quarterly or annual review decks
- Company history and milestone summaries
Licence
reviews
Used these charts for a finance team presentation.
The comparison graphs were the most useful part for me.
I don’t care much about visuals but it looked organized.
A couple slides needed resizing adjustments.
FAQ
Will it work in Google Slides?
Are fonts embedded?
Can I use this for client work?
What's the refund policy?
Do you update the template after purchase?
Similar templates
See all PowerPoint Charts →
All 18 slides