 Click to zoom
Innovative Folium Objects Keynote Charts Pack
| Format | .pptx |
| Slides | 18 unique layouts |
| Aspect ratio | 16:9 |
| Compatibility | PowerPoint |
| Animated | No |
| Language | English |
| License | Commercial |
| File size | — |
| Version | v1.0 |
| Last updated | December 2024 |
What's inside
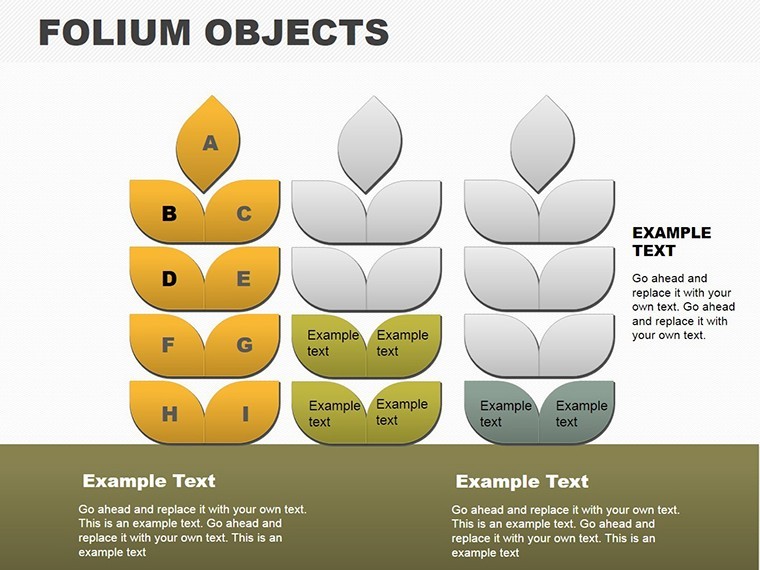
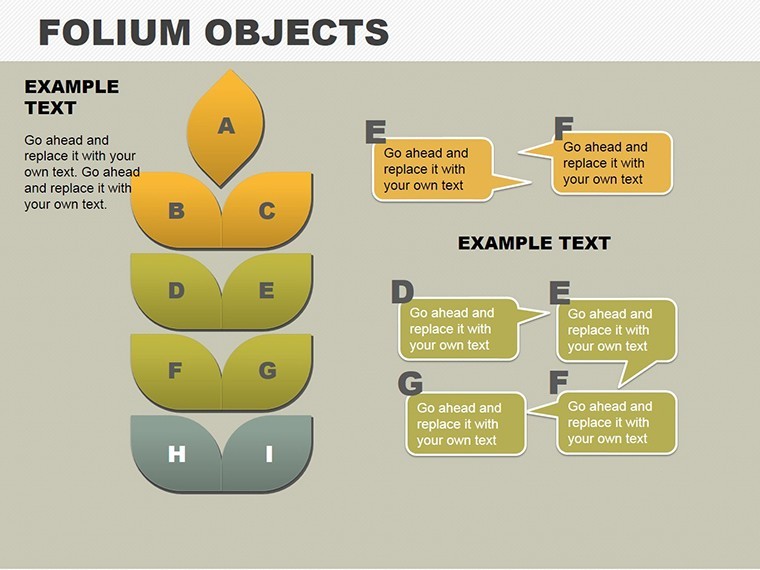
What if your data visualizations grew like leaves on a vine, branching organically to reveal hidden patterns in your architectural ecosystems? The Innovative Folium Objects Keynote Charts Template brings this biophilic dream to life with 18 slides that mimic nature's interconnected grace, perfect for landscape architects, environmental designers, and sustainability consultants crafting narratives around regenerative builds. Inspired by folium (Latin for leaf) motifs, it transforms rigid metrics into fluid forms, honoring biomimicry principles championed by Buckminster Fuller.
Traditional charts often feel as stiff as concrete slabs, failing to convey the living, adaptive nature of green infrastructure projects. This template remedies that, with leaf-veined diagrams that trace water runoff pathways in permeable pavements or canopy density maps for urban forests - veins thickening with flow volume for intuitive grasp. Built for Keynote's expressive canvas, it supports seamless sharing via iCloud, keeping your verdant visions vibrant across devices for fieldwork or studio syncs.
Grounded in ecological design theory from Janine Benyus, these folium elements prioritize relational storytelling. Cluster leaves for biodiversity indices in habitat restorations, or stem-lines for carbon sequestration timelines, shaded in seasonal palettes that evoke growth cycles. It's a catalyst for deeper engagement, with studies from the USGBC showing 25% better retention in nature-analog visuals for ESG reports.
Leafy Layers: Features Rooted in Organic Design
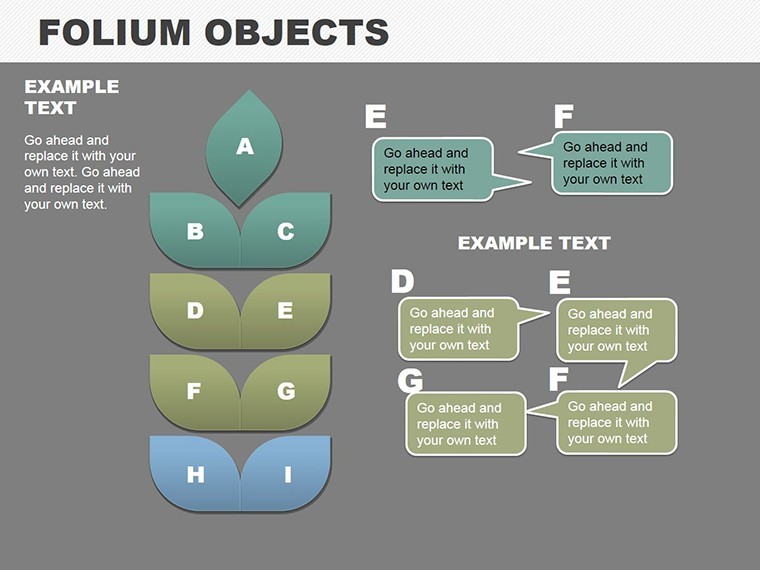
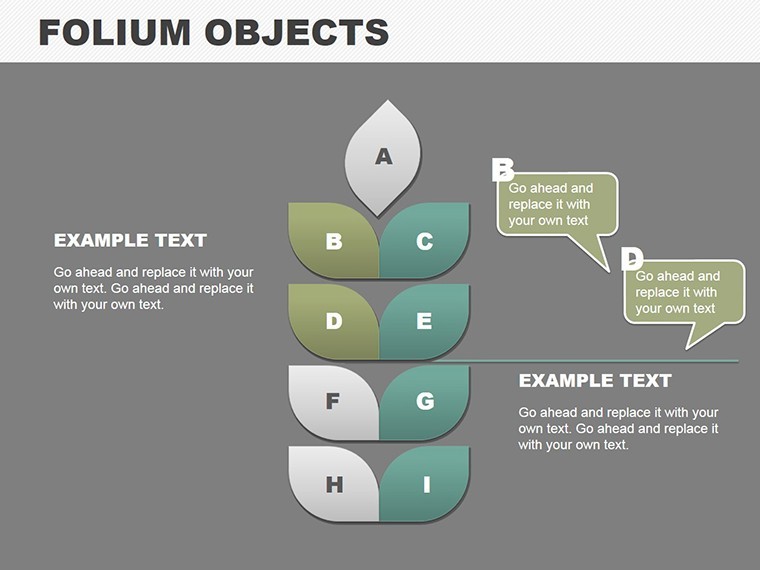
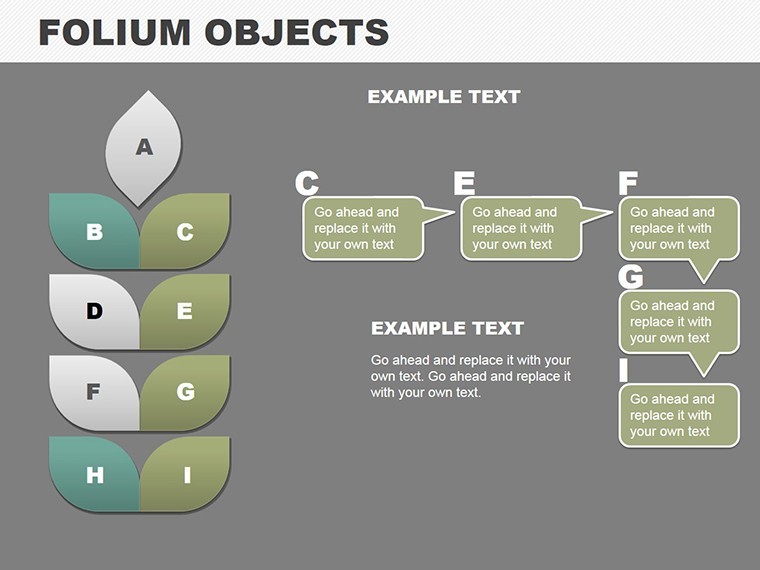
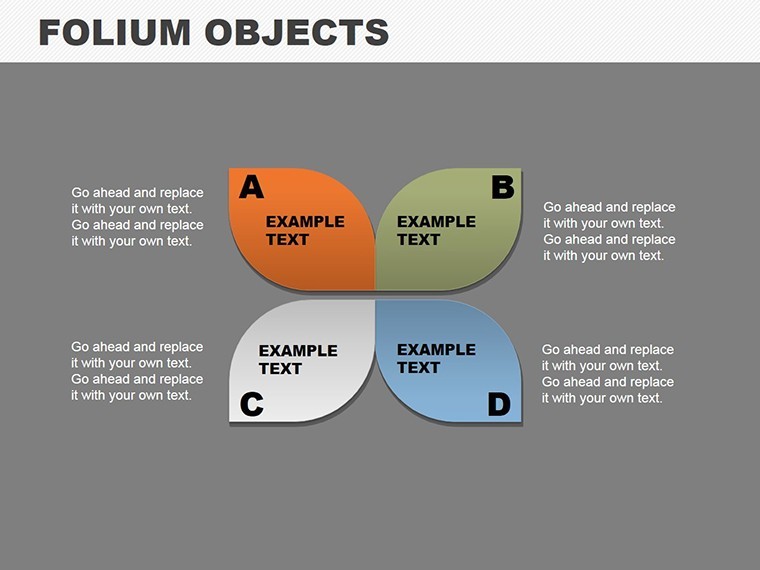
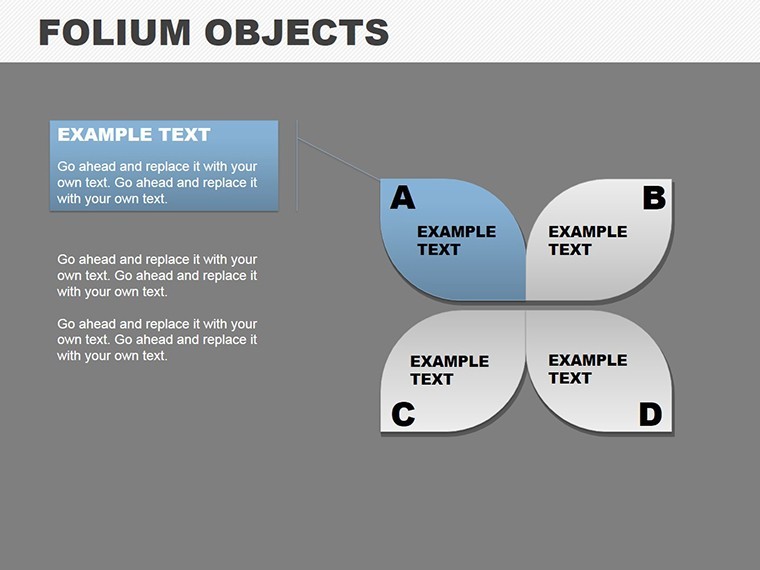
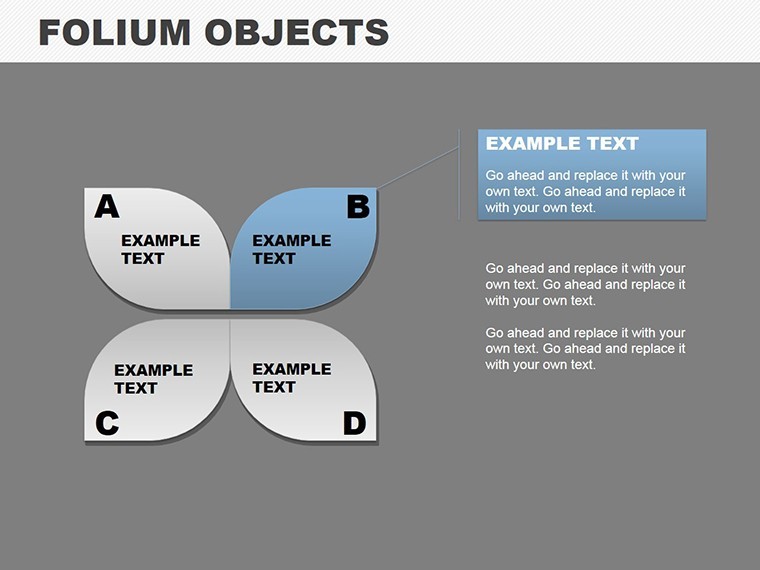
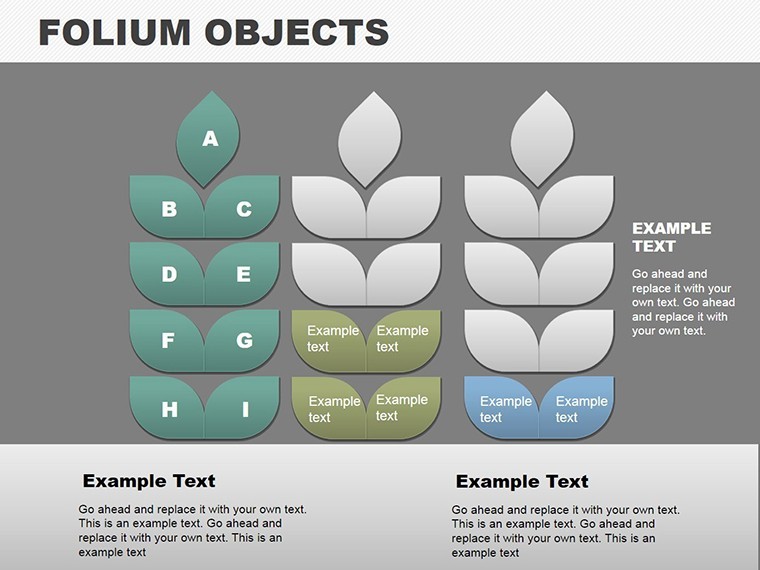
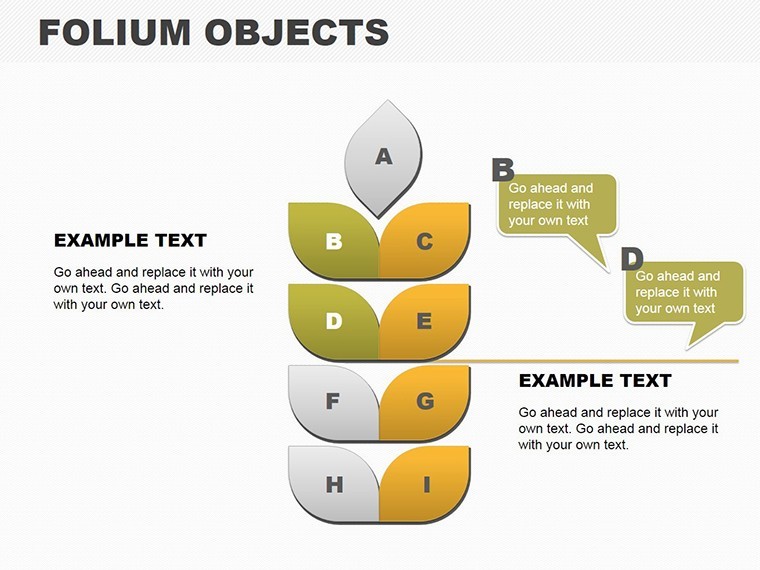
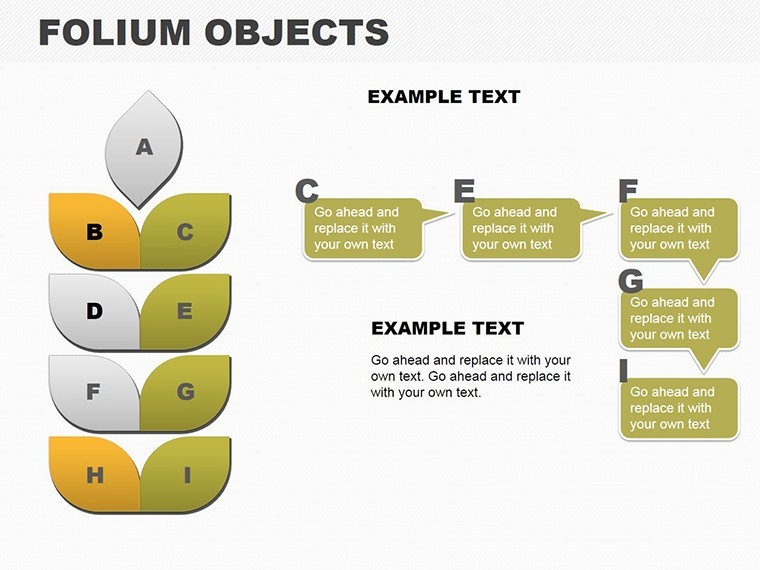
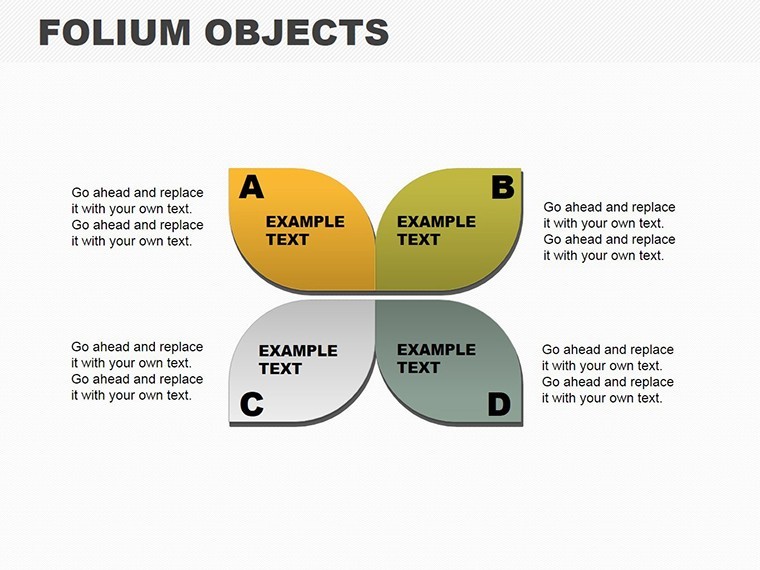
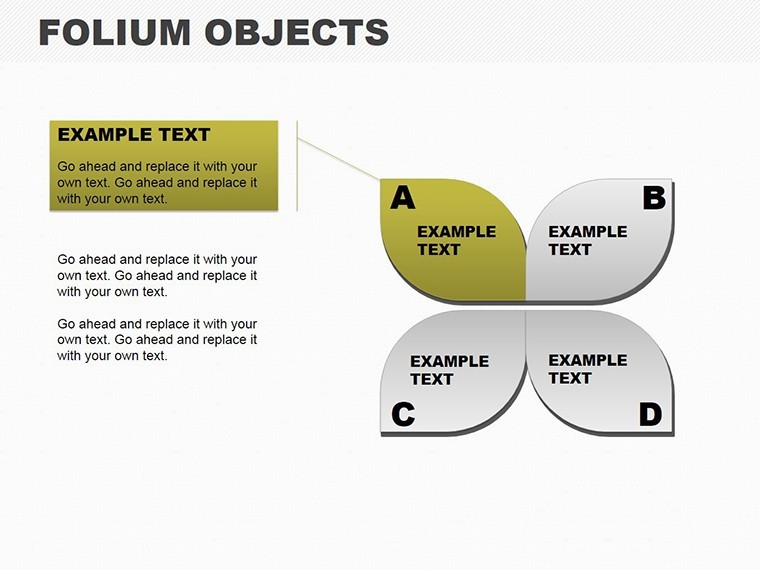
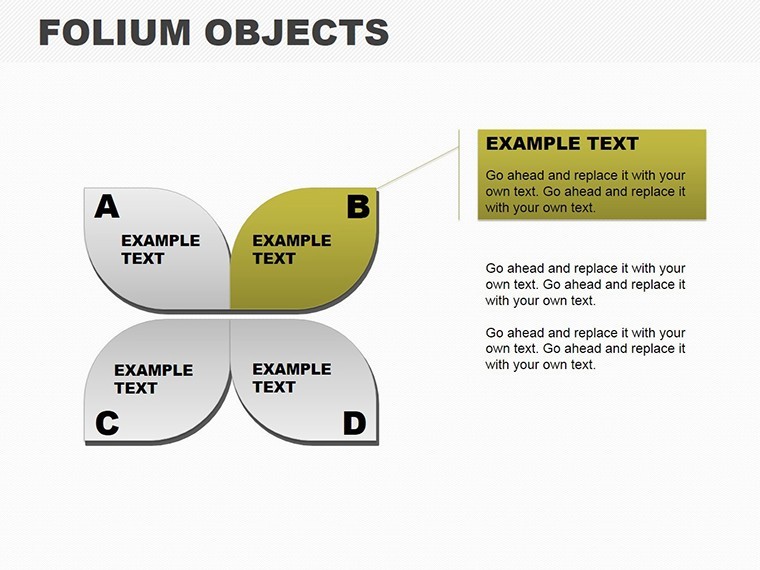
Central to this pack is the folium framework, where 12 chart types unfurl like fronds - from dendritic trees for decision branches in site selections to petal arrays for multi-criteria assessments.
- 18 Adaptable Slides: Parametric shapes that morph with data inputs, maintaining aesthetic harmony even as complexities branch out.
- Natural Theme Collections: Four biomes - temperate forests in mossy greens, arid adaptations in sandy beiges - extendable with custom gradients for hyper-local relevance.
- Bio-Icon Assortment: 180 symbols drawn from natural forms, like root systems for foundation loads or spore bursts for innovation clusters, all stroke-adjustable.
Customization blooms effortlessly: Prune branches via node deletion, infuse stats from climate APIs, and animate vein pulses to simulate nutrient flows. PowerPoint parity through conversion ensures it's not siloed to Apple ecosystems.
Unfurling the Slides: A Canopy of Content
- Canopy Openers (Slides 1-3): Broad leaf title with vein-embedded agenda, branching to reveal section tendrils like "Ecosystem Metrics."
- Branching Analyses (Slides 4-10): Folium hierarchies for impact assessments - stems for phases, leaves for sub-factors in stormwater modeling.
- Interwoven Webs (Slides 11-14): Tangled vines linking stakeholder influences, with leaf nodes sizing by influence in community-engaged planning.
- Fruitful Closures (Slides 15-18): Seed-pod summaries aggregating insights, with dispersal arrows to recommendations like "Plant Native Buffers."
Spotlight story: An eco-firm applied folium charts to a riverfront revitalization RFP, their organic flows outshining grid-based rivals, clinching a $30M commission by evoking the site's riparian soul.
Blossoming Applications: From Soil to Skyline
In regenerative landscape proposals, vein maps delineate root zones for tree plantings, quantifying shade equity across demographics. For bioclimatic modeling, fractal leaves fractalize solar gain distributions, forecasting passive cooling potentials with leafy elegance.
Superior to fractal plugins, these integrate natively: Layer with GIS exports for terrain overlays, or sequence animations for diurnal cycles in passive house audits, per Passivhaus standards. The organic twist boosts memorability, turning data dumps into dialogues with nature.
Growth tips: Calibrate vein densities to data density - sparse for overviews, dense for deep dives - and infuse scents of storytelling with embedded audio for field narrations. For academics, it's a lecture leaf-spring, animating evolutionary design principles.
Let Your Data Take Root - Harvest This Template Now
Nurture your presentations with nature's blueprint. Download the Innovative Folium Objects Keynote Charts Pack and watch your ideas flourish into unforgettable forests of insight. Branch out boldly.
Frequently Asked Questions
Can folium elements handle quantitative data?
Precisely - proportional sizing and color gradients encode metrics like flow rates or biomass.
Is it compatible with sustainability reporting tools?
Yes, links to BREEAM calculators and exports to Sefaira for integrated workflows.
How do I add custom organic shapes?
Via Keynote's shape builder, blending seamlessly with pre-made foliums.
Are animations eco-themed?
Growth bursts and wilting fades, evoking seasonal shifts for temporal data.
What's the vector quality for prints?
Lossless SVGs, printing sharp at billboard scales for exhibit panels.
Good for
- Project roadmaps and sprint plans
- Product launch timelines
- Quarterly or annual review decks
- Company history and milestone summaries
Licence
reviews
I grabbed this for a business metrics deck and it worked okay.
The layout spacing was cleaner than my own slides usually are.
A few color combinations were too bright for me.
Charts stayed readable after exporting to PDF.
Useful template for quick office presentations.
FAQ
Will it work in Google Slides?
Are fonts embedded?
Can I use this for client work?
What's the refund policy?
Do you update the template after purchase?
Similar templates
See all Keynote Charts →

All 18 slides