 Click to zoom
Student GPA Dynamics PowerPoint Template and Charts
| Format | .pptx |
| Slides | 30 unique layouts |
| Aspect ratio | 130/73 |
| Compatibility | PowerPoint |
| Animated | No |
| Language | English |
| License | Commercial |
| File size | — |
| Version | v1.0 |
| Last updated | June 2026 |
What's inside
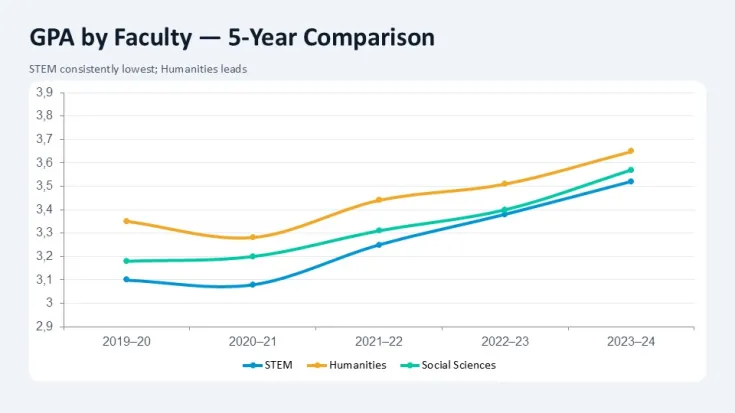
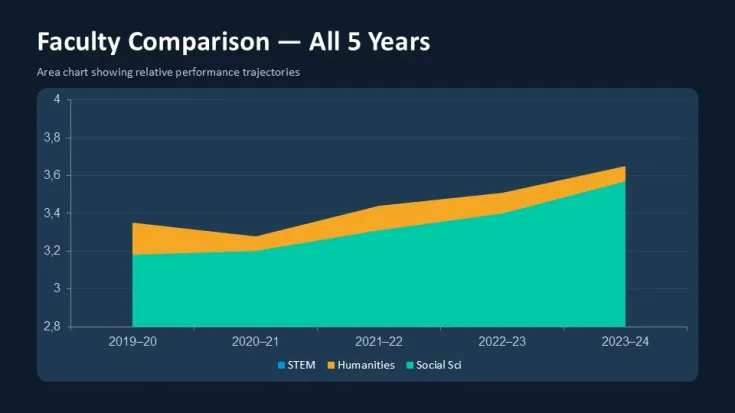
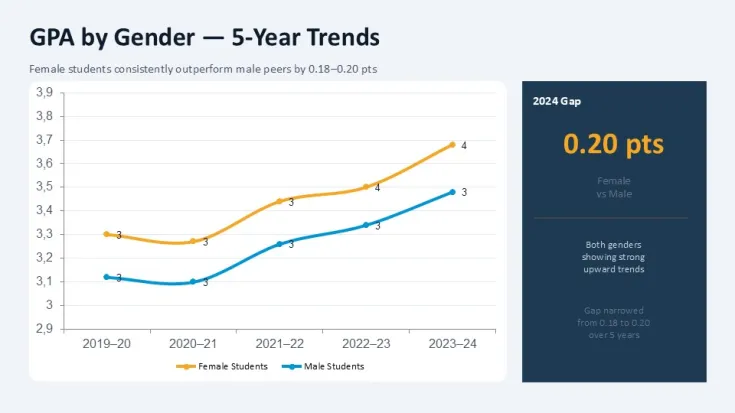
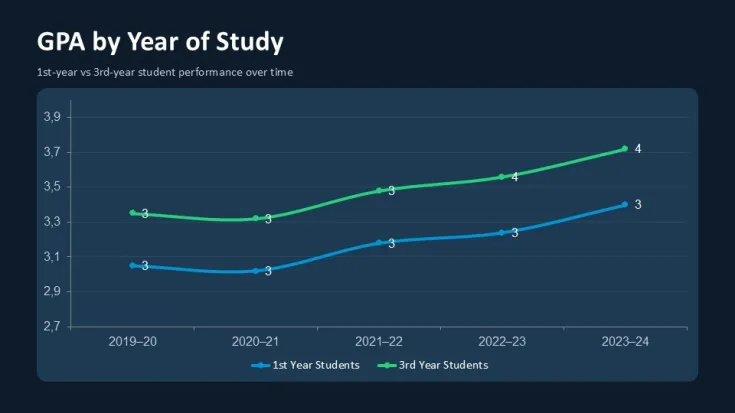
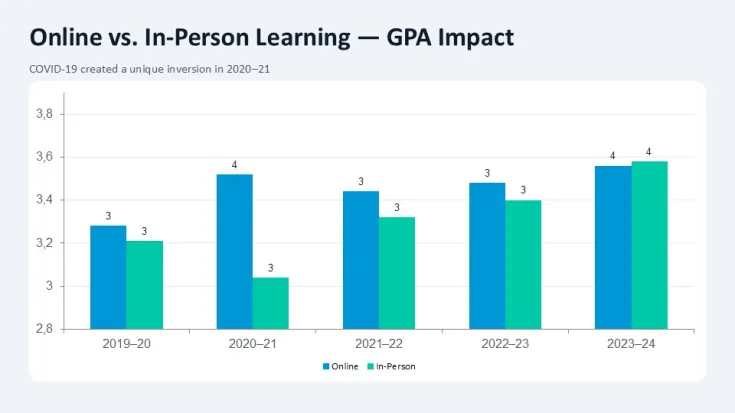
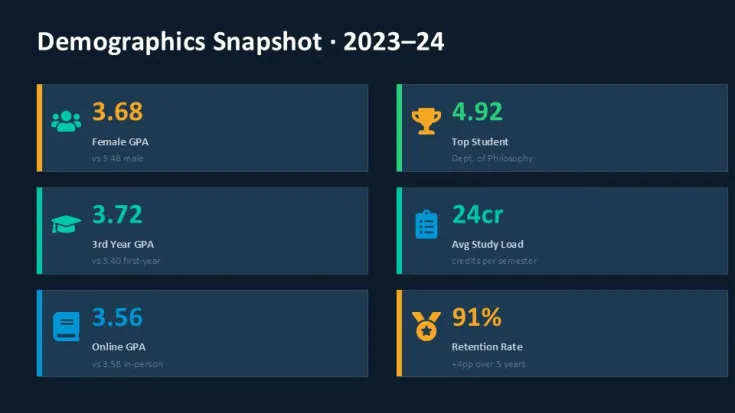
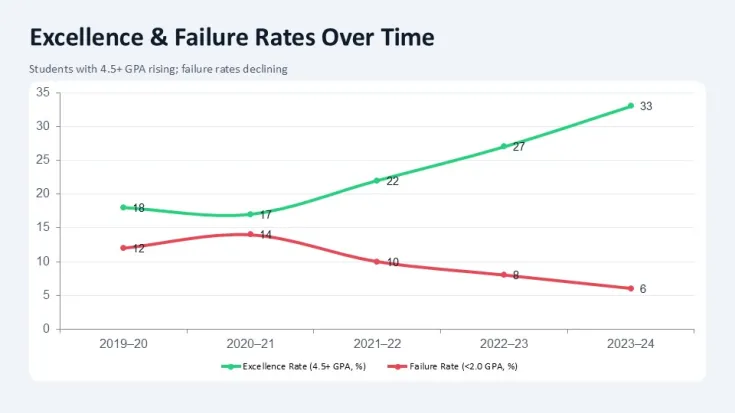
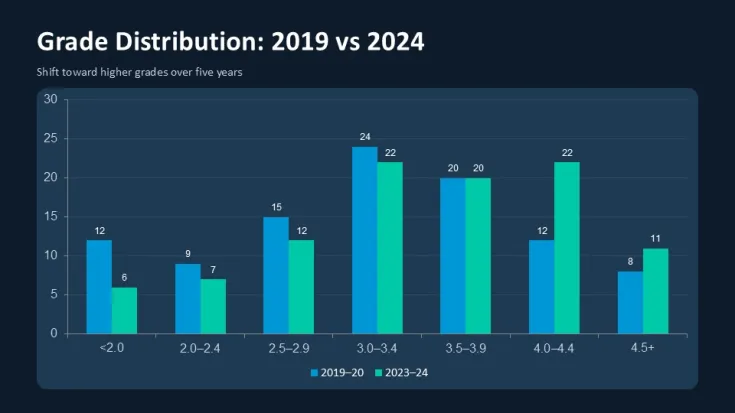
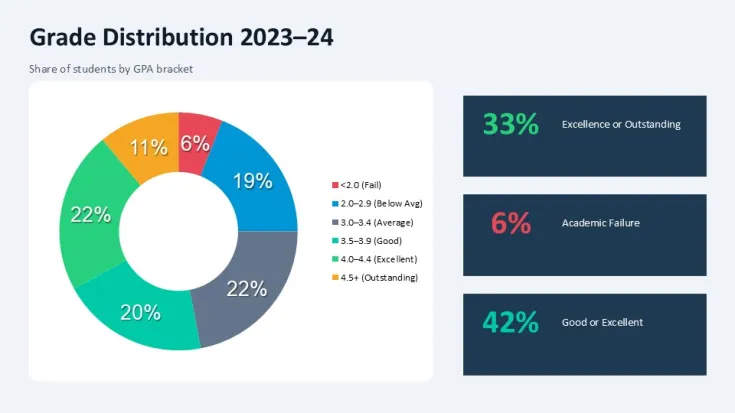
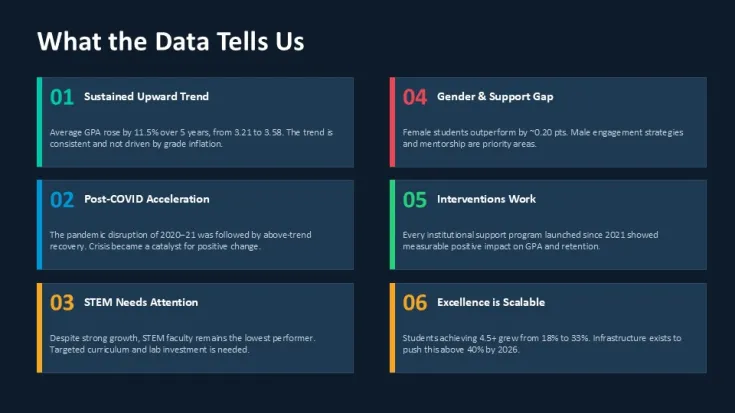
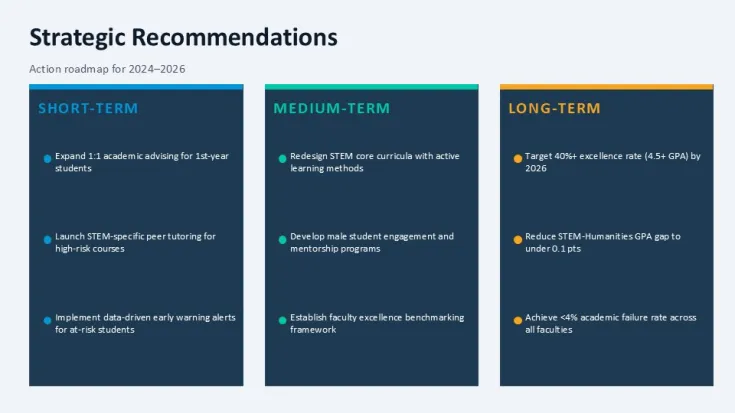
A 30-slide PowerPoint chart template built around student GPA data. Designed for academic advisors, registrars, and faculty presenting cohort performance or individual progress trends. The structure solves a common problem: displaying grade distributions and semester-over-semester changes without rebuilding charts from scratch each time.
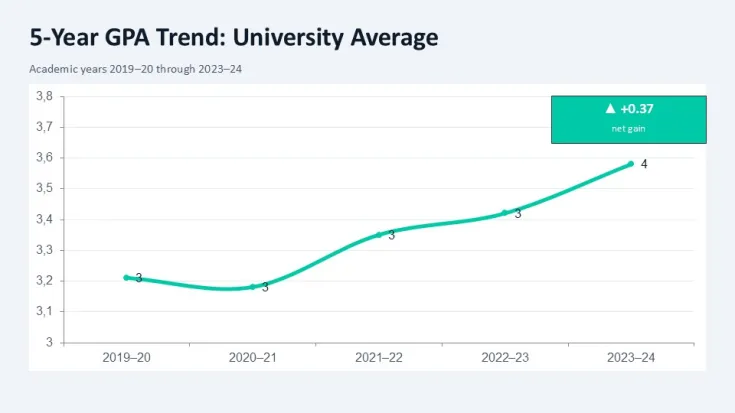
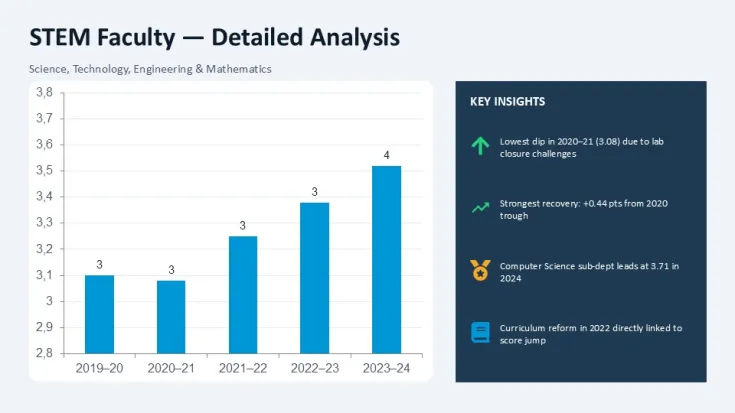
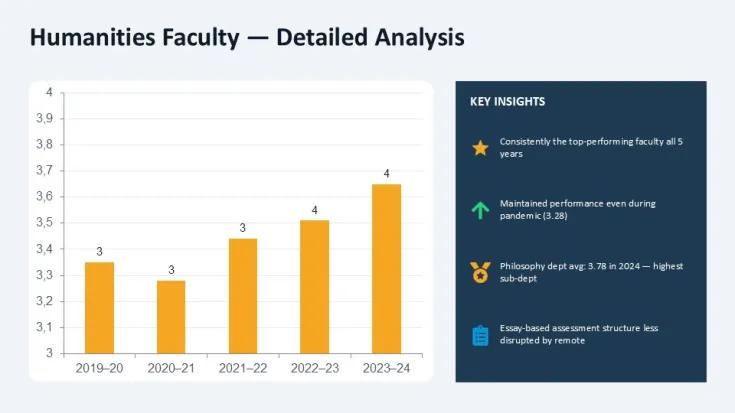
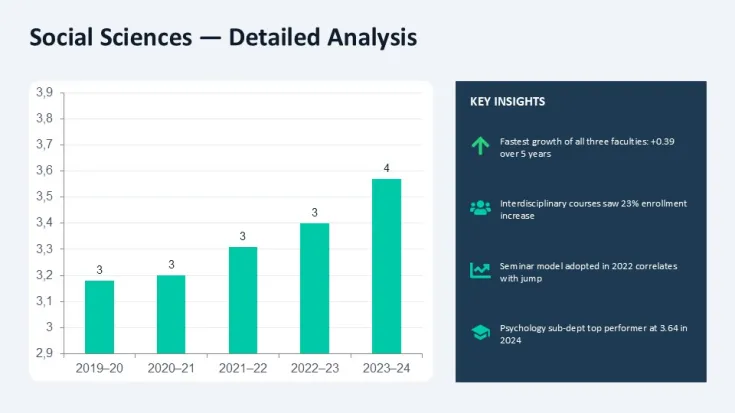
Resizing any chart triggers proportional scaling across data labels and axis text. Color updates applied through Slide Master affect all chart elements simultaneously. Duplicating a slide copies both the layout and the linked chart formatting, so you can build multi-semester comparisons without realigning elements. Data labels remain editable; when you replace sample numbers, the bar and line series adjust automatically.
- Each chart uses grouped vector shapes, so repositioning one element does not break the layout
- Slide Master controls background and accent colors across all 30 pages
- Text placeholders accept overflow text without distorting chart proportions
- Compatible with PowerPoint 2016 and newer (Windows/Mac)
Good for
- Project roadmaps and sprint plans
- Product launch timelines
- Quarterly or annual review decks
- Company history and milestone summaries
Licence
reviews
No reviews yet. Be the first!
FAQ
Will it work in Google Slides?
Are fonts embedded?
Can I use this for client work?
What's the refund policy?
Do you update the template after purchase?
Similar templates
See all PowerPoint Charts →


All 30 slides