 Click to zoom
South Dakota Keynote Maps: Editable Slides for Impactful Presentations
| Format | .pptx |
| Slides | 28 unique layouts |
| Aspect ratio | 16:9 |
| Compatibility | PowerPoint |
| Animated | No |
| Language | English |
| License | Commercial |
| File size | — |
| Version | v1.0 |
| Last updated | May 2022 |
What's inside
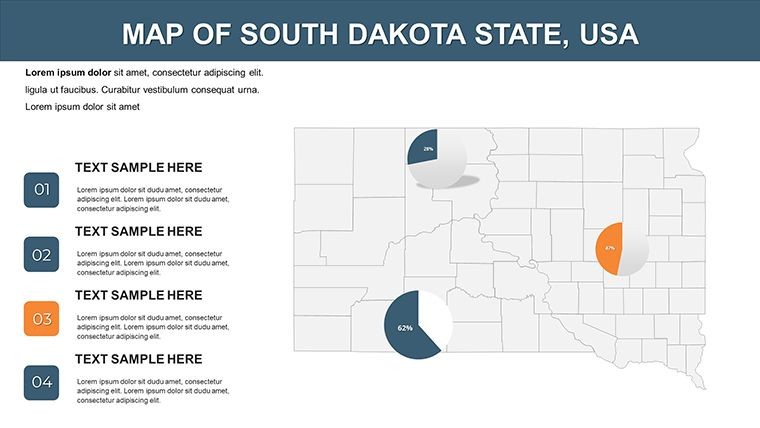
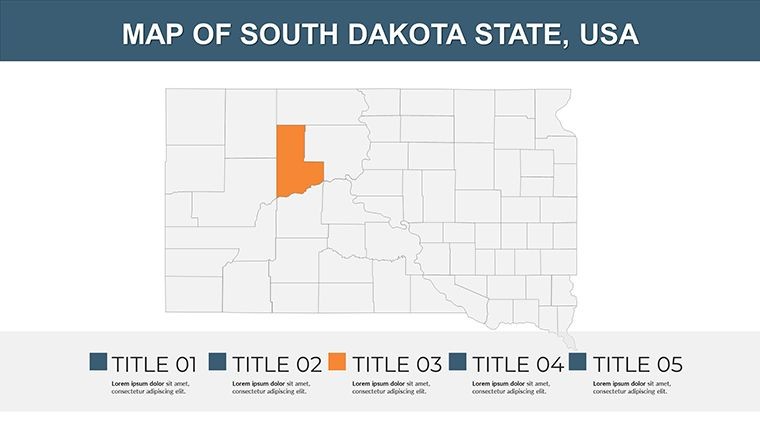
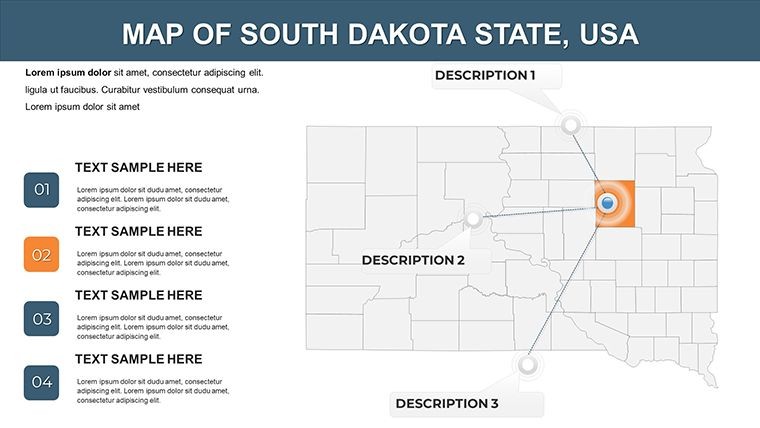
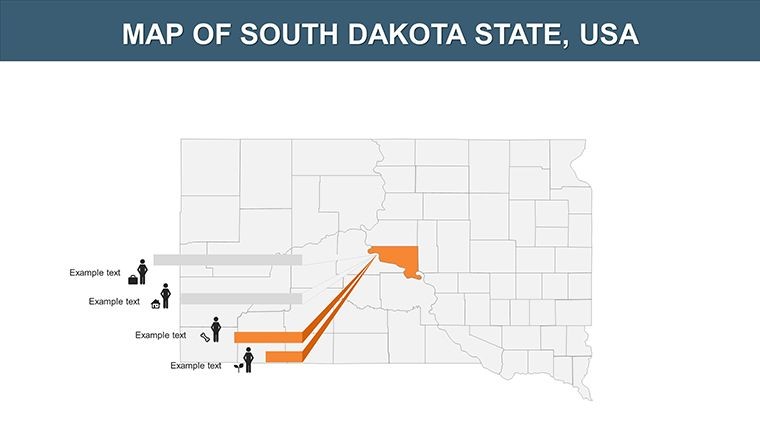
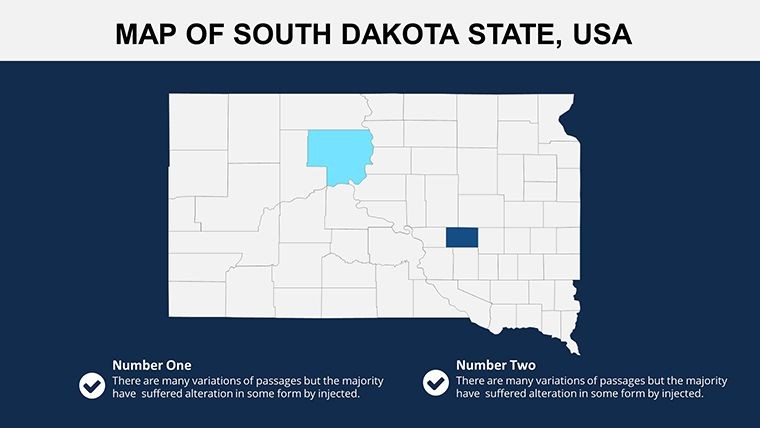
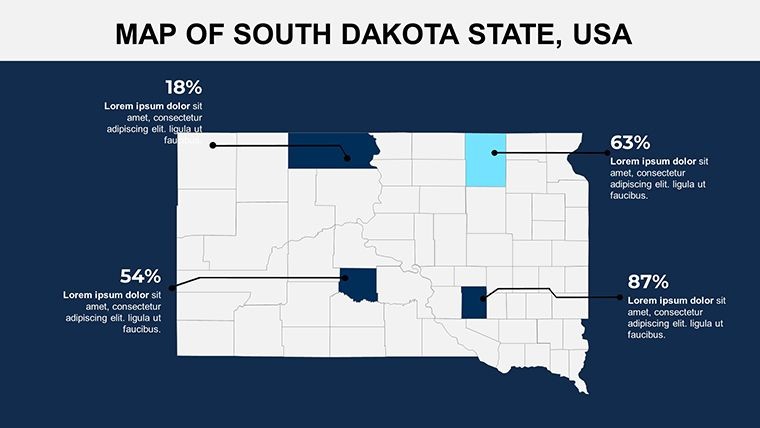
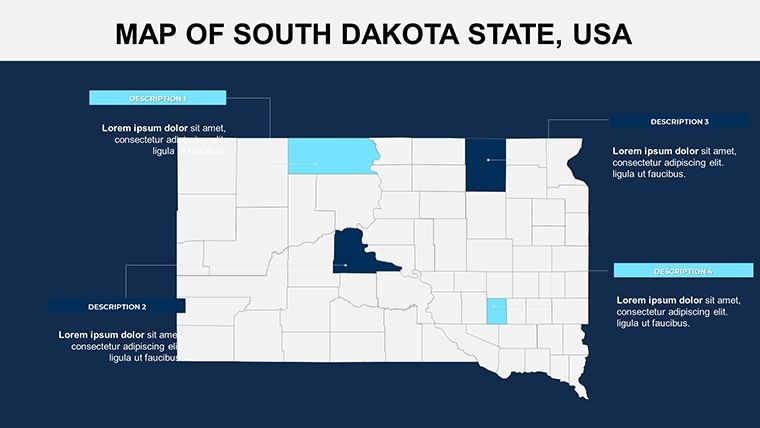
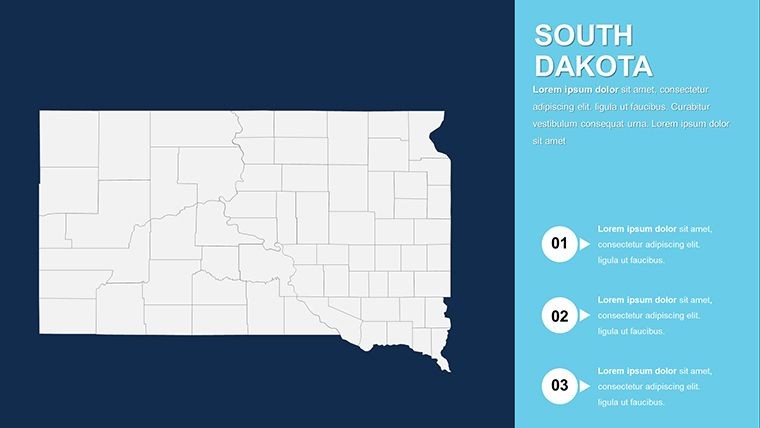
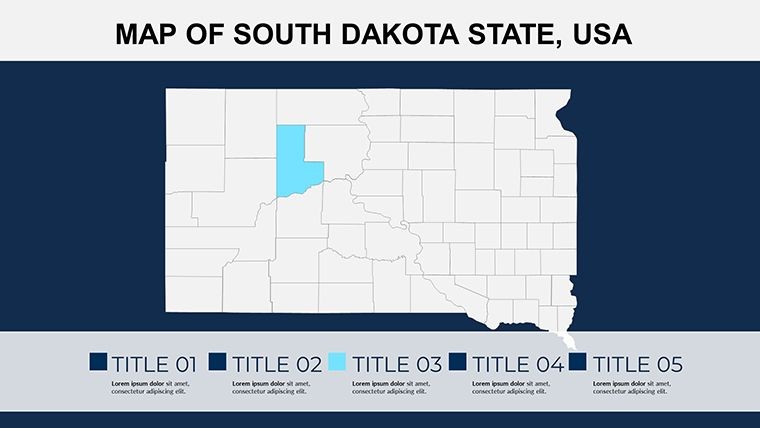
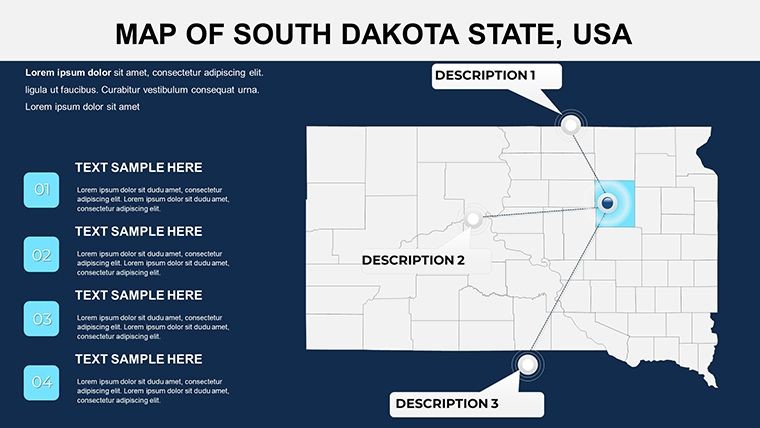
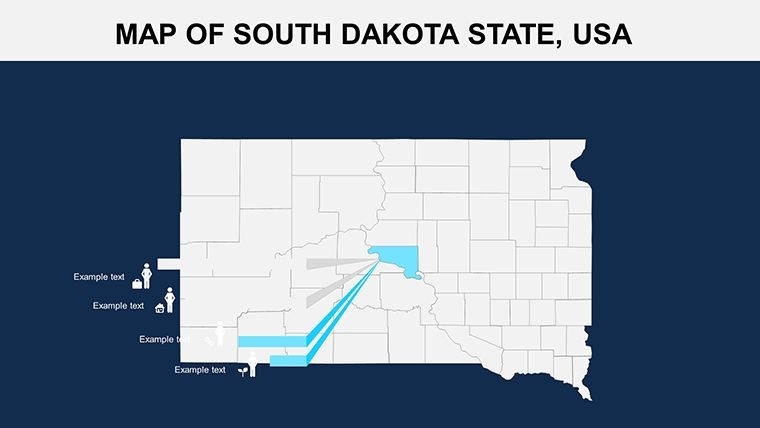
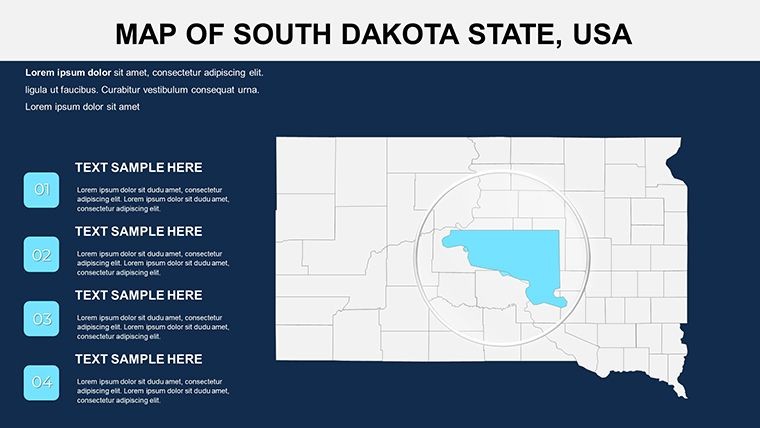
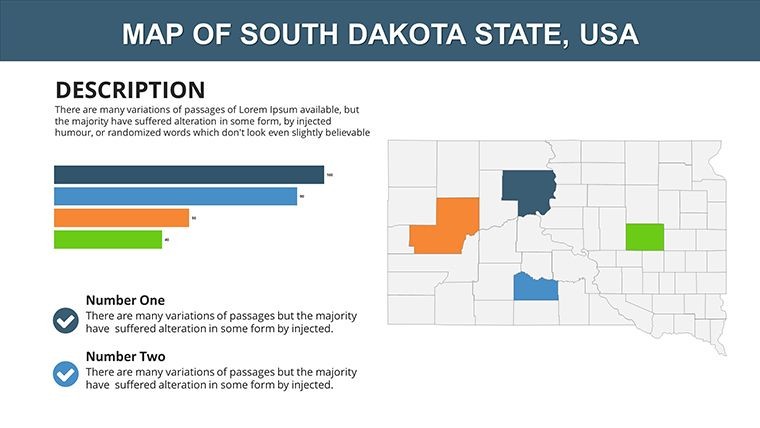
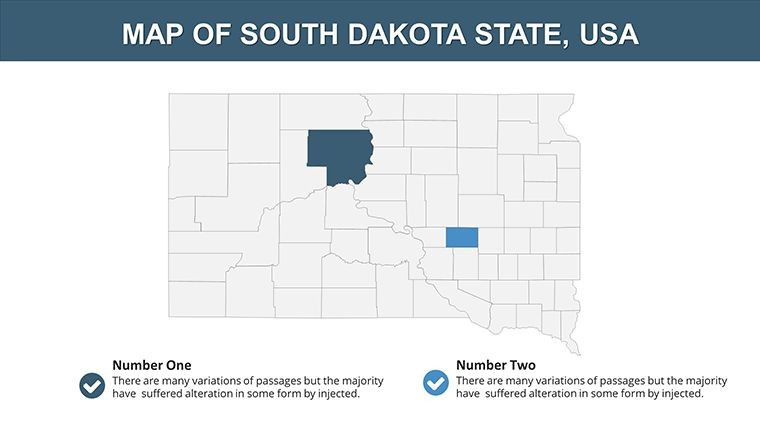
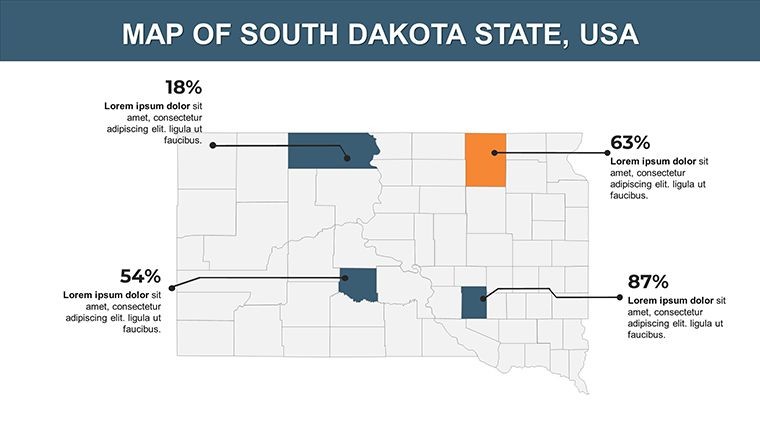
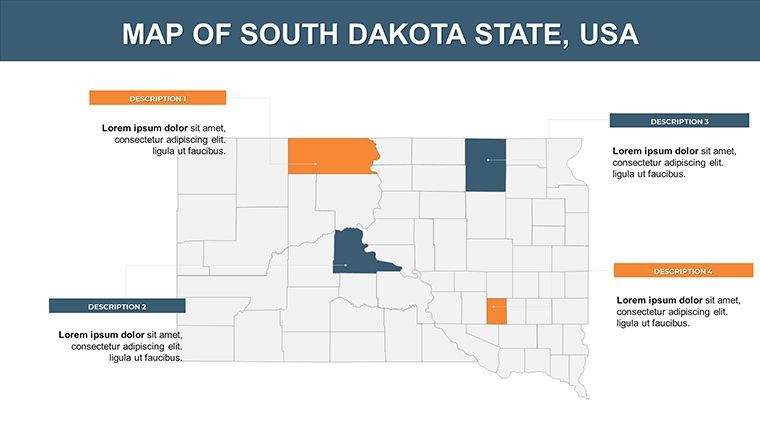
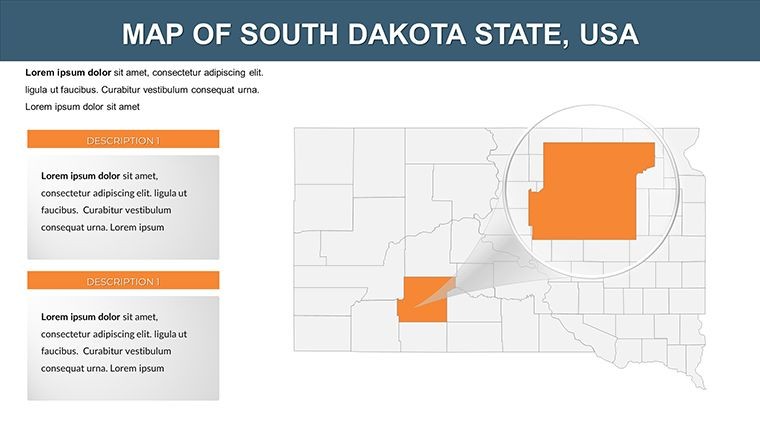
In the vast landscape of professional presentations, where clarity meets creativity, the South Dakota Keynote maps template stands out as a versatile tool for communicators across industries. Whether you're a political analyst breaking down election trends, an economist illustrating regional growth patterns, or an educator mapping historical events, this template transforms complex data into compelling visuals. With 28 fully editable slides designed specifically for Apple's Keynote software, you gain access to high-resolution maps of South Dakota that highlight its unique geography - from the rolling Black Hills to the expansive Missouri River valley. This isn't just a set of static images; it's a dynamic resource that adapts to your narrative, ensuring your audience stays engaged and informed.
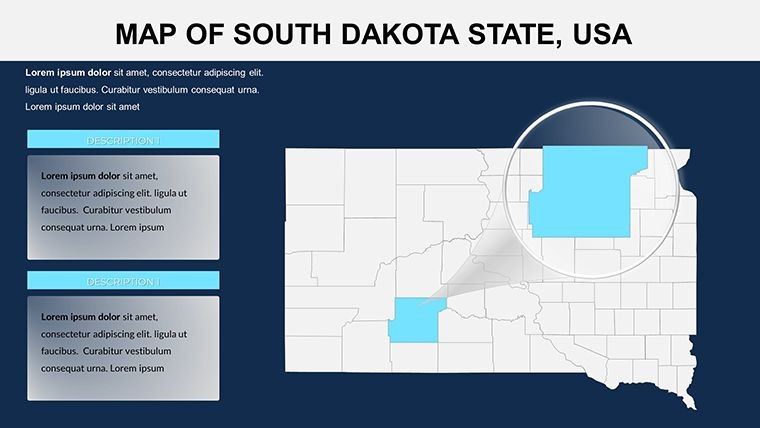
Imagine preparing for a state senate briefing where you need to showcase voter demographics across counties like Pennington or Minnehaha. Traditional tools might leave you fumbling with mismatched graphics, but this template offers seamless integration. Each slide is crafted with precision, incorporating layered elements that allow for easy customization. Change colors to match your brand palette, add labels for key landmarks such as Mount Rushmore or Badlands National Park, and incorporate data overlays without starting from scratch. Compatible with the latest Keynote versions, the .key file format ensures smooth performance on Mac, iPad, or even iCloud, making it ideal for remote teams or on-the-go edits.
Key Features That Set This Template Apart
Diving deeper into what makes this South Dakota maps template a must-have, let's explore its core features. First and foremost, the editability is unparalleled - every map outline, from state borders to internal divisions, can be resized, recolored, or animated with Keynote's built-in tools. This flexibility is crucial for professionals adhering to standards like those from the American Planning Association (APA), where accurate representation of spatial data is key to credible presentations.
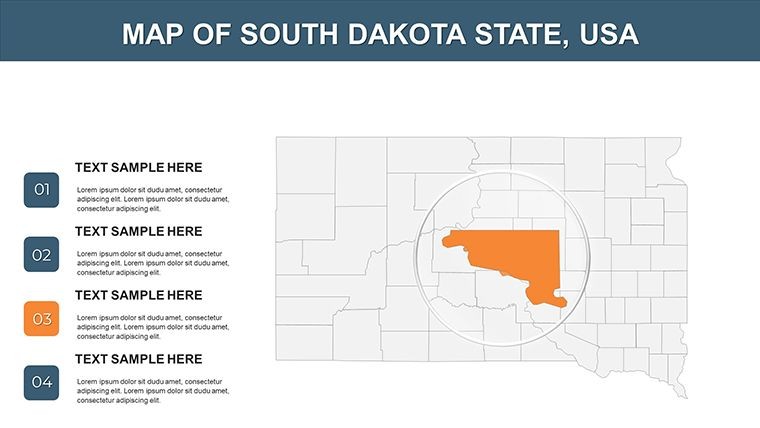
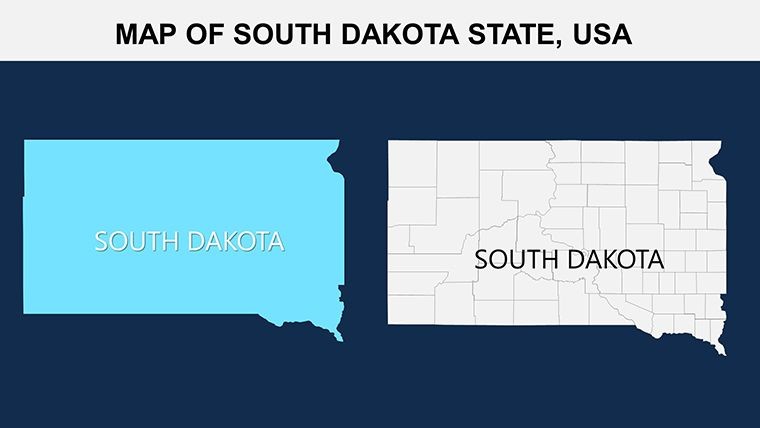
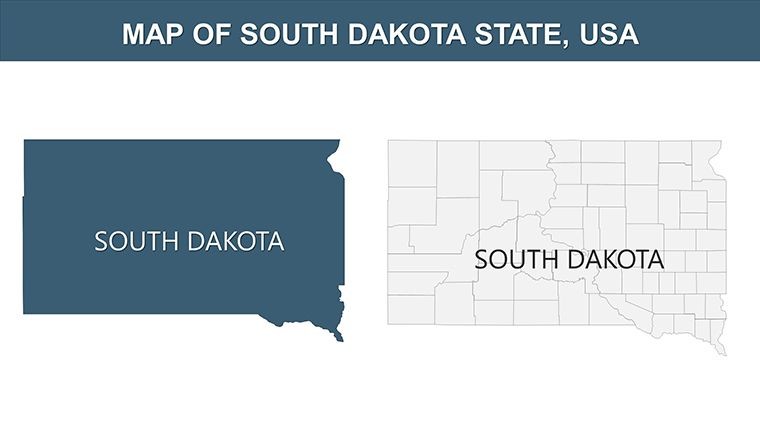
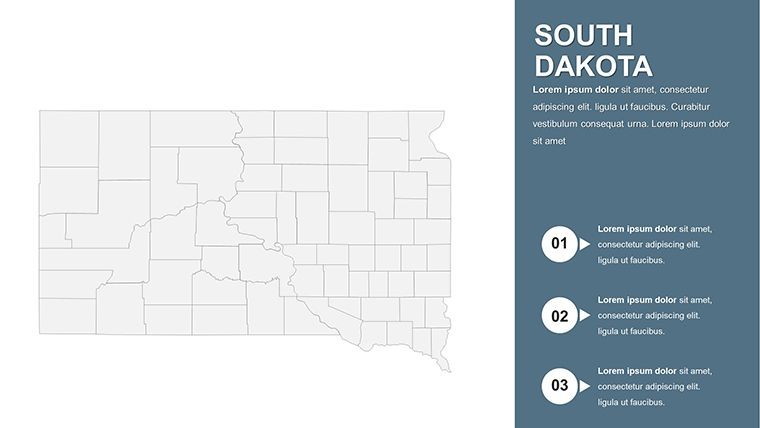
- High-Resolution Maps: Detailed outlines of South Dakota's 66 counties, ensuring sharpness even when projected on large screens.
- Customizable Color Schemes: Pre-set palettes inspired by the state's natural hues - think earthy browns for prairies and deep greens for forests - but fully adjustable to fit corporate branding.
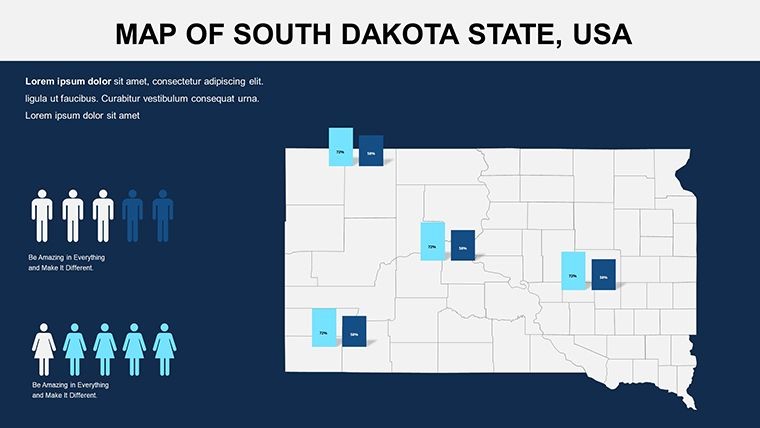
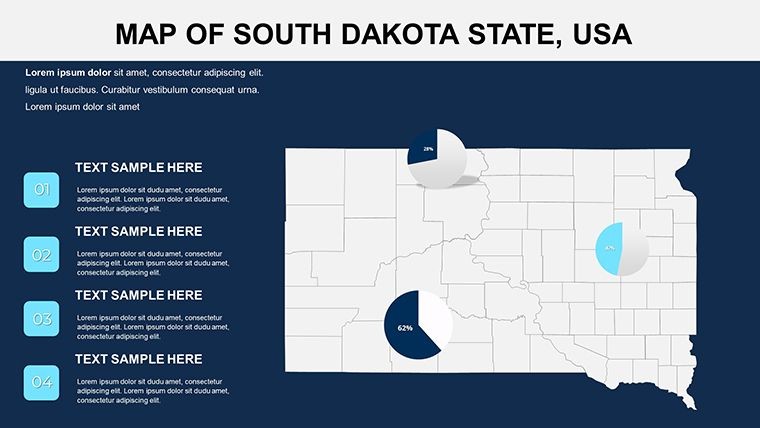
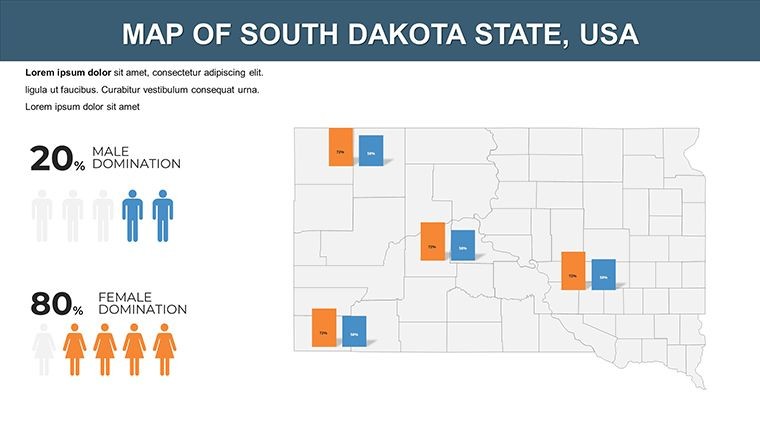
- Integrated Icons and Diagrams: Auxiliary elements like economic indicators (e.g., pie charts for agriculture vs. tourism revenue) and political symbols (e.g., voting icons) that snap into place effortlessly.
- Animation-Ready Layers: Build suspense in your story by animating map reveals, such as zooming into Sioux Falls for urban development discussions.
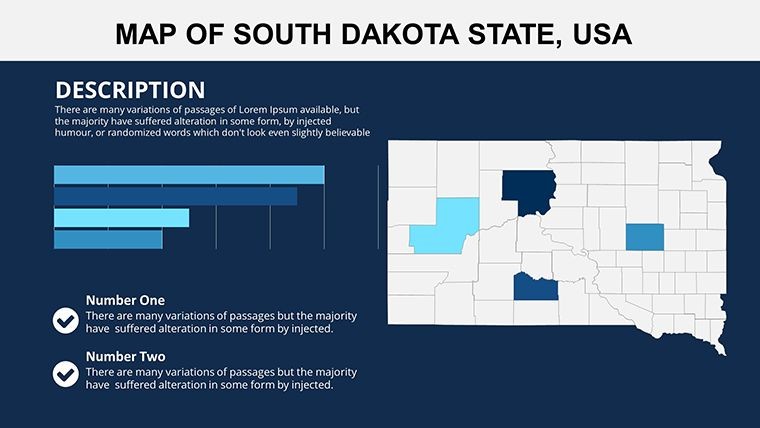
- Data Integration Tools: Placeholder spots for embedding charts from Excel or Numbers, perfect for real-time updates on metrics like GDP growth or population shifts.
These features aren't just bells and whistles; they're grounded in real-world utility. For instance, in a case study from a Rapid City consulting firm, presenters used similar customizable maps to win a contract for regional infrastructure planning, crediting the template's clarity for swaying stakeholders.
Real-World Applications: From Boardrooms to Classrooms
The beauty of this template lies in its broad applicability. Let's walk through some targeted use cases to show how it solves common presentation pain points.
Political Campaigns and Analysis
Step 1: Select a base map slide showing South Dakota's electoral districts. Step 2: Overlay voter turnout data using color gradients - red for high engagement areas like Brookings County. Step 3: Add annotations for key issues, such as energy policies in oil-rich regions. Step 4: Animate transitions to reveal predictive models. This approach not only informs but inspires action, much like how campaigns leverage visuals to mobilize supporters.
Economic Forecasting and Business Pitches
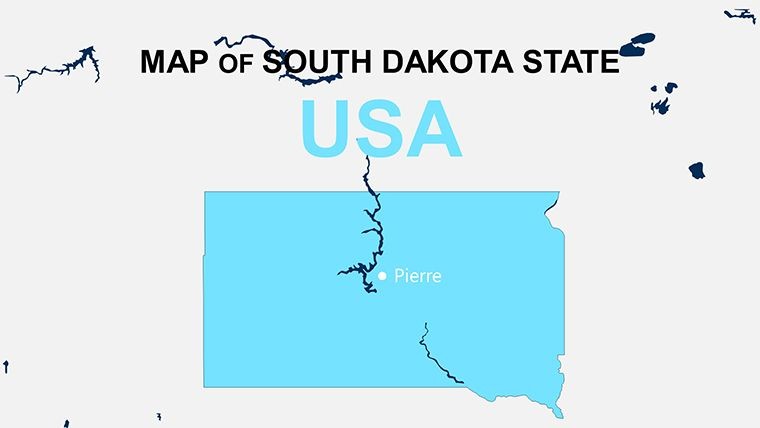
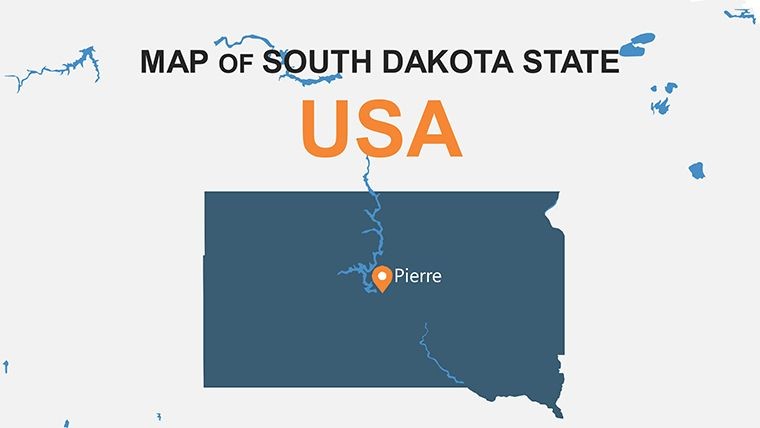
For economists or entrepreneurs, start with a economic heatmap slide. Customize to highlight sectors: agriculture in the east, mining in the west. Integrate bar graphs showing job growth in Pierre, the capital. Compared to basic Keynote shapes, this template saves hours, allowing focus on insights rather than design. A marketing analyst might use it to pitch expansion strategies, demonstrating market potential with pinpoint accuracy.
Educational Workshops and Historical Overviews
Educators can transform lessons on Native American history by mapping tribal lands like the Pine Ridge Reservation. Add timelines via integrated diagrams, animating historical events from Lewis and Clark's expedition to modern conservation efforts. This interactive style boosts retention, as studies from the National Council for Geographic Education suggest visual aids increase student engagement by up to 40%.
Beyond these, consider environmental scientists tracking wildlife corridors or tourism boards promoting attractions. The template's versatility ensures it fits niche needs, always prioritizing user-friendly edits to avoid technical hurdles.
Why Choose This Over Standard Options?
Basic Keynote maps often fall short in detail and customization, leading to generic slides that fail to impress. This template elevates your work with professional-grade assets, drawing from design best practices akin to those in award-winning presentations at conferences like the ESRI User Conference for GIS mapping. It's not about reinventing the wheel; it's about refining it for smoother rides in high-stakes scenarios.
To integrate into your workflow: Download the .key file, open in Keynote, and start personalizing. Tips include using master slides for consistent branding and exporting to PDF for sharing. With subtle CTAs embedded - like "Explore South Dakota's potential today" - your presentations become calls to discovery.
In wrapping up, this South Dakota Keynote maps template isn't merely a download; it's an investment in clearer communication. Whether dissecting data or weaving narratives, it empowers you to present with confidence. Ready to map out success? Secure your copy and transform your next session into a memorable journey.
Frequently Asked Questions
How editable are the maps in this template?
Every element is fully customizable - adjust borders, colors, labels, and add animations directly in Keynote for tailored presentations.
Is this compatible with older Keynote versions?
Yes, it works seamlessly with Keynote 6 and later, ensuring broad accessibility without compatibility issues.
Can I use these maps for commercial purposes?
Absolutely, the template is licensed for professional use, including client pitches and business reports.
What file formats are included?
The primary format is .key, optimized for Keynote, with options to export to other formats like PDF or PowerPoint.
Are there any tutorials for customization?
While not included, Keynote's intuitive interface makes edits straightforward; online resources from Apple provide additional guidance.
How do I incorporate data into the maps?
Use placeholders to embed charts or text; link to external data sources for dynamic updates in your slides.
Good for
- Project roadmaps and sprint plans
- Product launch timelines
- Quarterly or annual review decks
- Company history and milestone summaries
Licence
reviews
Made a short sales presentation with this one yesterday.
The map graphics were easier to edit than I expected.
A few slides looked repetitive but I still used most of them.
Good enough for internal meetings where nobody cares about design too much.
I changed the colors and it looked better after that.
FAQ
Will it work in Google Slides?
Are fonts embedded?
Can I use this for client work?
What's the refund policy?
Do you update the template after purchase?
Similar templates
See all Keynote Maps →
All 28 slides