 Click to zoom
Social Connections and Happiness PowerPoint Charts Template
| Format | .pptx |
| Slides | 26 unique layouts |
| Aspect ratio | 16:9 |
| Compatibility | PowerPoint |
| Animated | No |
| Language | English |
| License | Commercial |
| File size | — |
| Version | v1.0 |
| Last updated | August 2023 |
What's inside
Human connections are the heartbeat of happiness, and in today's interconnected world, visualizing their impact can spark profound understanding. Our Social Connections and Happiness PowerPoint Charts Template brings this to life with 26 editable slides, crafted for those who study, teach, or advocate for stronger relationships. From researchers delving into well-being metrics to educators explaining social dynamics, this template helps you map out networks, happiness indices, and relational patterns in ways that resonate deeply.
Imagine presenting at a conference where your charts not only display data but tell stories - of how friendships boost mental health or community ties enhance productivity. Grounded in insights from positive psychology pioneers like Martin Seligman, this tool incorporates evidence-based visuals that align with PERMA models, showing how relationships contribute to flourishing. Users often find their audiences more engaged, with feedback indicating heightened empathy and action post-presentation.
Essential Features for Relational Storytelling
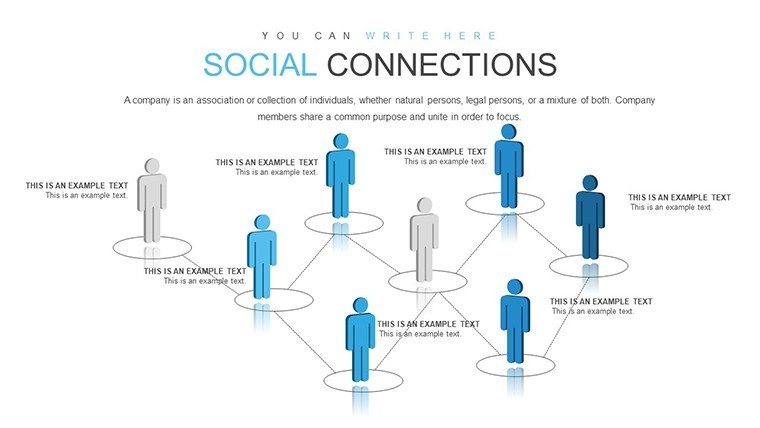
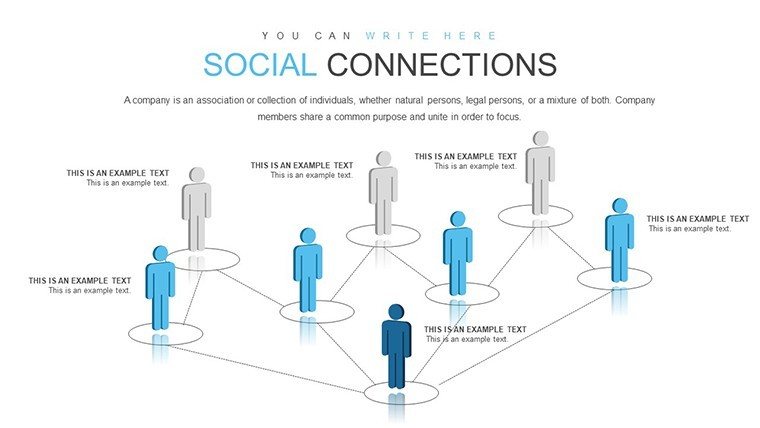
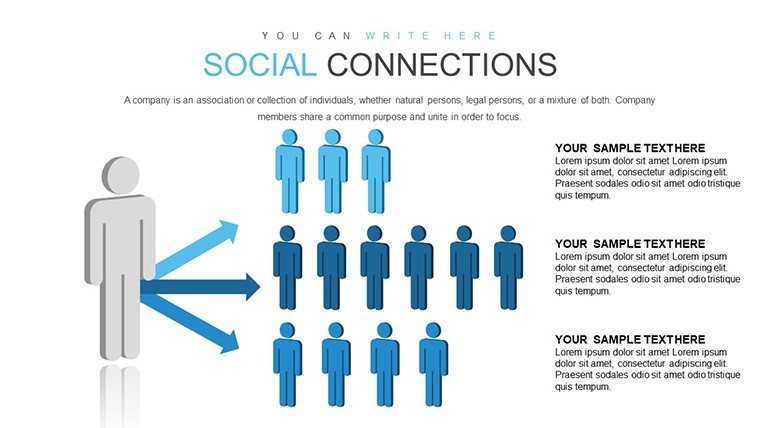
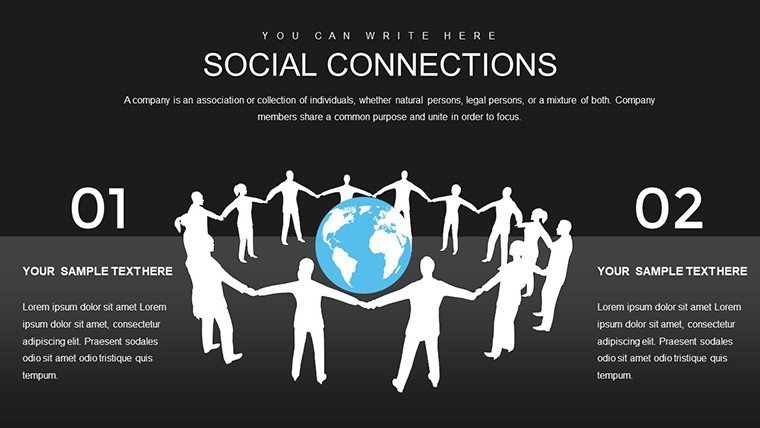
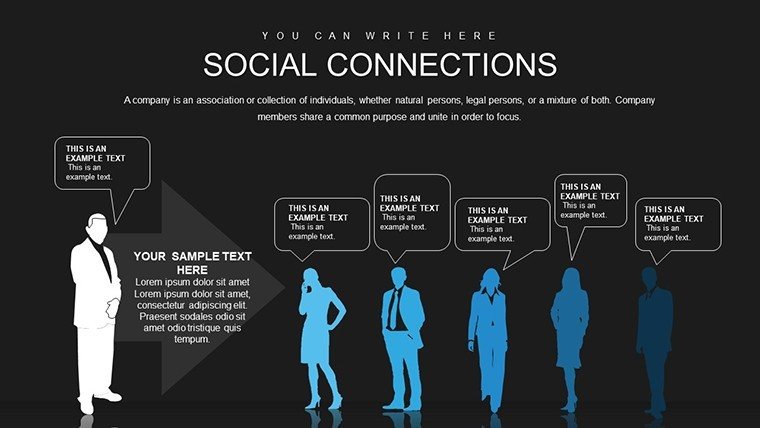
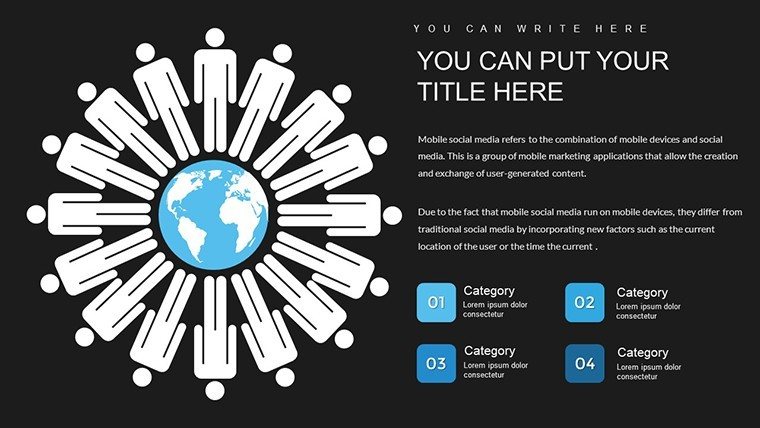
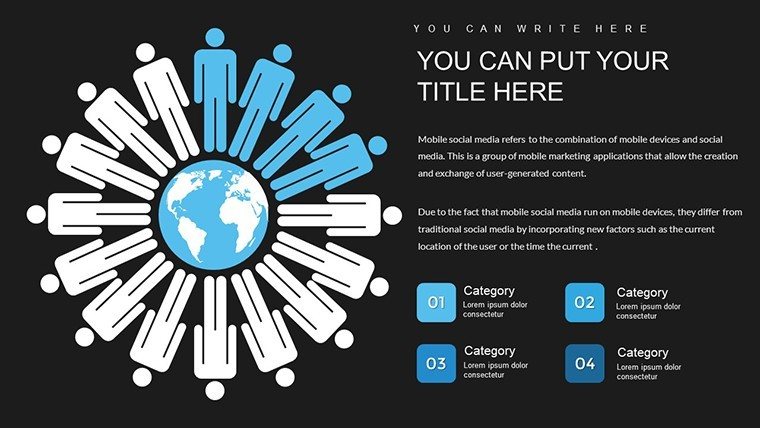
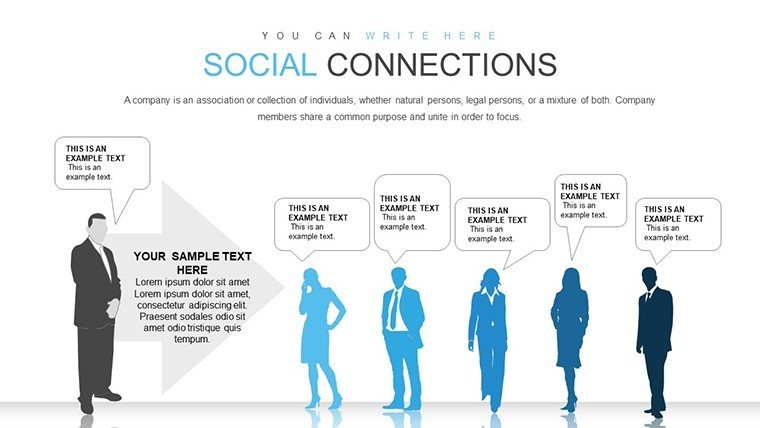
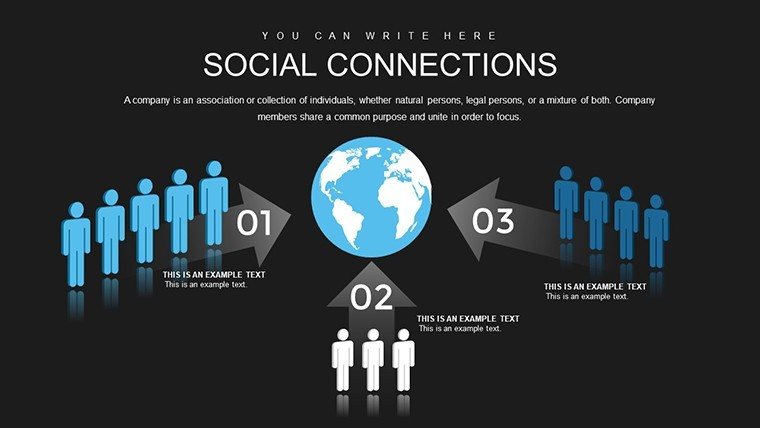
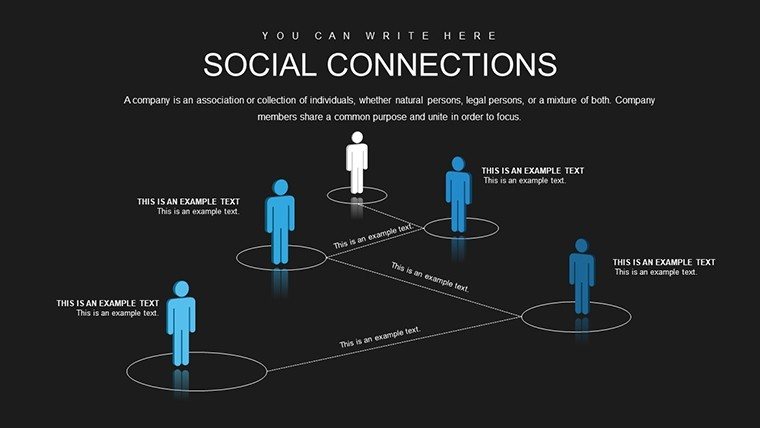
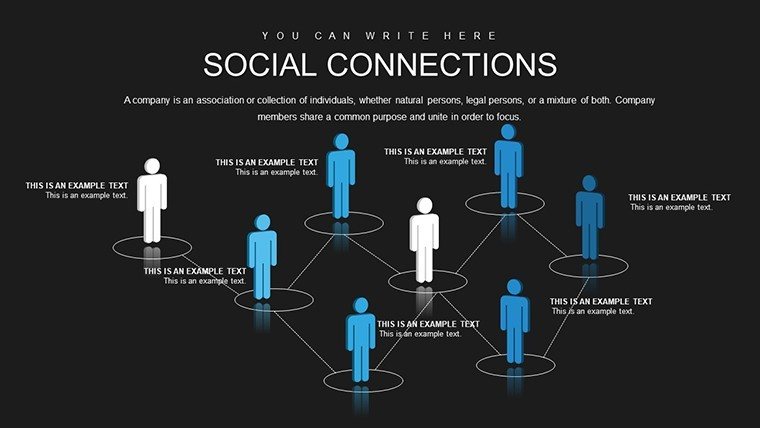
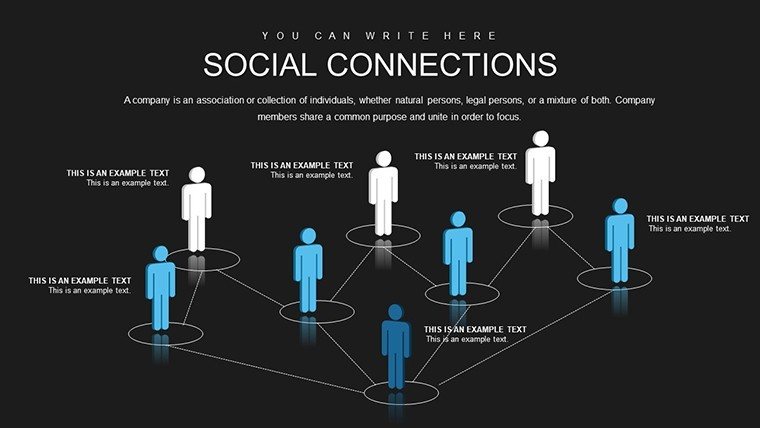
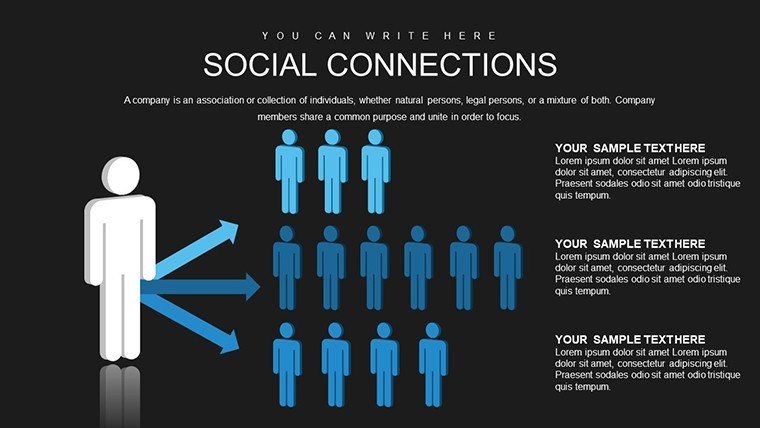
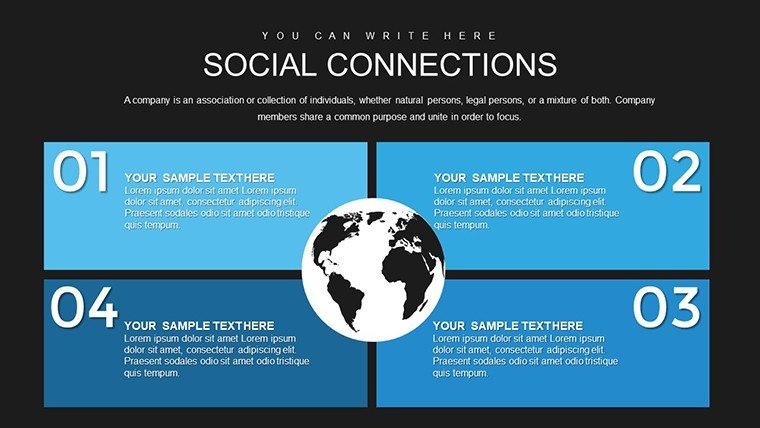
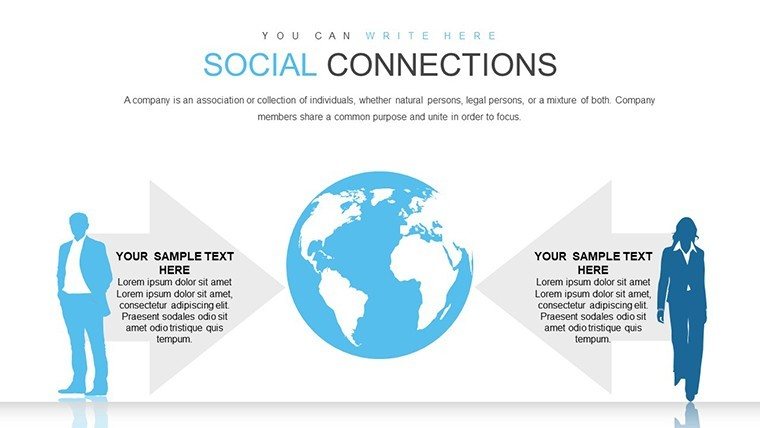
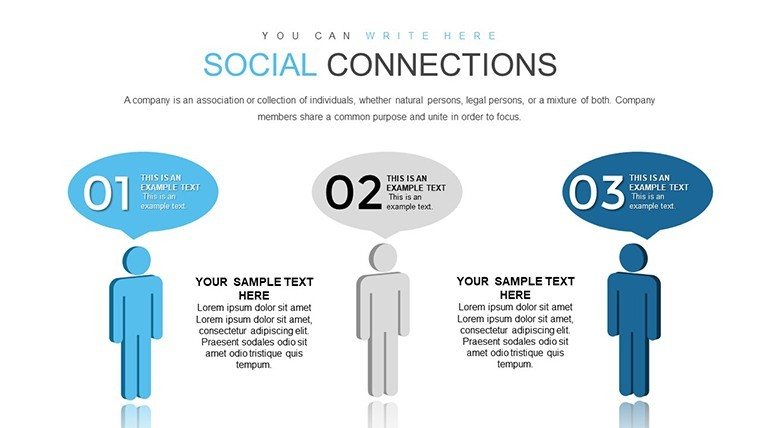
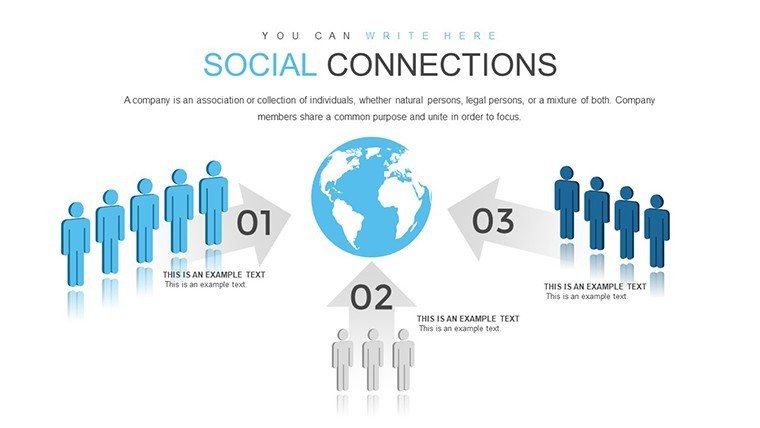
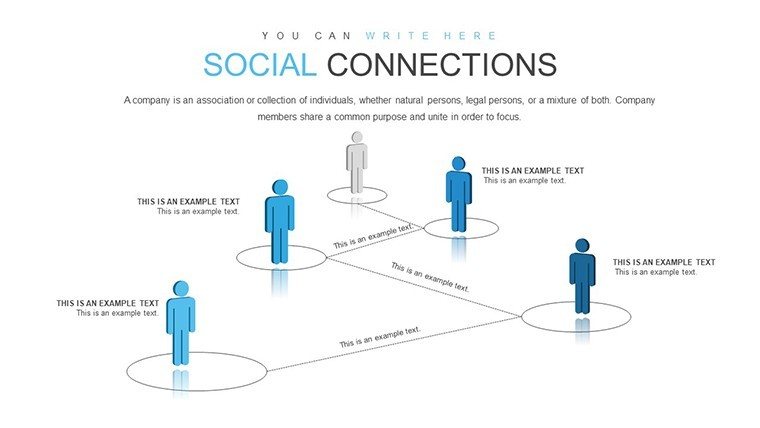
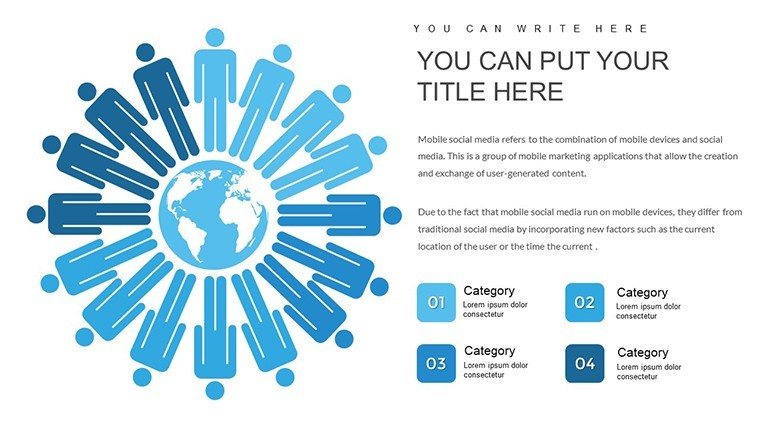
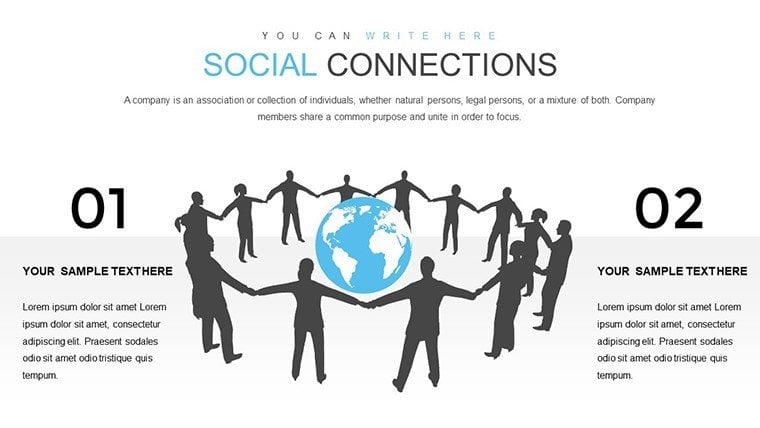
At its core, this template excels in illustrating connections through silhouettes, people icons, and relationship diagrams. Delivered in .pptx, it's fully compatible with PowerPoint, Google Slides, and Keynote, ensuring accessibility across platforms.
- Themed Visuals: Eye-catching graphs depicting network webs and happiness scales, using silhouettes for relatable human elements.
- Full Customization: Modify layouts, colors, and fonts to reflect your research theme or institutional branding.
- Illustration Variety: From bubble charts for influence spheres to line graphs tracking well-being over time.
- User-Friendly Design: Intuitive interfaces that let you focus on content, not tech hurdles.
In contrast to generic charts, these are tailored for social themes, incorporating subtle animations to reveal connections progressively, adding a layer of intrigue absent in basic tools.
Slide-by-Slide Insights
Early slides introduce core concepts with overview charts on social capital. Mid-sections (slides 8-15) feature detailed networks - think sociograms showing interaction frequencies or pie charts on happiness sources. Later slides include comparative analyses, like before-and-after relationship interventions.
For example, slide 12 could illustrate a happiness pyramid influenced by connections, with editable segments for custom data from surveys like the World Happiness Report.
Diverse Applications in Real Scenarios
This template thrives in varied contexts. A researcher might use it to present findings on loneliness epidemics, as in studies from the Journal of Happiness Studies, visualizing interventions that build community. Educators can break down group dynamics in classrooms, fostering student discussions on empathy.
- Research Presentation Flow: Start with data collection slides, analyze in network charts, conclude with implications.
- Educational Workshops: Use interactive elements to map personal networks, encouraging participant reflection.
- Executive Briefings: Highlight how team bonds drive innovation, backed by metrics.
For students, it's a boon for thesis defenses, integrating with tools like Qualtrics for data import.
Tips from Relationship Experts
To optimize, use warm color palettes for positive themes, per color psychology principles. Limit data points to avoid clutter, drawing from Edward Tufte's data-ink ratio for clean visuals. Naturally include terms like well-being network diagrams or relational happiness metrics to aid discovery while addressing user queries on fostering connections.
Build Stronger Bonds Through Visuals
Step into a world where data illuminates joy - secure this Social Connections and Happiness PowerPoint Charts Template and inspire change one slide at a time.
Frequently Asked Questions
How customizable are the relationship diagrams?
Completely - edit nodes, links, and labels to match your study's specifics.
Is it suitable for academic presentations?
Yes, with professional designs that impress peers and panels alike.
Does it include happiness metrics templates?
Absolutely, with scales and indices ready for your data.
Can I use it without design experience?
Definitely - intuitive tools make it easy for anyone.
What file formats are supported?
.pptx, compatible with major presentation software.
Good for
- Project roadmaps and sprint plans
- Product launch timelines
- Quarterly or annual review decks
- Company history and milestone summaries
Licence
reviews
Social Connections and Happiness 26 slides with network webs and silhouettes made my well-being presentation heartfelt. Warm colors and icons relatable for conference.
Researcher: PERMA model visuals evidence-based. Customizable great. Engaging.
Educator: sociograms sparked discussions. Practical for workshops.
The happiness scales with connections insightful. Slightly critical of slide count.
Deadline friendly. Professional for briefs.
Mixed but strong on relational storytelling.
FAQ
Will it work in Google Slides?
Are fonts embedded?
Can I use this for client work?
What's the refund policy?
Do you update the template after purchase?
Similar templates
See all PowerPoint Charts →


All 26 slides