 Click to zoom
Shutter Pie Charts PowerPoint Template: Master Data Distribution with Style
| Format | .pptx |
| Slides | 14 unique layouts |
| Aspect ratio | 16:9 |
| Compatibility | PowerPoint |
| Animated | No |
| Language | English |
| License | Commercial |
| File size | — |
| Version | v1.0 |
| Last updated | June 2024 |
What's inside
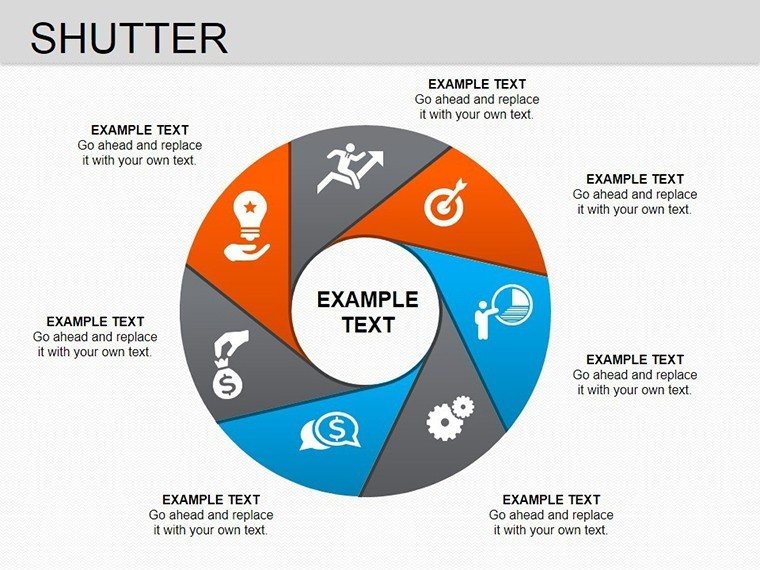
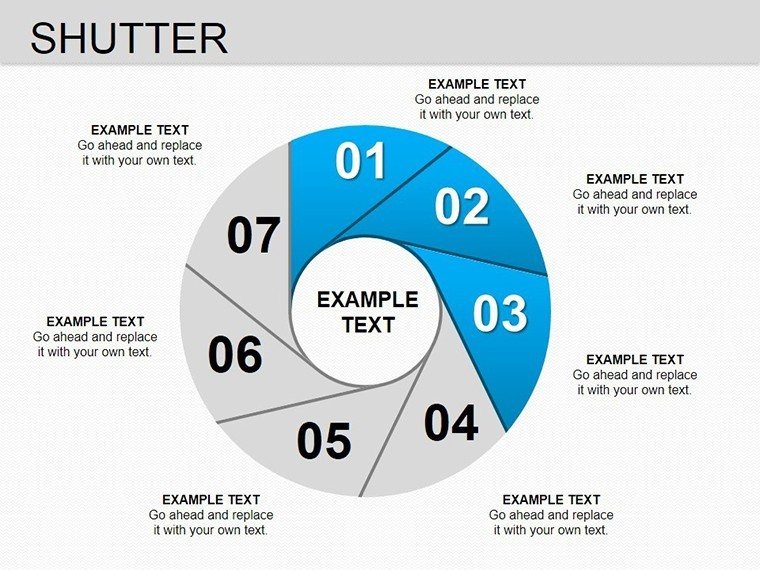
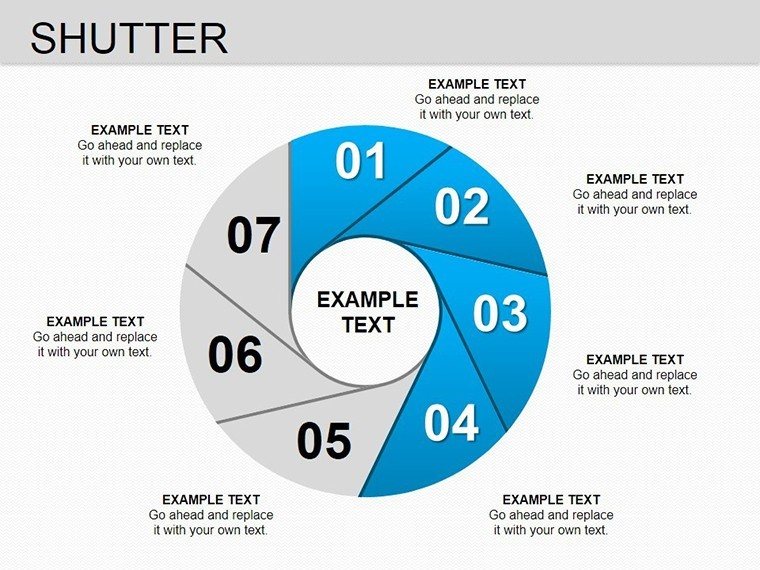
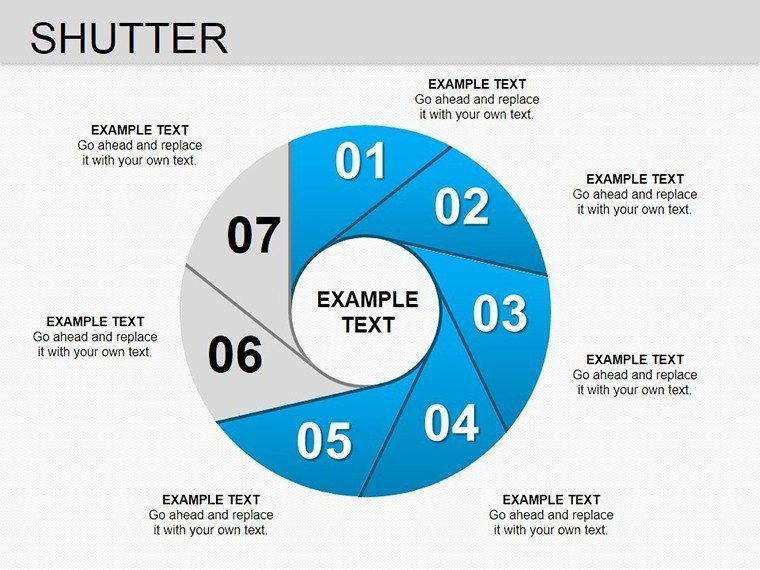
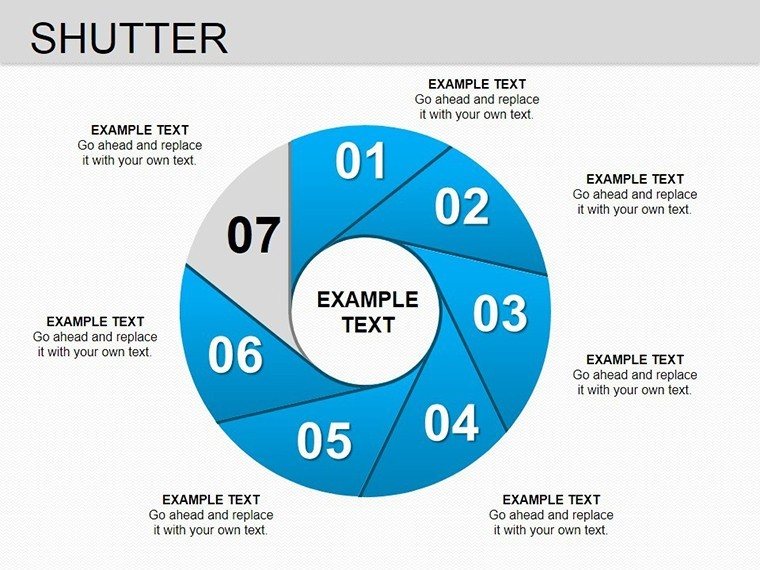
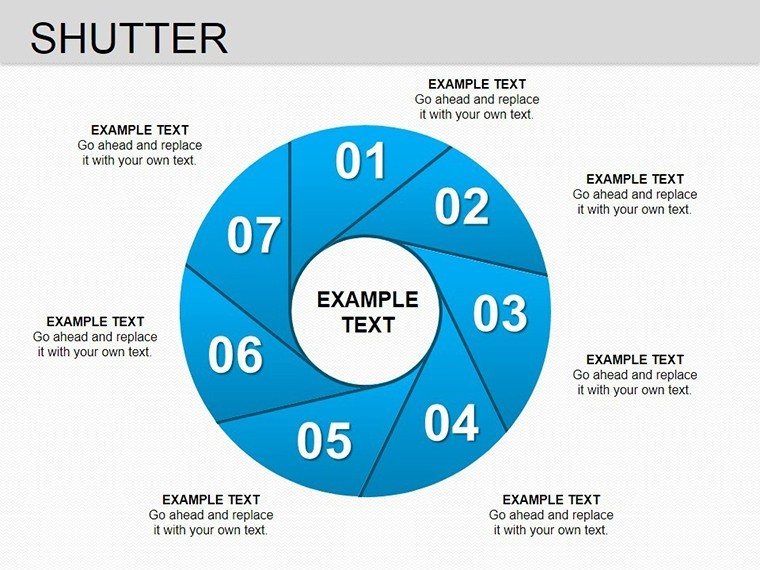
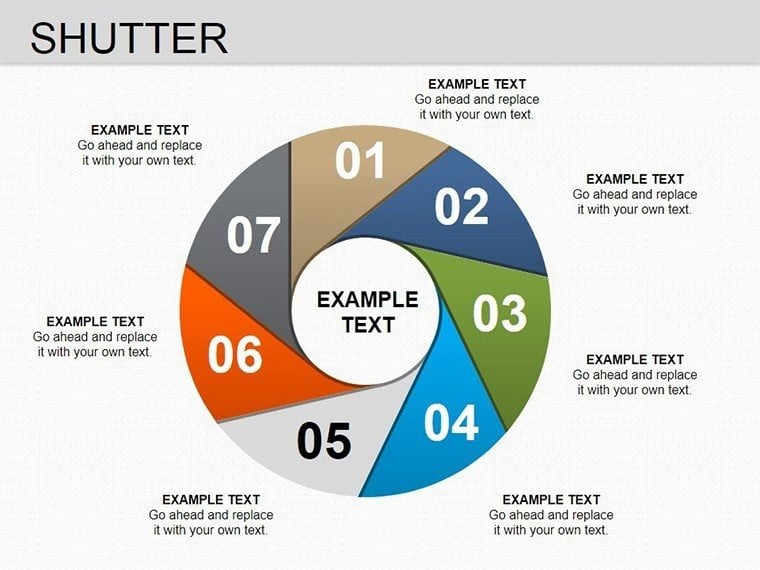
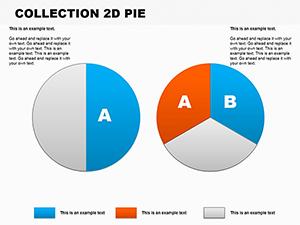
Picture this: You're in a high-stakes meeting, and instead of yawns, your audience leans in, mesmerized by pie charts that slice through complexity like a hot knife through butter. That's the power of our Shutter Pie Charts PowerPoint Template. Boasting 14 editable slides dedicated to pie and donut charts, this tool is tailored for those who deal with proportional data, from market share breakdowns to budget allocations. Marketers analyzing campaign ROI, executives reviewing quarterly performance, or teachers illustrating statistical concepts will find it indispensable.
Grounded in data visualization best practices from experts like Edward Tufte, this template minimizes chart junk while maximizing insight. Real-world users, such as a digital marketing agency, have used it to secure clients by presenting audience demographics in compelling, color-coded pies. The design's clean lines and shutter-inspired motifs add a unique flair, making your slides stand out without distracting from the message.
Standout Features for Professional Polish
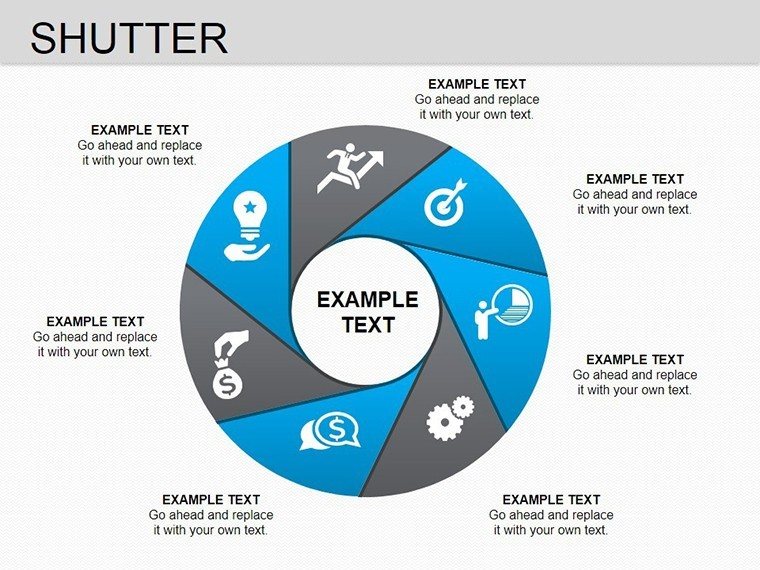
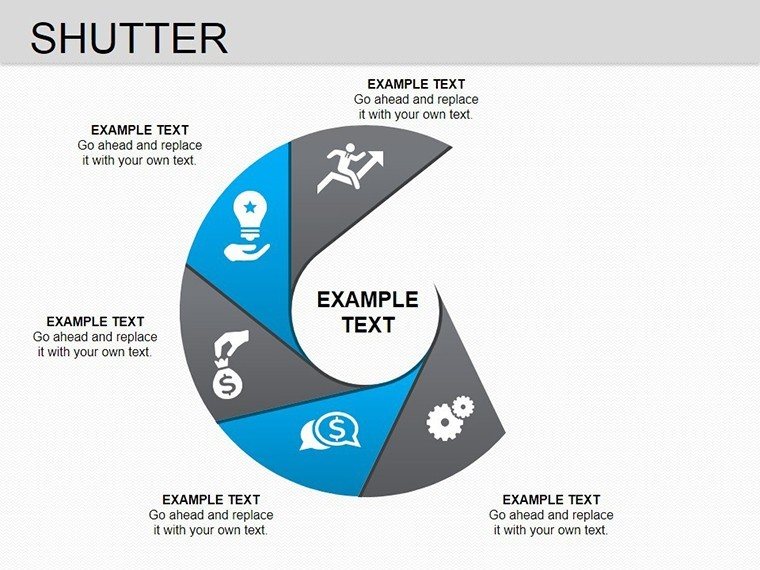
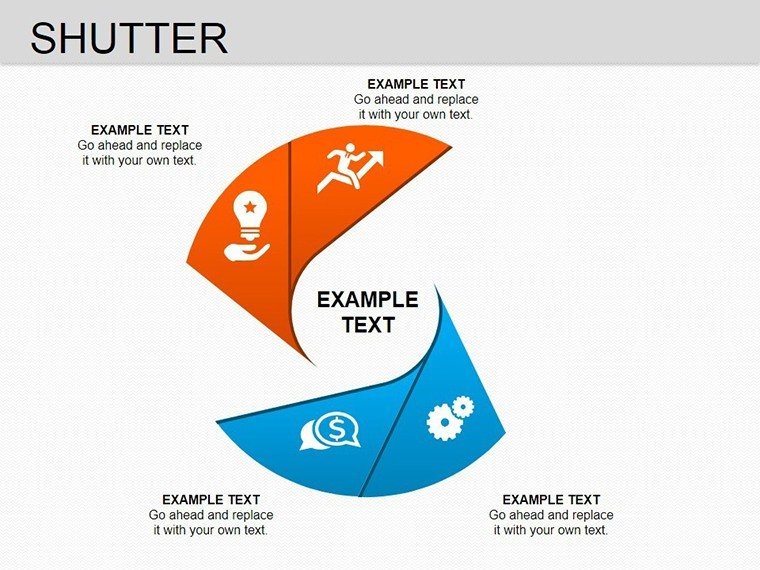
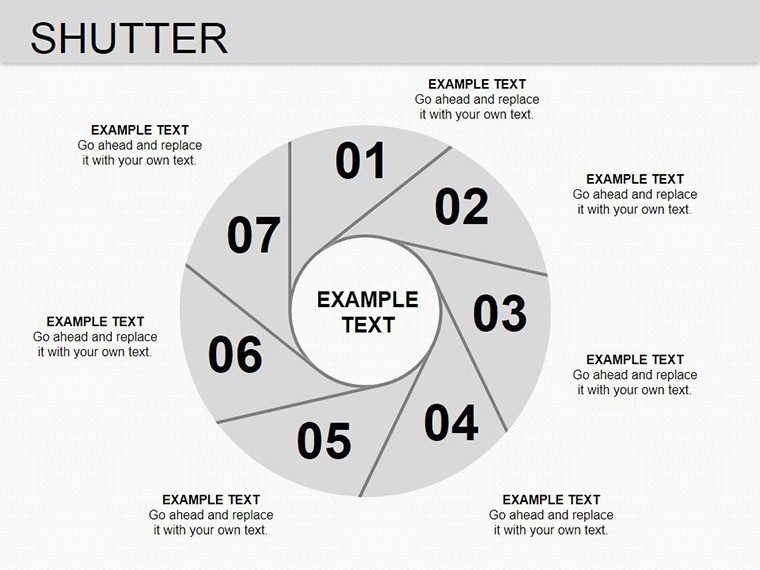
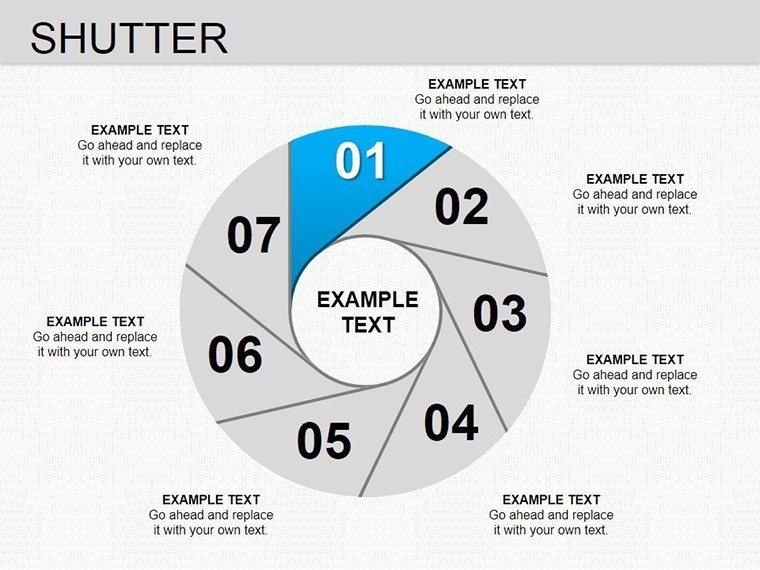
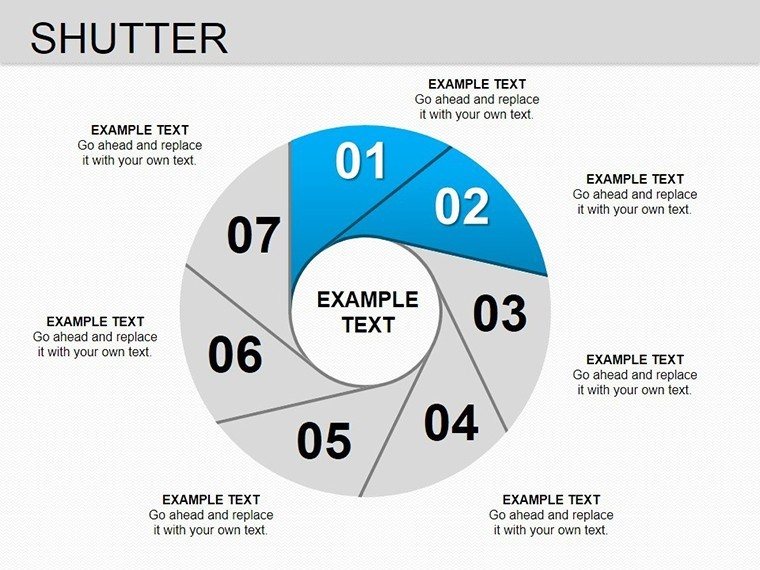
This template's core strength lies in its versatile pie charts, which support multi-segment displays for nuanced data representation. High-quality vectors ensure scalability for any screen size.
- Customizable Pie Segments: Adjust sizes, labels, and explosions for emphasis, perfect for highlighting key data points like top revenue sources.
- Color Palette Flexibility: Choose from shutter-themed gradients or import your brand colors for cohesive visuals.
- Integrated Graphics: Embed icons like cameras or lenses to thematically tie into the shutter concept, ideal for media-related presentations.
- Data Linking Capabilities: Connect charts to Excel for live updates, saving time on revisions.
Unlike PowerPoint's built-in pies, which can feel flat, these incorporate subtle 3D effects and legends that auto-adjust, elevating your data's perceived value.
In-Depth Look at the Slides
Exploring the 14 slides reveals a thoughtful progression. Slide 1 introduces a basic pie overview, great for agenda setting in board meetings. Slides 2-5 delve into segmented pies, allowing for comparisons like year-over-year budget shifts.
Slides 6-8 feature donut variations, which excel in showing part-to-whole relationships with central text for key takeaways, such as in project resource allocation. Advanced options in Slides 9-11 include stacked pies for multi-category data, useful in market research reports.
Rounding out with Slides 12-14, these provide summary charts with infographic overlays, enabling holistic views like overall performance metrics.
Practical Use Cases Across Industries
In marketing, visualize channel contributions to leads with exploded segments for emphasis. A case from a tech startup shows how this clarified investor pitches, leading to funding success. Educators can break down population statistics in geography lessons, fostering interactive discussions.
For business analysts, it's a time-saver in KPI dashboards, where pies quickly convey variances. Follow these steps for optimal use: 1) Input your data via simple tables; 2) Select segments for focus; 3) Apply animations for reveal effects; 4) Rehearse for timing perfection.
This approach ensures your presentations are not just seen but remembered.
Enhancing Credibility and Engagement
Compatible with PowerPoint and Google Slides, it supports hybrid work environments. Adhering to WCAG accessibility standards, colors offer high contrast for inclusivity. Feedback indicates a boost in comprehension rates, with one user noting clearer stakeholder buy-in.
Integrate with tools like Tableau for advanced data pulls, or use in webinars where pie charts simplify remote explanations. Inspired by "Storytelling with Data" by Cole Nussbaumer Knaflic, it emphasizes narrative over numbers.
Ready to shutter the competition? Grab this template now and transform your data into decisive visuals that drive action.
Frequently Asked Questions
How do I update data in the pie charts?
Simply edit the linked data table, and the chart refreshes automatically for quick iterations.
Does it support 3D pie effects?
Yes, subtle 3D options are included, but flat modes are available for minimalist designs.
Can I add my own icons?
Certainly - import custom graphics to enhance the shutter theme or adapt to your topic.
Is animation customizable?
Absolutely, adjust timings and effects to suit your pacing needs.
What if I need more slides?
Duplicate and modify existing ones easily for expansion.
Good for
- Project roadmaps and sprint plans
- Product launch timelines
- Quarterly or annual review decks
- Company history and milestone summaries
Licence
reviews
A few elements were too small on widescreen.
Needed something simple for reporting sales numbers.
The chart blocks lined up nicely without extra work.
Presentation looked more structured than usual.
FAQ
Will it work in Google Slides?
Are fonts embedded?
Can I use this for client work?
What's the refund policy?
Do you update the template after purchase?
Similar templates
See all PowerPoint Charts →
All 14 slides