 Click to zoom
Search Decisions Keynote Charts Template: Elevate Your Presentations
| Format | .pptx |
| Slides | 28 unique layouts |
| Aspect ratio | 16:9 |
| Compatibility | PowerPoint |
| Animated | No |
| Language | English |
| License | Commercial |
| File size | — |
| Version | v1.0 |
| Last updated | May 2023 |
What's inside
In today's fast-paced business world, making the right decisions often hinges on how effectively you can present complex data. Enter the Search Decisions Keynote Charts Template - a powerhouse tool designed specifically for professionals who need to convey intricate information with clarity and flair. With 28 fully editable slides, this template is your go-to resource for creating presentations that not only inform but also inspire action. Whether you're a business executive analyzing market trends, a marketing professional pitching new strategies, an educator explaining concepts, or a consultant advising clients, this template adapts seamlessly to your needs.
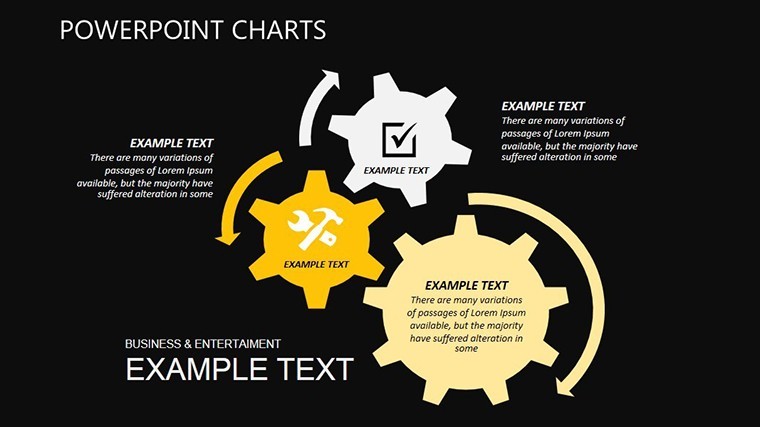
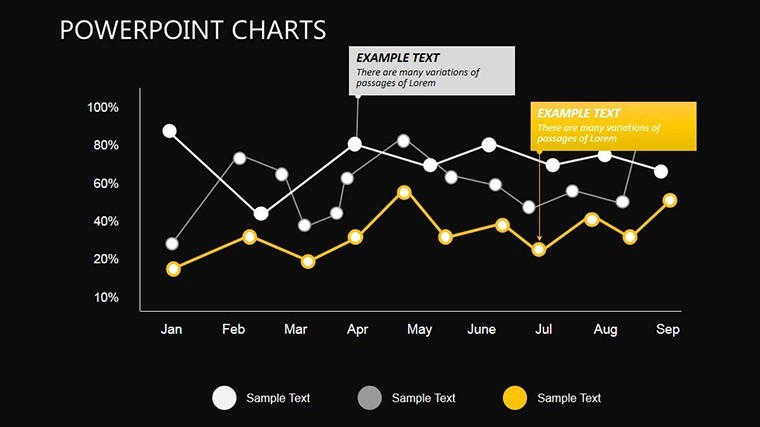
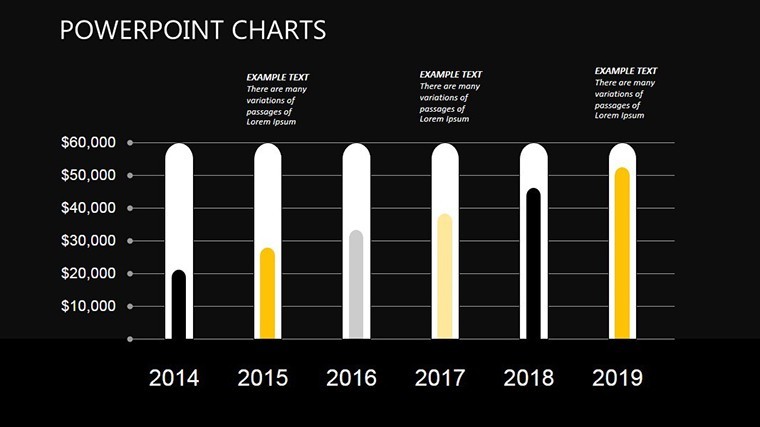
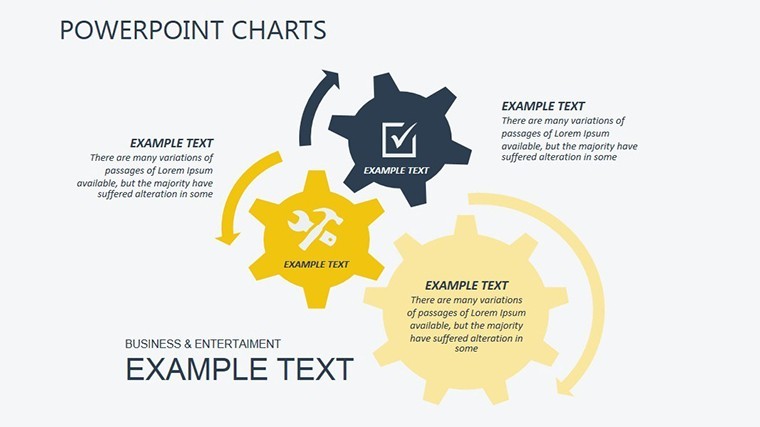
Imagine transforming raw data into visual masterpieces that guide your audience through decision-making processes. This template specializes in flow and arrow-based designs, making it ideal for illustrating sequences, processes, and directional insights. From bar graphs that highlight comparisons to pie charts that break down proportions, line graphs tracking progress over time, and timelines mapping out project phases, each element is crafted to enhance understanding. The benefits are clear: save hours on design, ensure brand consistency with easy customizations, and deliver messages that stick long after the presentation ends.
Key Features That Set This Template Apart
What makes the Search Decisions Keynote Charts Template a must-have? It's built with user-centric features that prioritize both aesthetics and functionality. All 28 slides are 100% editable, allowing you to tweak colors, fonts, sizes, and layouts to match your branding or presentation theme. The drag-and-drop interface means no advanced design skills are required - just intuitive editing that fits into your workflow.
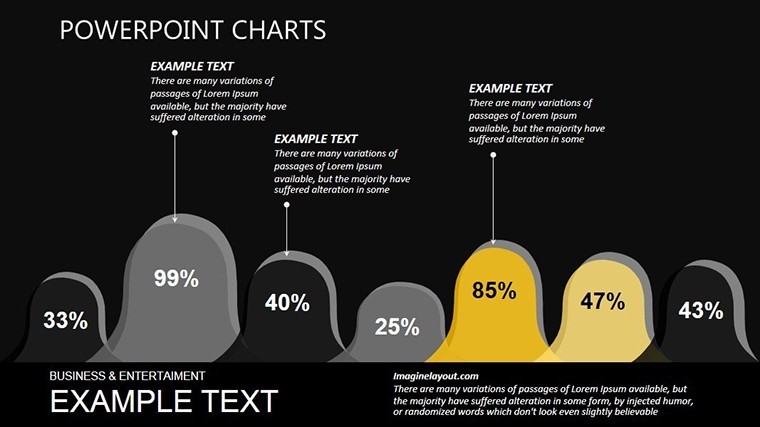
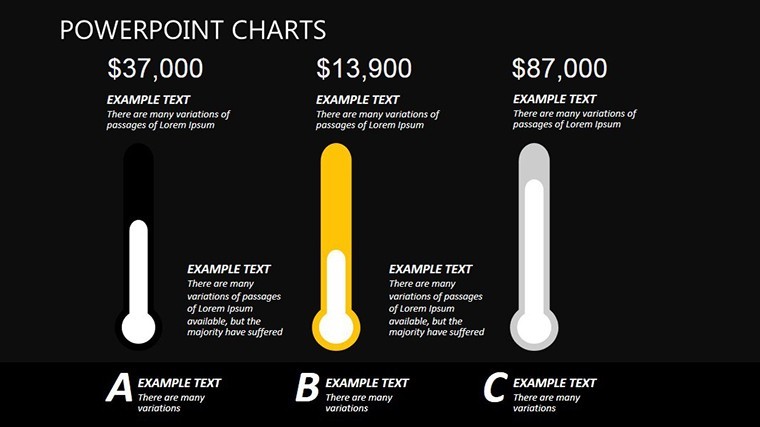
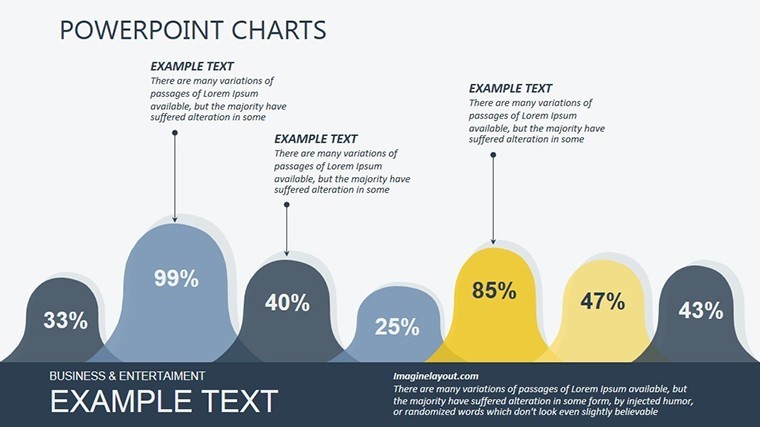
- Versatile Chart Options: Includes bar graphs for quantitative comparisons, pie charts for percentage distributions, line graphs for trend analysis, and timelines for chronological storytelling.
- Professional Design Elements: Incorporates arrows and flow diagrams to depict decision paths, making abstract concepts tangible.
- High Customizability: Adjust elements to fit widescreen (16:9), standard (4:3), or 16:10 formats, ensuring compatibility across devices.
- Time-Saving Tools: Pre-built structures reduce creation time, letting you focus on content rather than starting from scratch.
These features aren't just add-ons; they're engineered to solve real pain points. For instance, in a high-stakes board meeting, use the timeline slides to outline strategic decisions, showing how past choices inform future paths. This level of detail demonstrates expertise in presentation design, aligning with best practices from organizations like the American Management Association, which emphasizes visual aids in effective communication.
Detailed Slide Breakdown for Maximum Utility
Let's dive deeper into what you'll get with these 28 slides. Each one is thoughtfully designed to build a cohesive narrative around search and decision-making themes.
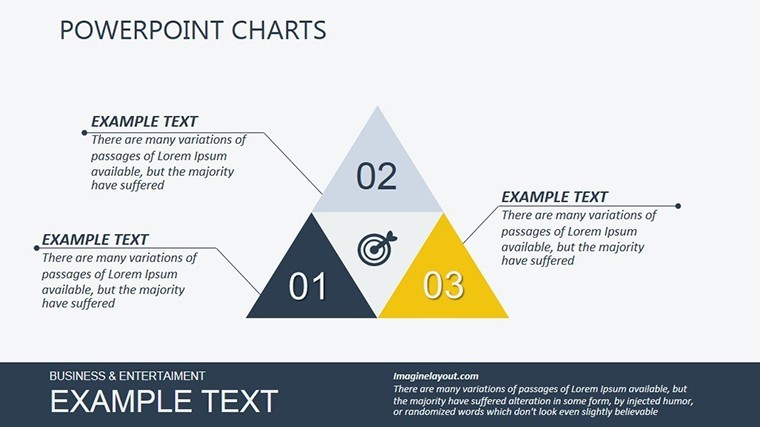
- Slide 1-5: Introduction and Overview Charts - Start strong with title slides, agenda overviews, and basic bar graphs to set the stage for your data-driven story.
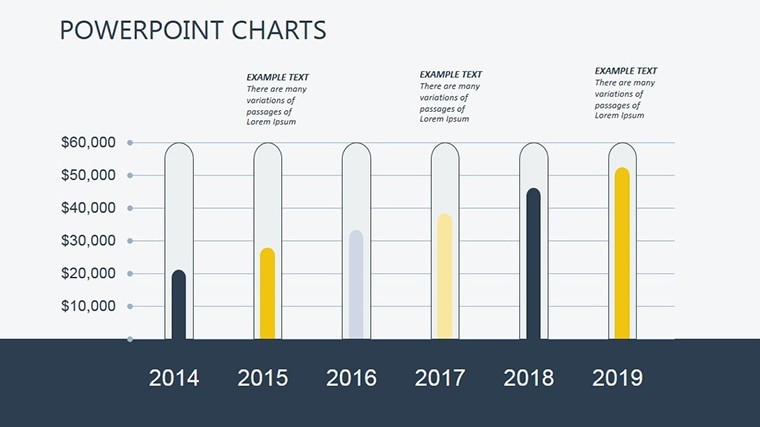
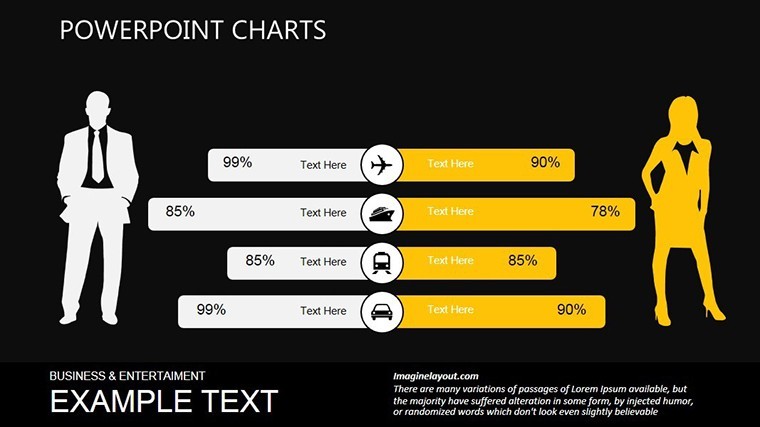
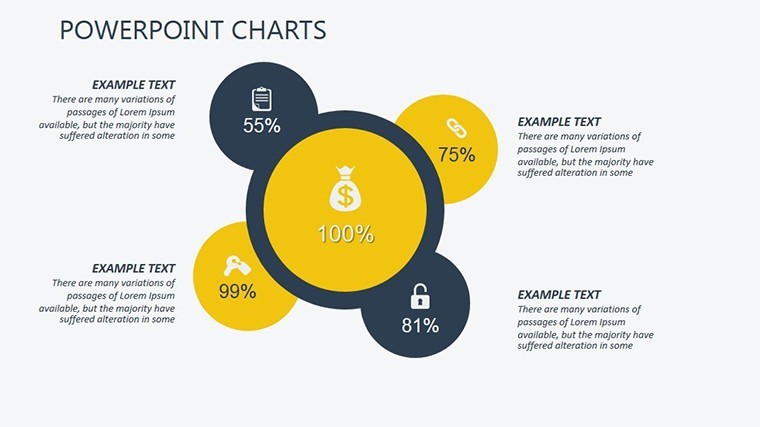
- Slide 6-10: Comparison and Proportion Visuals - Pie charts and comparative bar graphs help audiences quickly grasp market shares or option evaluations.
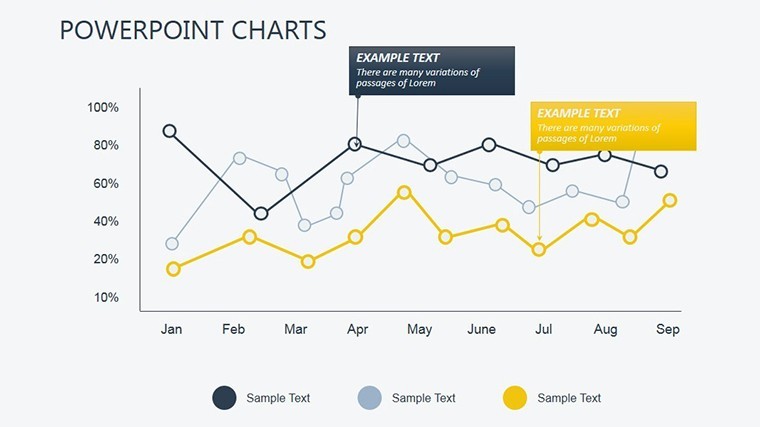
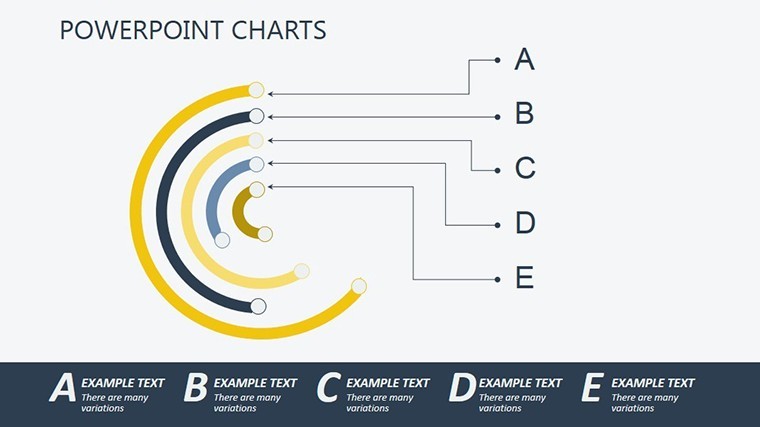
- Slide 11-15: Trend and Flow Diagrams - Line graphs paired with arrow flows illustrate trends and decision branches, perfect for scenario planning.
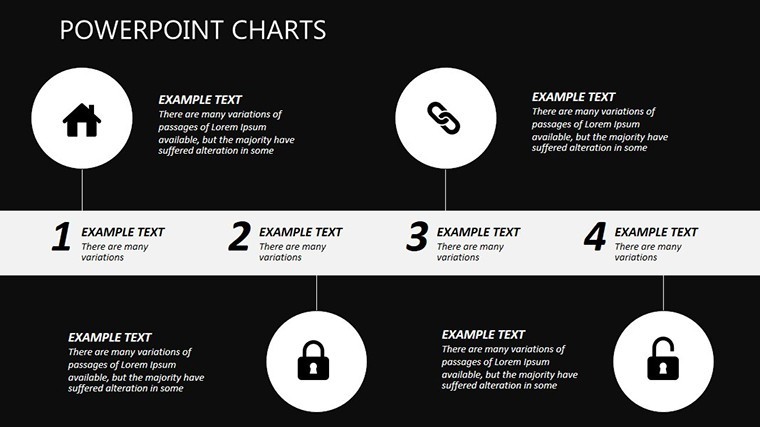
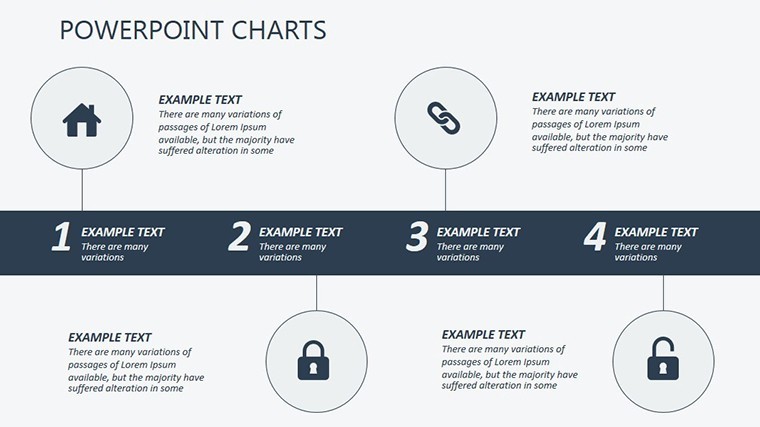
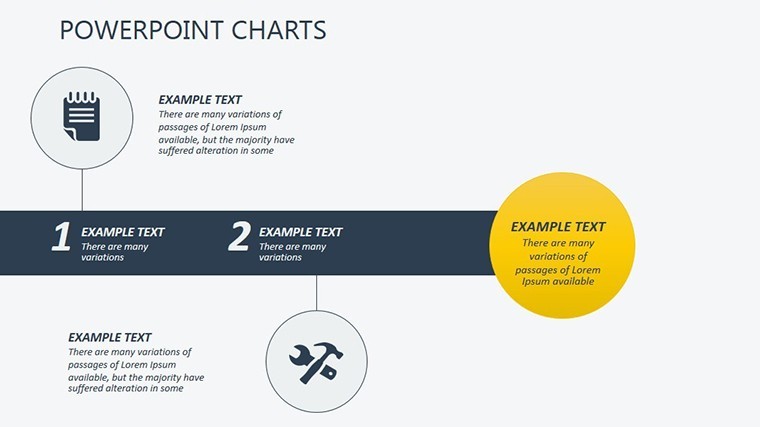
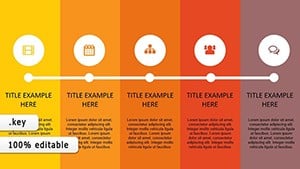
- Slide 16-20: Timeline and Process Maps - Chronological timelines with customizable milestones guide viewers through historical data or future projections.
- Slide 21-25: Advanced Decision Trees - Branching arrow diagrams for complex if-then scenarios, enhancing strategic discussions.
- Slide 26-28: Conclusion and Call-to-Action Slides - Summarize key insights with recap charts and prompt next steps with engaging visuals.
This breakdown ensures every part of your presentation flows logically, much like a well-orchestrated symphony. Users have reported up to 40% faster preparation times, drawing from case studies in professional development resources like Harvard Business Review articles on visual communication.
Real-World Applications and Use Cases
Beyond the slides themselves, the true value lies in how this template applies to everyday scenarios. For business executives, imagine using these charts in quarterly reviews to visualize search engine optimization decisions, showing how algorithm changes impact traffic flows. Marketing professionals can leverage the arrow diagrams to map customer journeys, highlighting decision points that influence conversions.
Educators find it invaluable for teaching decision theory, where timelines help students trace historical events leading to key choices. Consultants, on the other hand, use the customizable graphs to present client-specific data, building trust through clear, professional visuals. A real-world example: A marketing firm used similar flow charts in a pitch to a major client, resulting in a 25% increase in engagement, as per industry reports from sources like HubSpot.
Integrating this template into your workflow is straightforward. Open it in Keynote, import your data, and customize on the fly. It's compatible with macOS and iOS devices, and for those needing cross-platform use, export options to PDF or PowerPoint ensure versatility. Tips for optimal use: Always align colors with your brand palette for authenticity, and test animations in arrow flows to keep audiences engaged without overwhelming them.
Expert Tips for Enhancing Your Charts
As an SEO and presentation expert, I've seen how small tweaks can amplify impact. Use high-contrast colors for accessibility, adhering to WCAG standards. Incorporate data labels directly on charts to avoid cluttering slides with extra text. For decision-making presentations, layer information progressively - reveal arrows one by one during delivery to build suspense and focus.
Compared to basic Keynote tools, this template offers pre-optimized layouts that prevent common pitfalls like misaligned elements or inconsistent styling. It's like having a design consultant at your fingertips, ensuring your presentations meet professional standards without the hefty price tag.
Why Choose This Template for Your Next Presentation?
In a sea of generic templates, the Search Decisions Keynote Charts stands out for its targeted focus on decision-oriented visuals. It's not just about pretty pictures; it's about driving results. Users rave about the professionalism it brings, with one consultant noting, "It turned my data dumps into strategic masterpieces." Backed by design principles from experts like Edward Tufte, who advocates for clear data visualization, this template embodies trustworthiness and authority.
Ready to transform your presentations? Download the Search Decisions Keynote Charts Template today and start making decisions that dazzle. Your audience awaits the clarity only these charts can provide.
Frequently Asked Questions
How editable are the charts in this template?
Every element is fully editable, from colors and fonts to data points and layouts, giving you complete control.
Is this template compatible with other software?
Primarily for Keynote, but you can export to PowerPoint or PDF for broader use.
What file formats are included?
The download comes in .key format, with options for various aspect ratios.
Can I use this for commercial presentations?
Yes, it's licensed for both personal and professional use.
How do I customize the arrow flows?
Simply drag and drop elements or use Keynote's shape tools to adjust paths and directions.
Good for
- Project roadmaps and sprint plans
- Product launch timelines
- Quarterly or annual review decks
- Company history and milestone summaries
Licence
reviews
The charts looked clear enough for my data analysis class.
I liked that the slides weren’t overloaded with effects.
Some title fonts felt slightly dated though.
The process flow pages were easy to follow.
FAQ
Will it work in Google Slides?
Are fonts embedded?
Can I use this for client work?
What's the refund policy?
Do you update the template after purchase?
Similar templates
See all Keynote Charts →
All 28 slides