 Click to zoom
Risk Matrix PowerPoint Infographic Charts - 33 Editable Slides
| Format | .pptx |
| Slides | 33 unique layouts |
| Aspect ratio | 16:9 |
| Compatibility | PowerPoint |
| Animated | No |
| Language | English |
| License | Commercial |
| File size | — |
| Version | v1.0 |
| Last updated | December 2025 |
What's inside
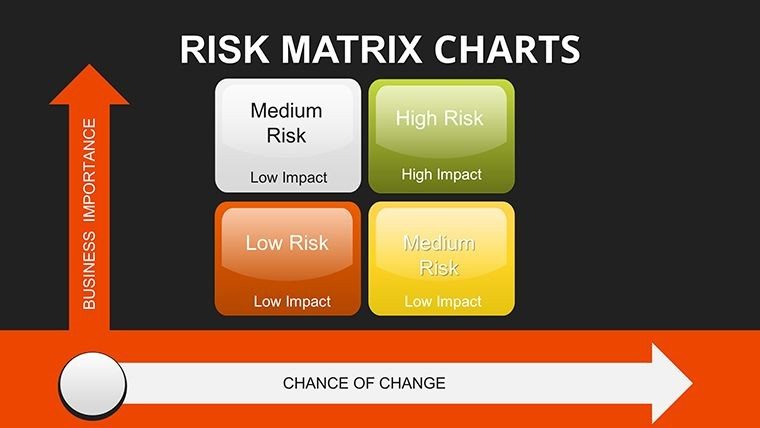
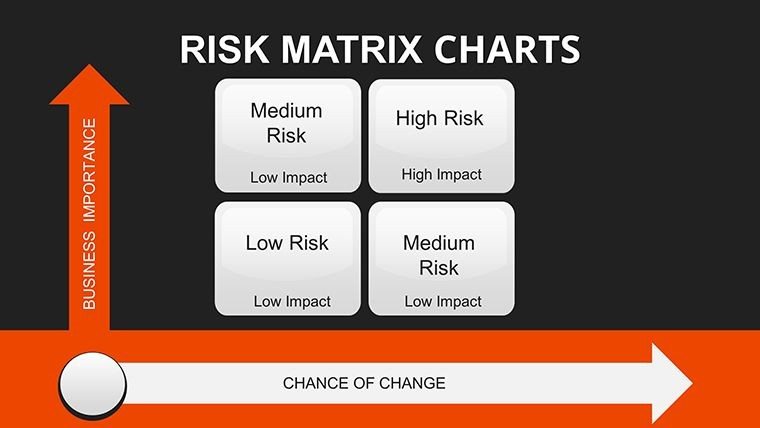
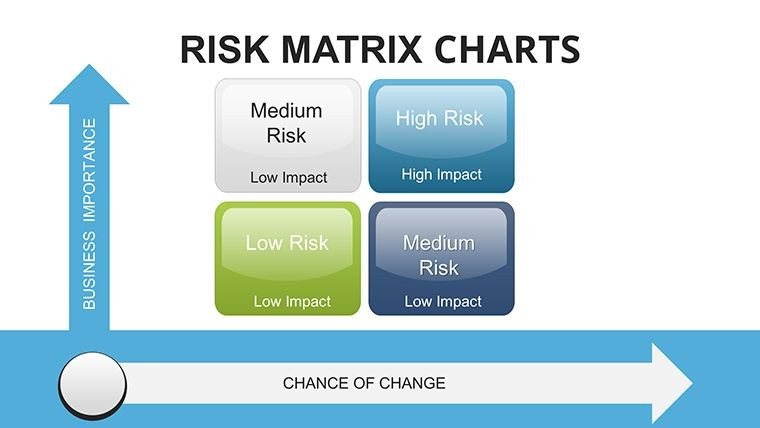
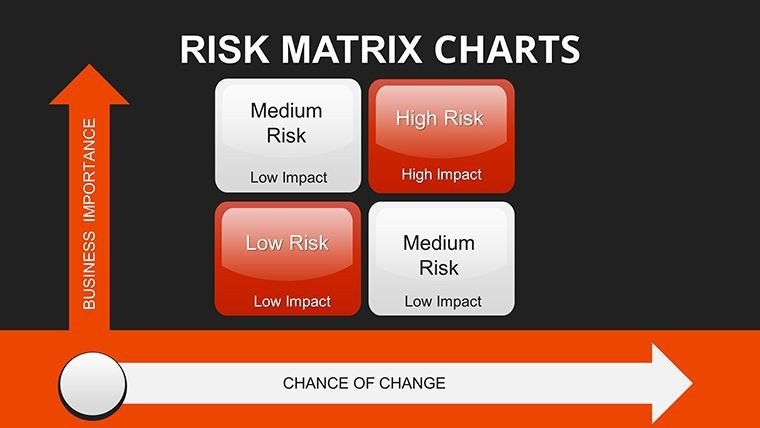
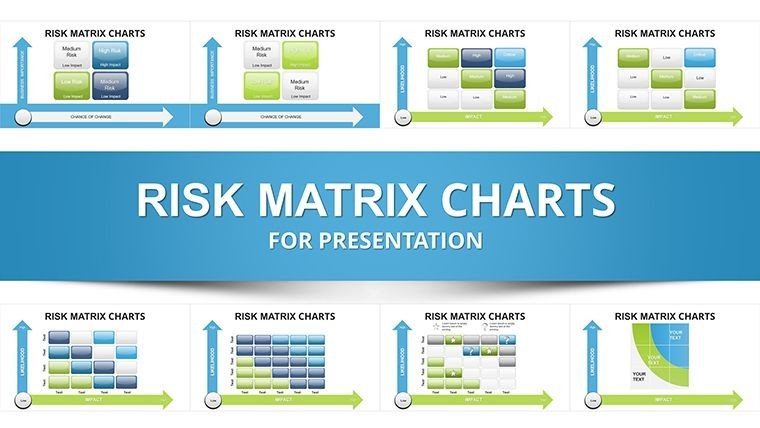
In high - stakes boardrooms and project status updates, I've seen executives struggle to grasp scattered risk data quickly, leading to delayed decisions and overlooked threats. This risk matrix PowerPoint template transforms that chaos into clear, color - coded visuals that highlight priorities at a glance. With 33 meticulously crafted slides, it equips you to plot probability against impact, align teams on mitigation priorities, and convey complex assessments with confidence during critical discussions.
Drawing from frameworks like PMI and ISO 31000 that I apply in client decks weekly, these infographics go beyond basic grids. They incorporate intuitive heat maps and icon - enhanced layouts to make risk severity immediately apparent, helping stakeholders from C - suite leaders to operational teams respond faster and more effectively.
Whether you're steering enterprise initiatives or advising on strategic threats, this template delivers the professional edge needed to turn potential vulnerabilities into managed opportunities.
Exploring the Core Layouts in This Risk Matrix Collection
Each slide is designed for seamless data integration, allowing you to drop in your specific metrics without redesigning from scratch.
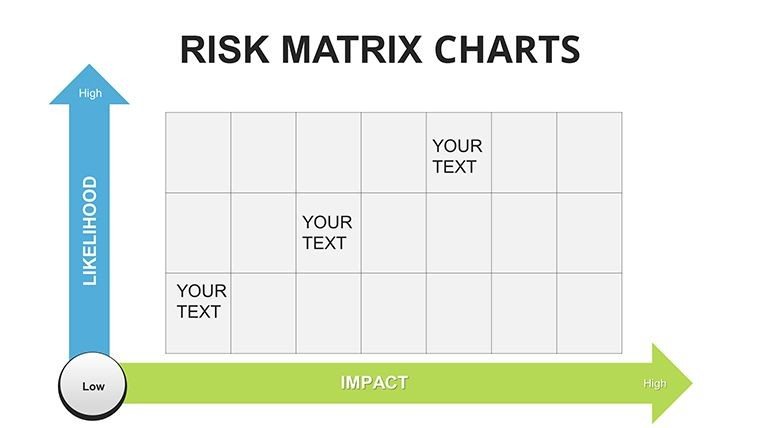
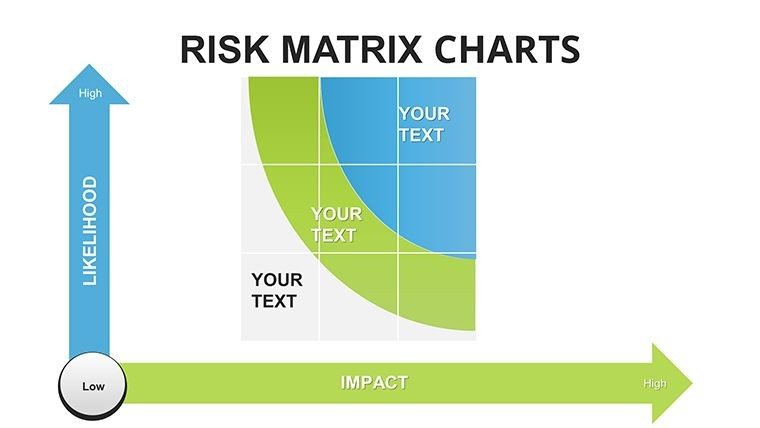
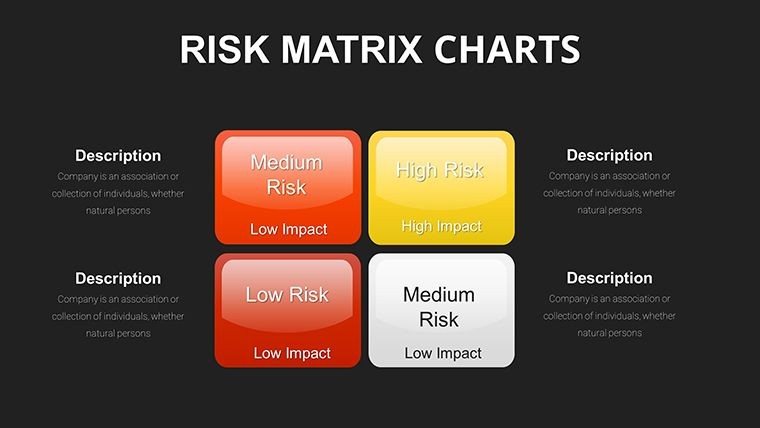
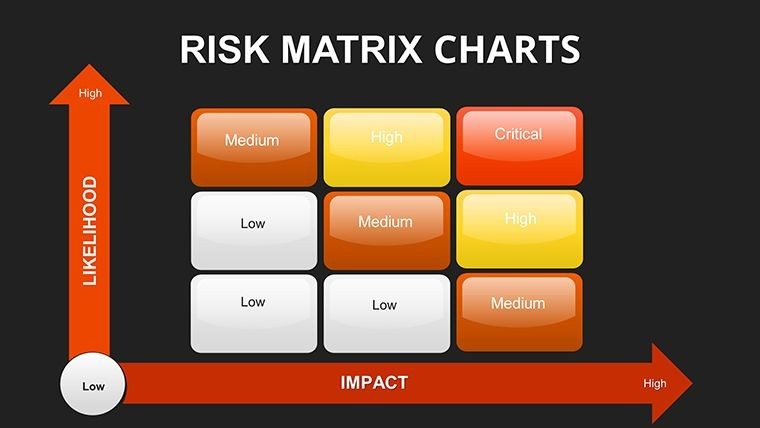
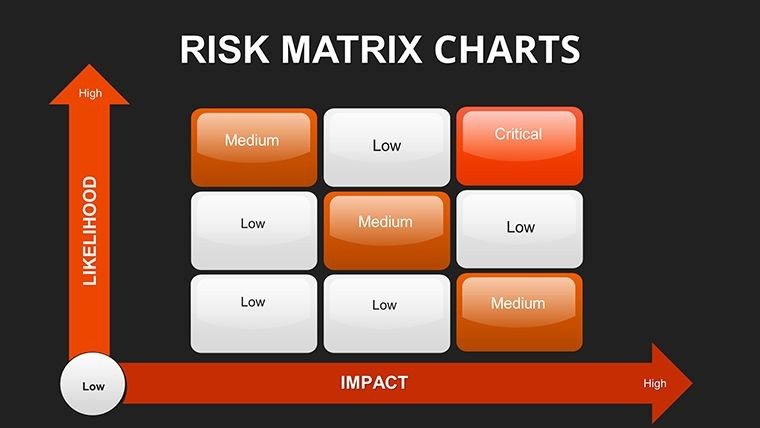
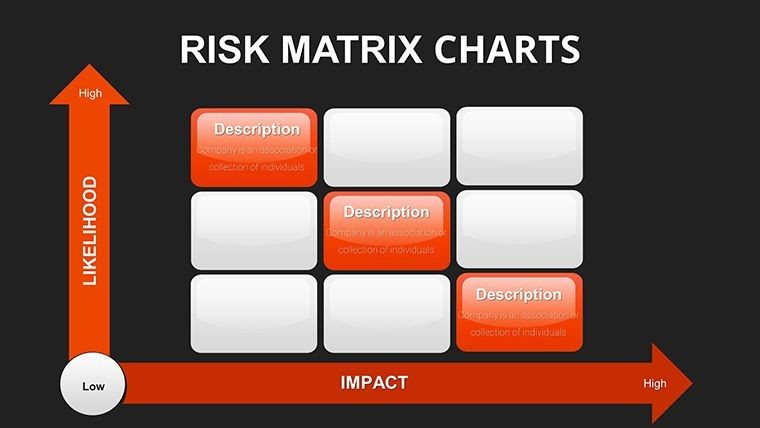
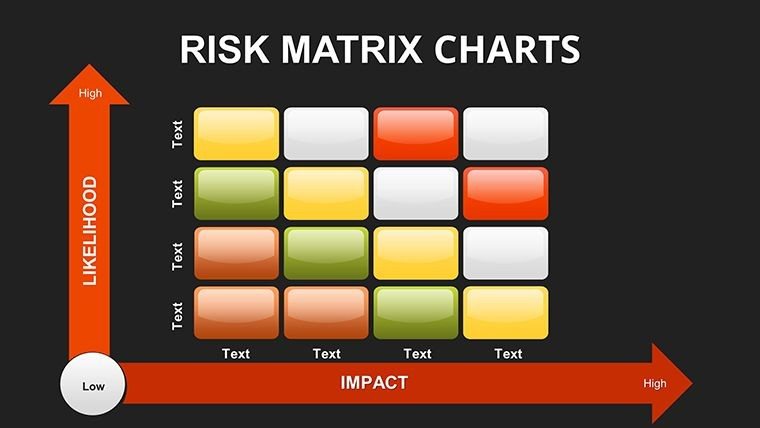
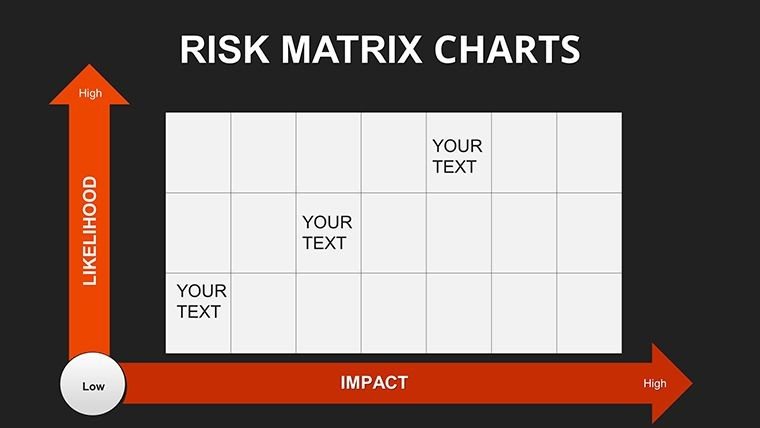
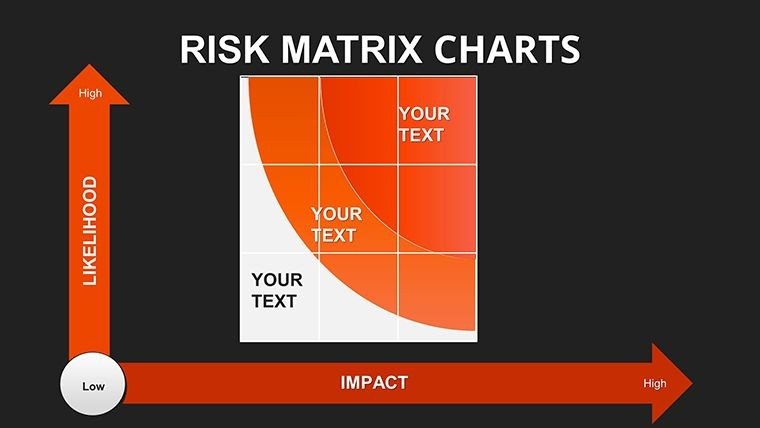
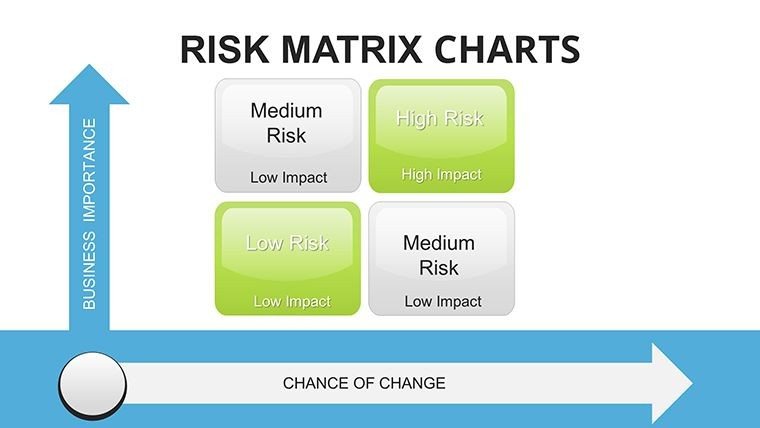
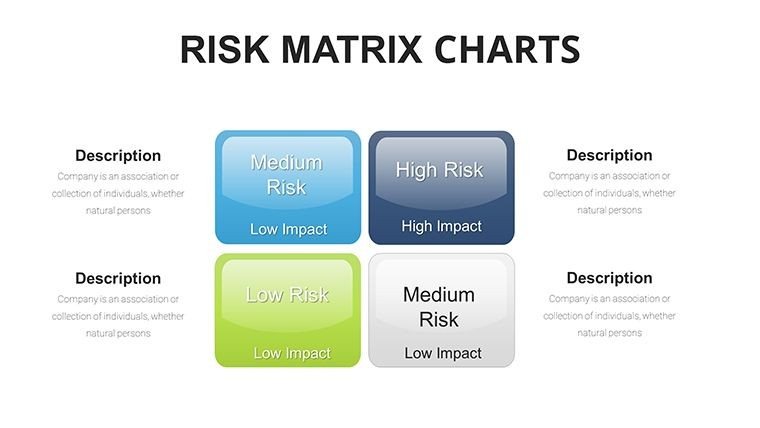
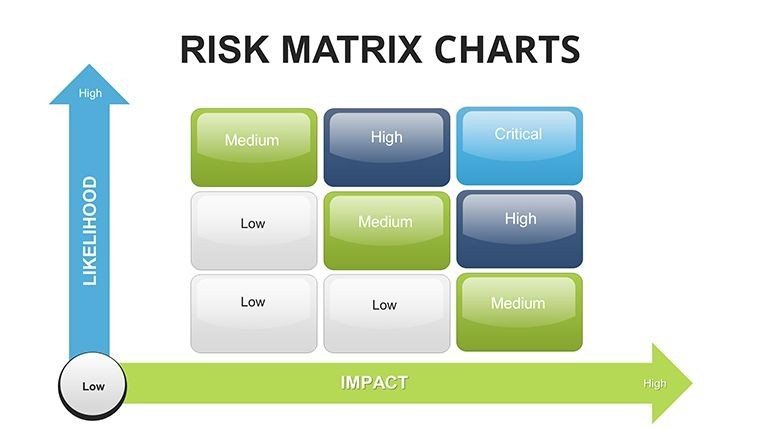
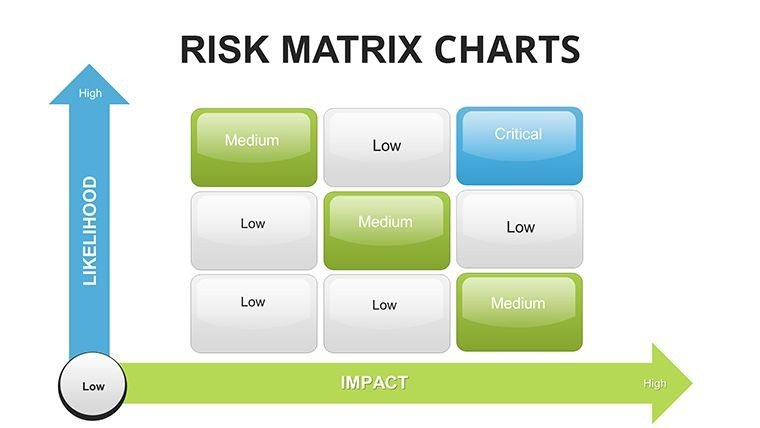
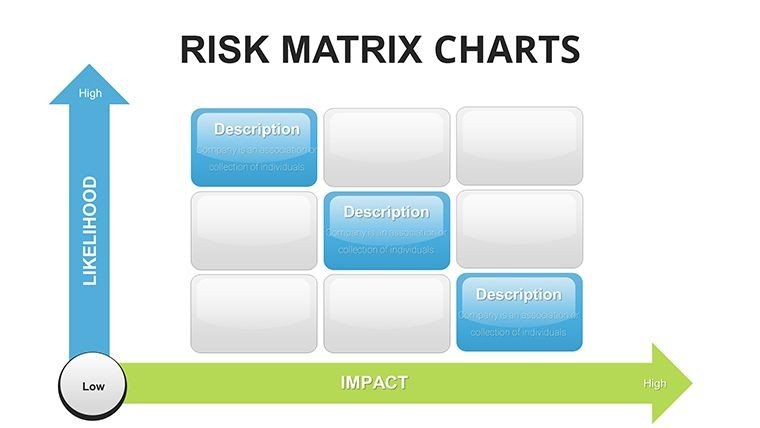
- Basic 3x3 Grids: Ideal for initial risk screenings in agile sprint retrospectives, where you plot low - to - high probability and impact zones with sample annotations for quick team alignment.
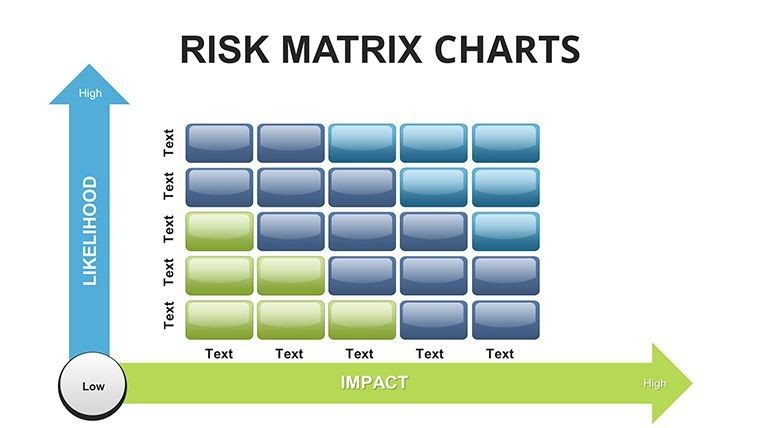
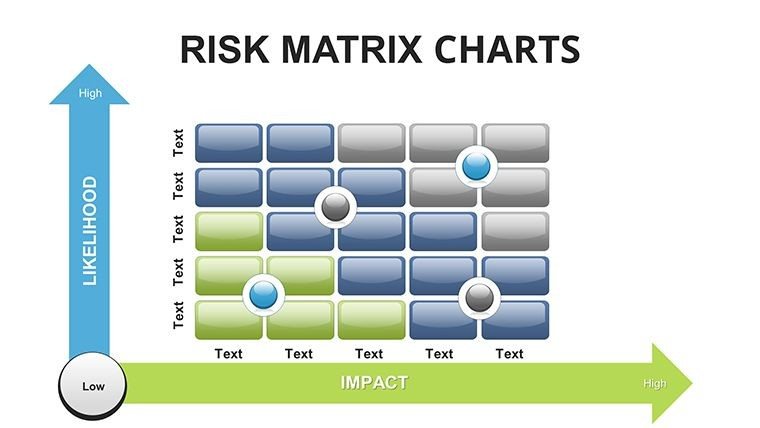
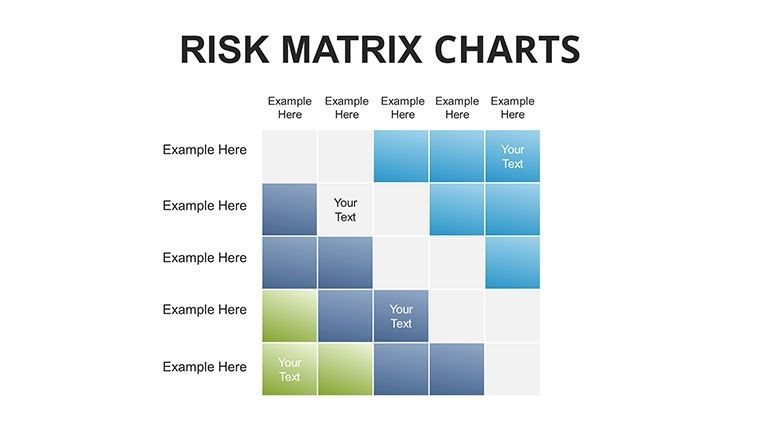
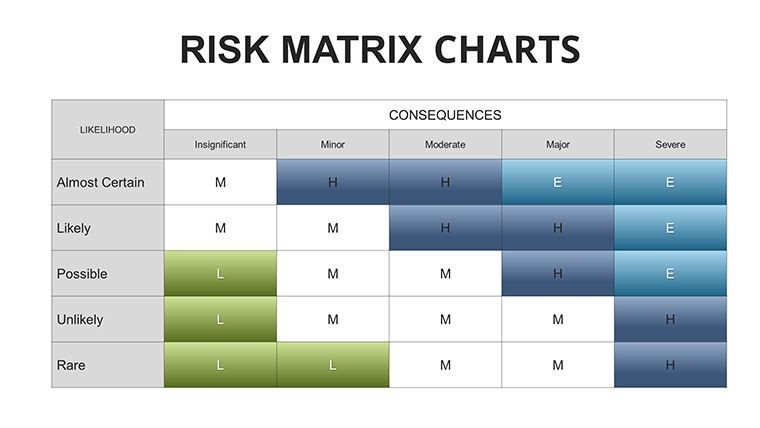
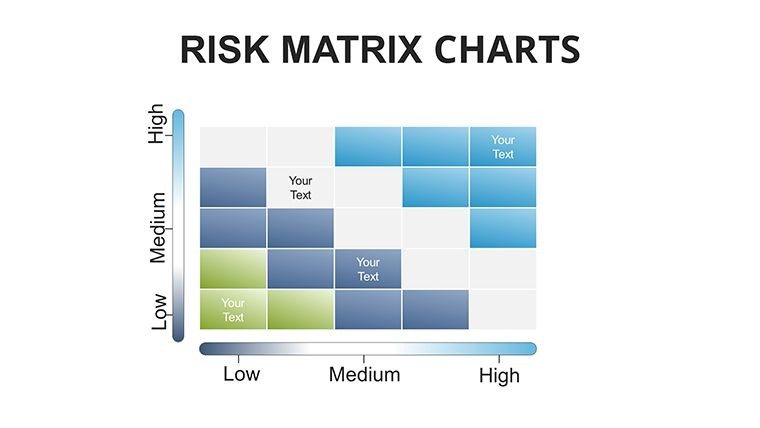
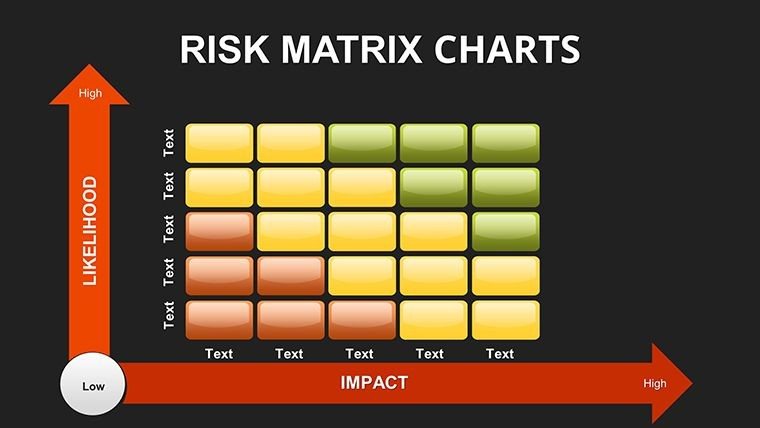
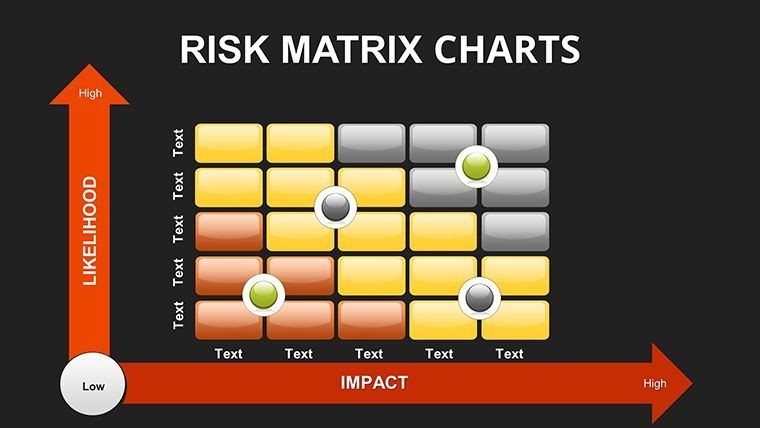
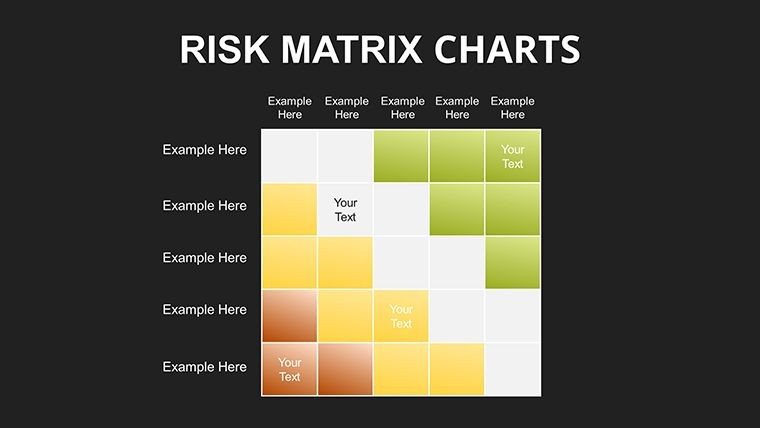
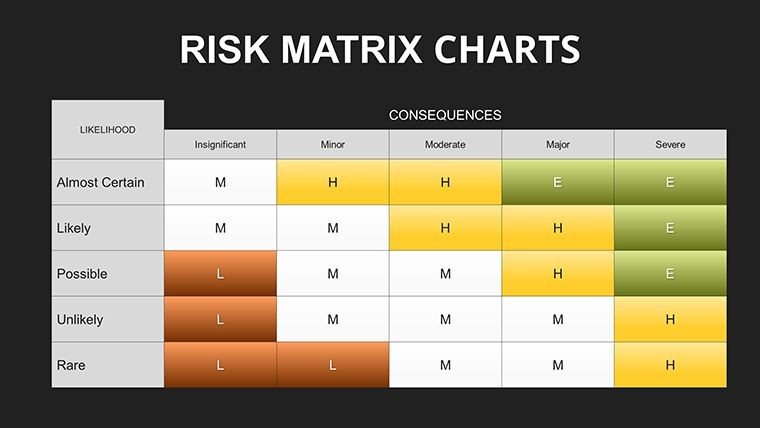
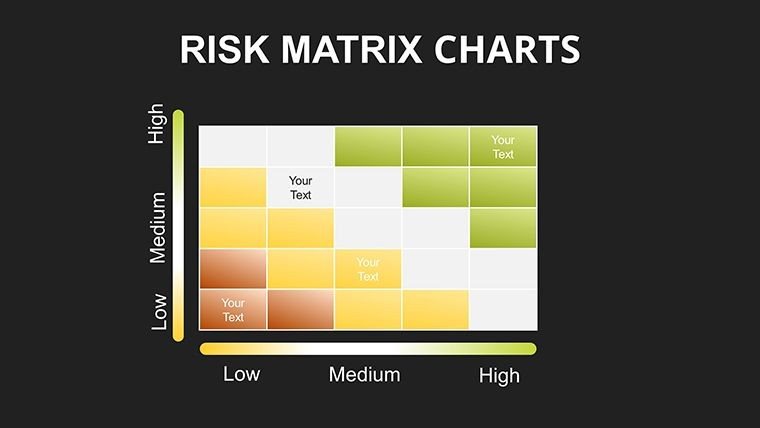
- Expanded 5x5 Heat Maps: Perfect for detailed enterprise evaluations, featuring graduated color shading from calm greens to urgent reds, with space to embed quantitative scores or qualitative notes.
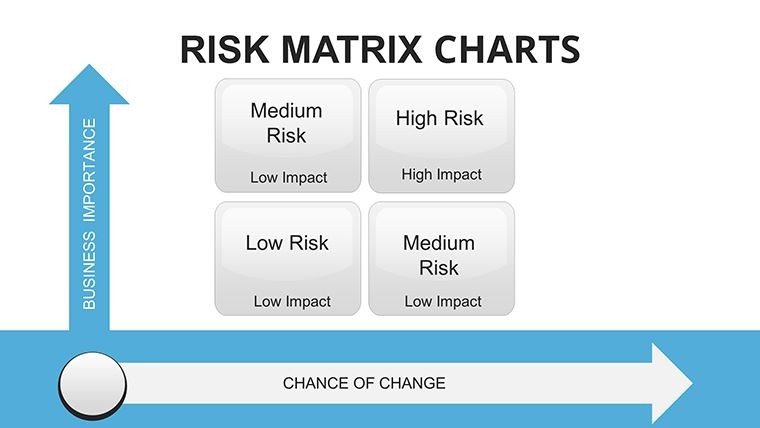
- Probability - Impact Combinations: Tailored layouts to map scenarios like supply chain disruptions against financial consequences, including axes you can relabel for custom scales.
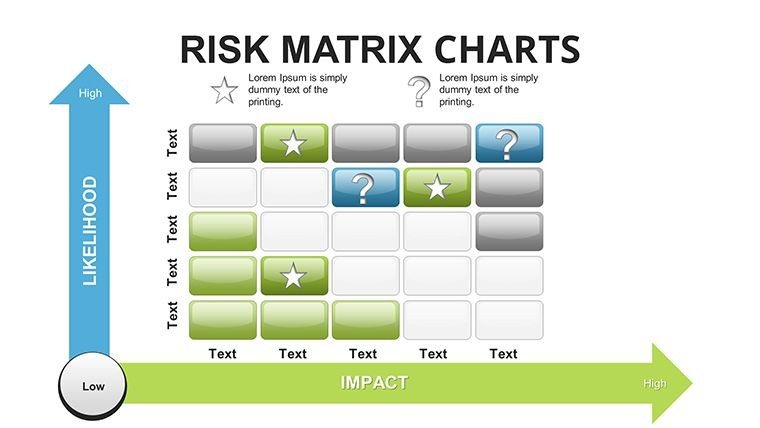
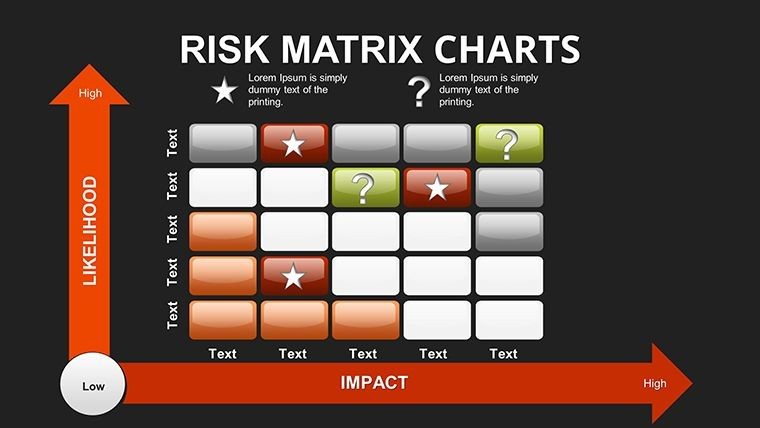
- Icon - Integrated Variants: Slides enriched with thematic icons representing cyber threats, regulatory shifts, or operational hazards, making abstract risks tangible in client proposals.
- Annotated Mitigation Overlays: Dedicated designs to layer action plans directly on the matrix, showing how high - priority items move to lower zones post - intervention.
All elements - colors, icons, text placeholders - are fully editable, ensuring your branding and data precision shine through.
Deploying Risk Matrices in Real - World Executive Settings
In my consulting work with Fortune 500 teams, these visuals prove invaluable for fostering consensus during intense strategy sessions.
A project director preparing for a steering committee can use a 5x5 heat map to pinpoint resource shortages threatening timelines, enabling proactive resource reallocation discussions.
During investor updates for startups I've advised, founders plot market volatility against revenue impacts, building credibility by demonstrating thorough threat evaluation.
In quarterly enterprise reviews, operations leads highlight compliance risks with icon - supported grids, accelerating approval for remedial budgets.
Even in government program oversight meetings, these matrices clarify interagency hazards, supporting evidence - based policy adjustments.
Seamless Integration into Your Established Presentation Process
This template slots effortlessly into workflows I've refined over countless client engagements.
Start with your risk register export, then populate the matrices directly in PowerPoint - no external tools required. Add subtle animations to reveal high - impact zones progressively during live deliveries.
Compatible with PowerPoint 2016 and later, plus easy import to Google Slides or Keynote for collaborative edits. Change color schemes to match corporate guidelines in seconds, and scale icons or text for virtual or in - person projections.
What used to take hours of manual formatting now resolves in minutes, freeing you to focus on analysis rather than design.
Proven Scenarios from Client Decks I've Built
A technology VP used these heat maps in a product launch review to prioritize cybersecurity vulnerabilities, securing executive buy - in for enhanced protocols.
In healthcare administration trainings I've supported, facilitators deploy 3x3 grids to teach patient safety risk prioritization, engaging participants with relatable clinical examples.
A financial analyst presented portfolio exposure matrices to investment committees, clearly differentiating tolerable fluctuations from critical alerts.
Consultants delivering audit findings leverage annotated variants to outline remediation paths, turning potential conflicts into collaborative resolutions.
Advantages Over Conventional Approaches
AspectThis Risk Matrix TemplateDefault PowerPoint ChartsBuilding from ScratchVisual ClarityProfessional heat mapping with icons and annotations for instant severity recognitionPlain grids lacking intuitive shading or thematic elementsTime - intensive custom coloring and alignmentVariety of Formats33 specialized slides covering 3x3 to 5x5 plus mitigation overlaysLimited to basic table insertsRequires manual creation of each variationCustomization SpeedFully editable data points, colors, and icons in minutesBasic formatting options onlyHours of precise shaping and scalingProfessional PolishInfographic - style designs aligned with industry standardsGeneric appearance risking audience disengagementInconsistent results without design expertiseElevate your risk discussions with visuals that command attention and drive action - download this template and start crafting decisive presentations today.
Applications Spanning Key Sectors
In finance, map credit exposures or market shifts to guide portfolio adjustments.
Technology teams assess product development hazards, from technical debt to adoption barriers.
Healthcare professionals evaluate clinical or operational threats for patient - centered planning.
Educators in risk management courses use these grids to simulate real - world decision scenarios.
Marketing departments plot campaign vulnerabilities against potential returns.
Consulting deliverables gain depth when illustrating client - specific threat landscapes.
Ready to present risks with the clarity your stakeholders deserve? Secure this comprehensive risk matrix collection now for immediate implementation.
Frequently Asked Questions
How do I input my own risk data into these matrices?
Simply click on the placeholders within the grids or heat maps to replace sample entries with your probability scores, impact descriptions, or custom labels. The layouts support direct text edits and number inputs, with colors auto - adjusting based on your severity thresholds for consistent visuals.
Can I animate the reveal of risk items during a live presentation?
Yes, each slide includes grouped elements ready for PowerPoint's animation tools. Apply entrance effects to individual cells or icons sequentially, building emphasis on critical zones as you narrate the assessment.
Is this template suitable for Google Slides collaboration?
Absolutely - export as .pptx and upload to Google Slides, where all shapes, colors, and text remain editable. Team members can co - edit matrices in real - time for dynamic risk workshops.
What scale options are available for the probability and impact axes?
The slides feature pre - set 1 - 5 or low - high scales, but axes labels and divisions are fully customizable. Relabel to qualitative terms like rare/likely or minor/catastrophic to fit your organization's risk framework.
How many color schemes can I apply to match my branding?
Unlimited - select any fill or gradient and apply across the template via format painter. Pre - built palettes align with common severity indicators, but swapping to your corporate colors takes under a minute.
Good for
- Project roadmaps and sprint plans
- Product launch timelines
- Quarterly or annual review decks
- Company history and milestone summaries
Licence
reviews
The line chart with confidence bands is technical.
The shaded areas show range clearly.
Used this for a forecast accuracy review.
The axis scaling is automatic but adjustable.
Good for data scientists or analysts.
FAQ
Will it work in Google Slides?
Are fonts embedded?
Can I use this for client work?
What's the refund policy?
Do you update the template after purchase?
Similar templates
See all PowerPoint Charts →
All 33 slides