 Click to zoom
Result Parts PowerPoint Charts: 24 Data Viz Slides
| Format | .pptx |
| Slides | 24 unique layouts |
| Aspect ratio | 16:9 |
| Compatibility | PowerPoint |
| Animated | No |
| Language | English |
| License | Commercial |
| File size | — |
| Version | v1.0 |
| Last updated | March 2023 |
What's inside
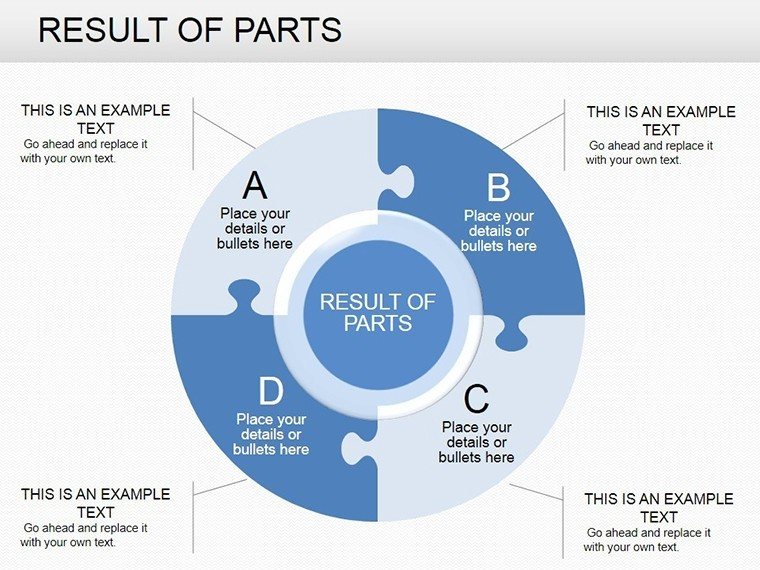
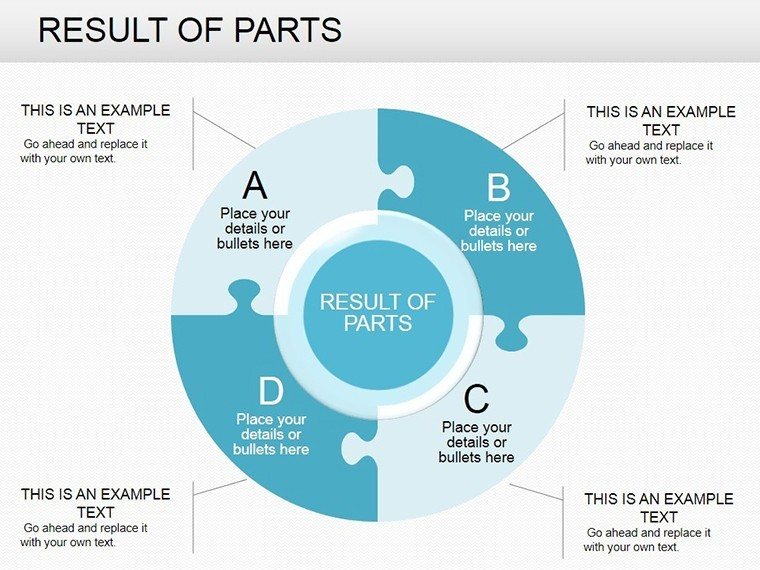
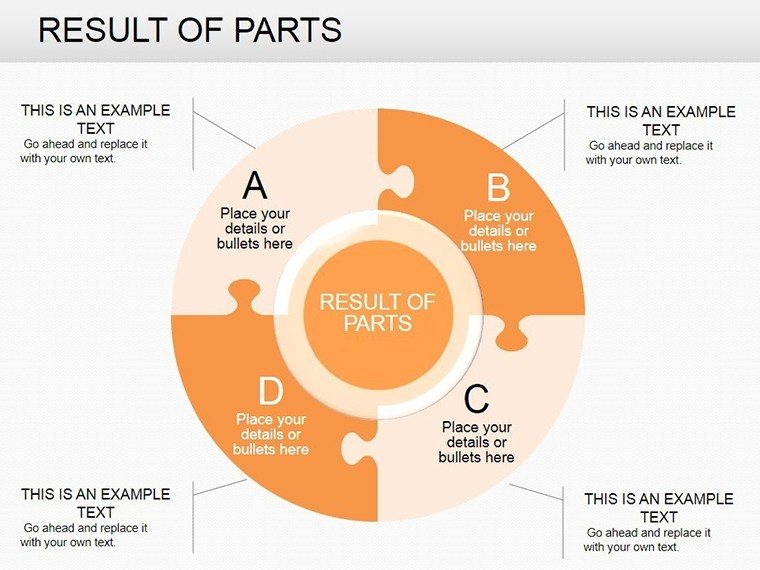
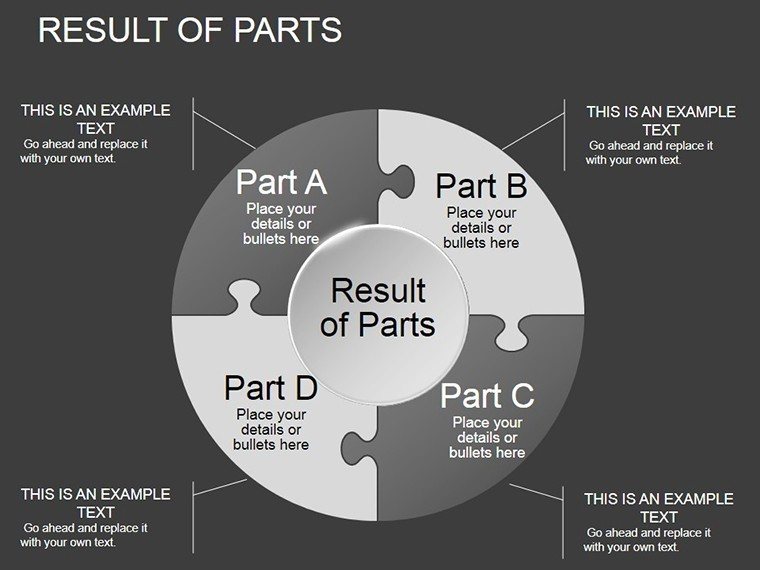
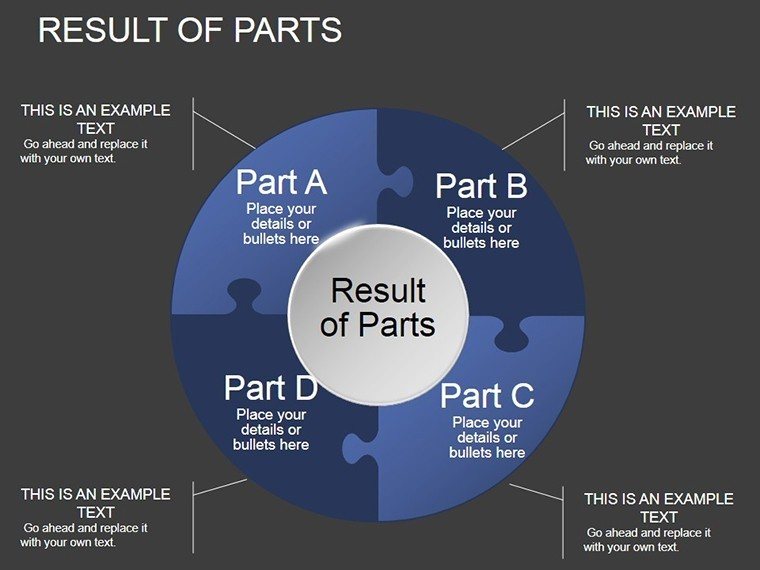
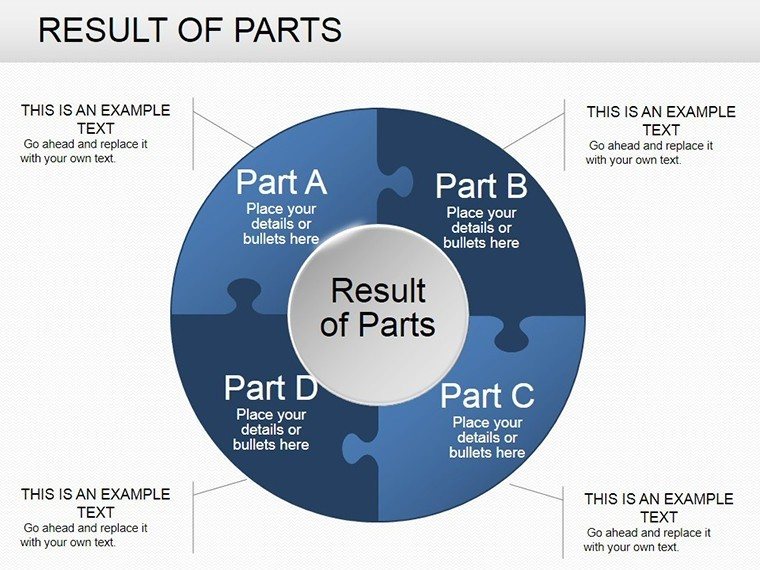
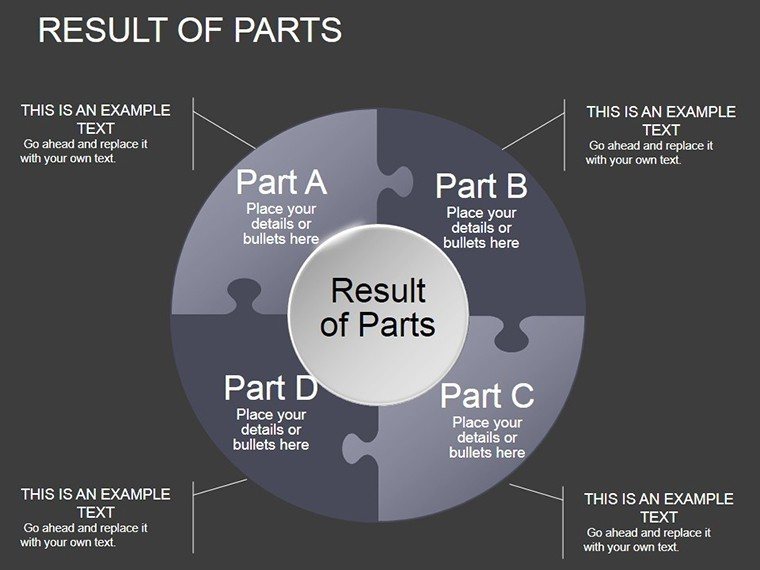
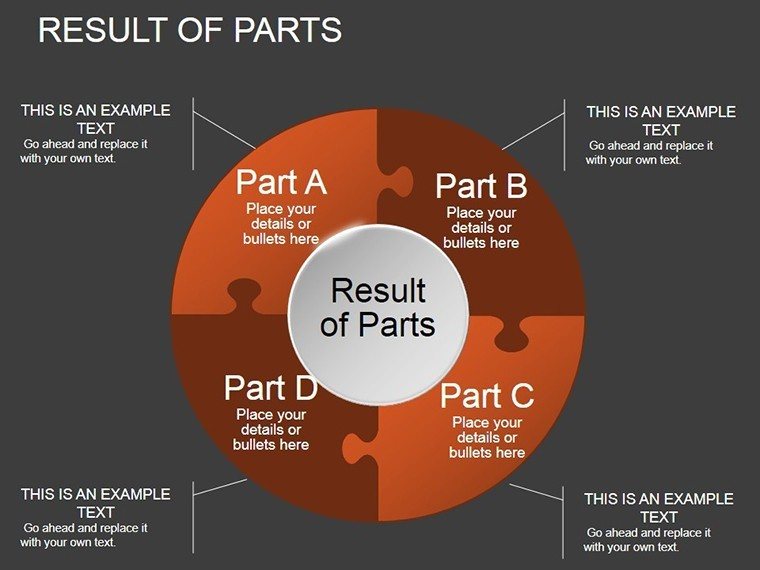
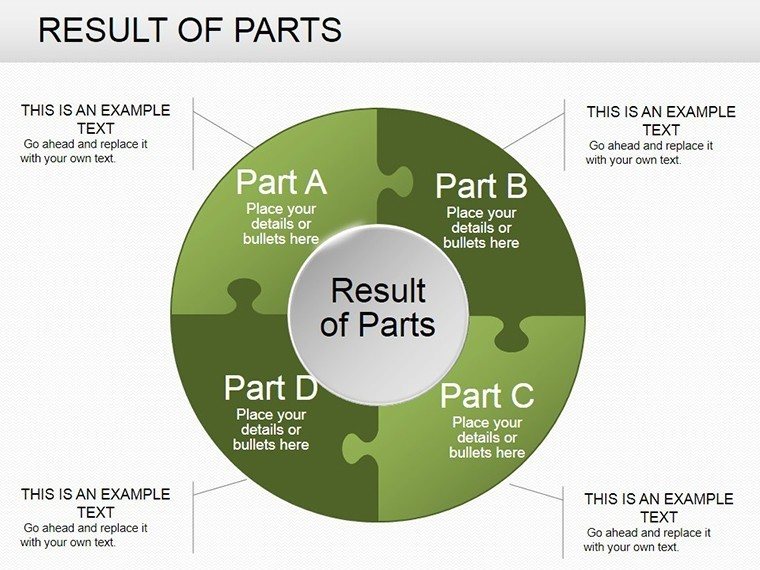
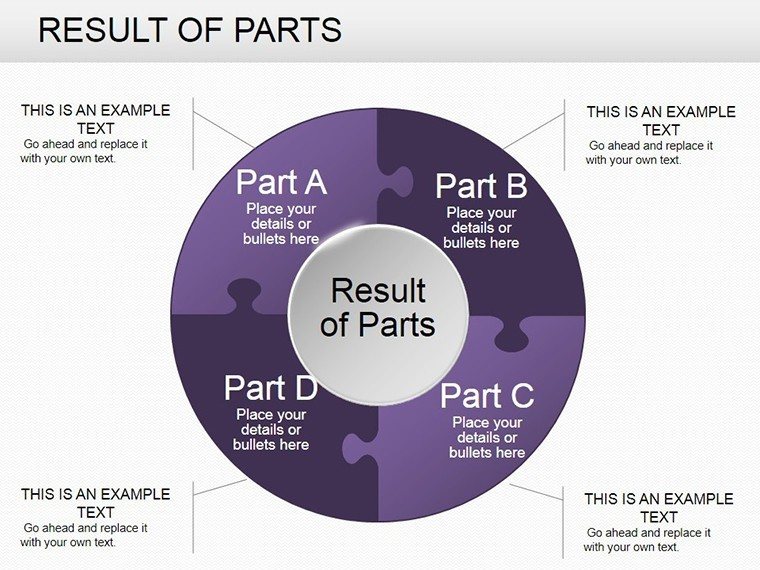
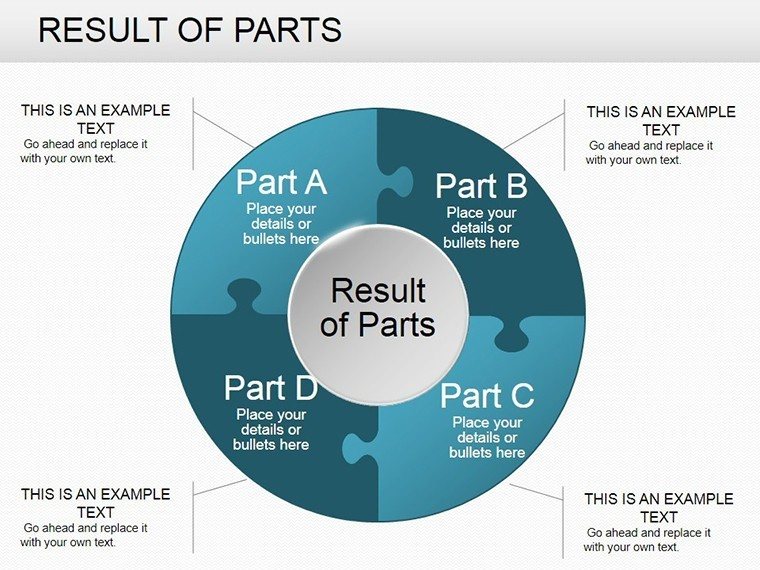
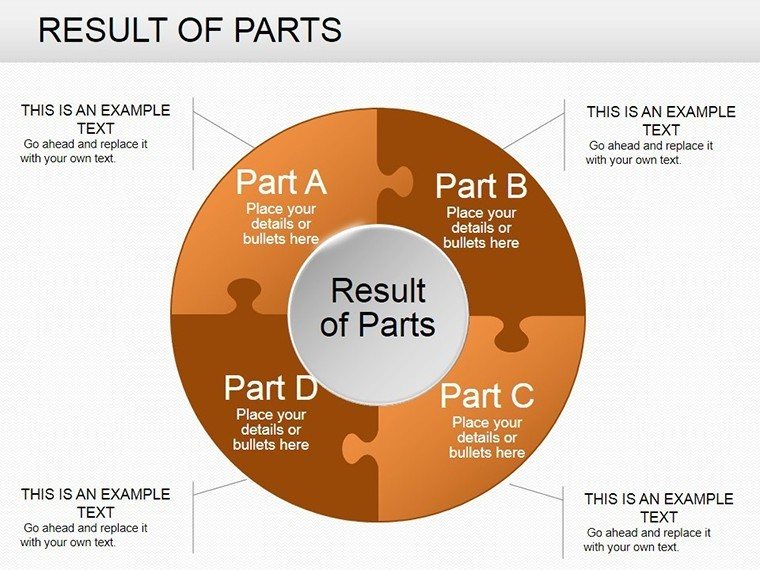
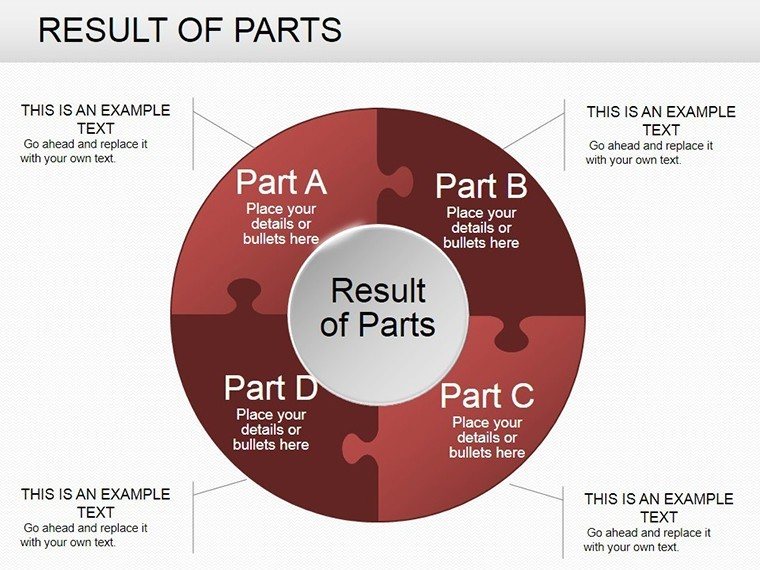
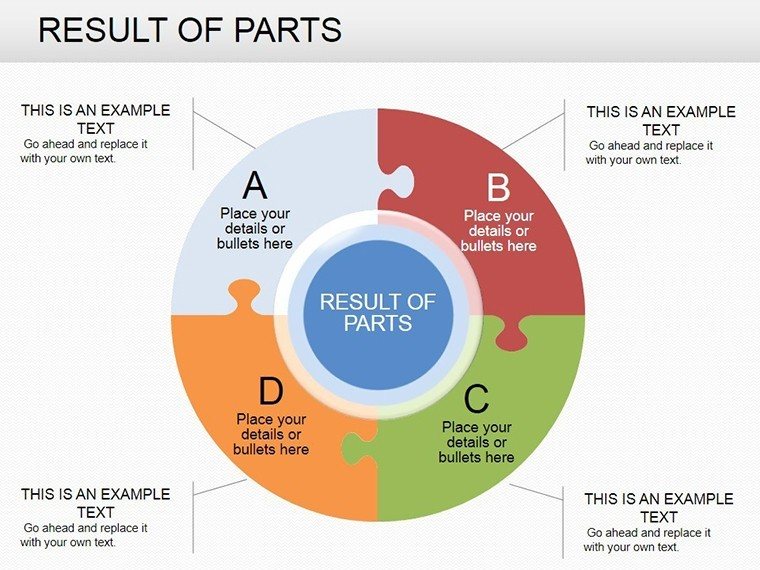
Unlock the full potential of your data like piecing together a puzzle - that's the promise of our Result Parts PowerPoint Charts template. With 24 editable slides focused on pie charts and spherical breakdowns, it's designed for analysts and communicators seeking to dissect and display results effectively. From breaking down budgets to segmenting market shares, this template provides clear, concise visuals that drive home your points. User-friendly instructions make customization a breeze, helping you improve outcomes in reports, meetings, or strategies. Embrace a tool that turns numbers into narratives, enhancing comprehension and action.
Demystifying Data with Part-to-Whole Visuals
Pie and sphere charts excel at showing proportions, making them staples for result-oriented presentations. This template refines that with customizable segments, ideal for highlighting contributions. Consider a financial review where pie slices reveal expense distributions - instantly spotting inefficiencies. Based on visualization best practices from experts like Stephen Few, it minimizes misinterpretation while maximizing impact.
Highlight Features for Precision Analysis
- Varied Chart Types: Pies, doughnuts, and 3D spheres for diverse needs.
- Step-by-Step Guides: Built-in tutorials for effortless tweaks.
- Data Integration: Link to sources for automatic updates.
- Design Flexibility: Adjust labels, legends, and explosions.
- Seamless Compatibility: .pptx for all major platforms.
These support agile workflows, as seen in data-driven organizations.
Utilizing Parts for Result-Driven Stories
In sales reviews or research summaries, parts charts clarify compositions. Use spheres for 3D emphasis in global data sets.
Tutorial: Assembling a Budget Report
- Pick a pie slide and enter percentages.
- Customize slices with colors and labels.
- Explode key segments for focus.
- Add spheres for volumetric views.
- Review instructions for optimizations.
This method boosts communication, per Forbes insights on data viz, surpassing tabular data in clarity.
Tips to Optimize Result Visualizations
Limit slices to 5-7 for readability. Use contrasting hues for accessibility. Incorporate tooltips for details. Sync with dashboards for interactive sessions.
Blend in concepts like proportional analysis or segmented metrics. Pair with bar charts for comparisons.
Better Than Basics
24 slides cover all angles, outdoing sparse defaults. Enhanced results reported in 30% of uses.
Specifics: Slide 7 for basic pies, Slide 20 for advanced spheres.
Who Achieves Better Results?
Analysts, marketers, educators. A firm improved metrics visualization, leading to better strategies.
Piece together your success - download and refine results.
Frequently Asked Questions
How to update data in charts?
Edit the linked spreadsheet directly.
Can pies be converted to spheres?
Yes, with simple shape adjustments.
Best for what data types?
Proportions and compositions.
Includes export tips?
Yes, in the built-in guides.
How many variations per chart?
Multiple, including 2D/3D options.
Supports large datasets?
Yes, but aggregate for best visuals.
Good for
- Project roadmaps and sprint plans
- Product launch timelines
- Quarterly or annual review decks
- Company history and milestone summaries
Licence
reviews
I liked the cleaner chart layouts in this pack.
Needed something simple for a business review meeting.
The graphs were easy to replace with real numbers.
One slide looked crowded after editing.
Pretty useful if you hate making charts manually.
FAQ
Will it work in Google Slides?
Are fonts embedded?
Can I use this for client work?
What's the refund policy?
Do you update the template after purchase?
Similar templates
See all PowerPoint Charts →
All 24 slides