 Click to zoom
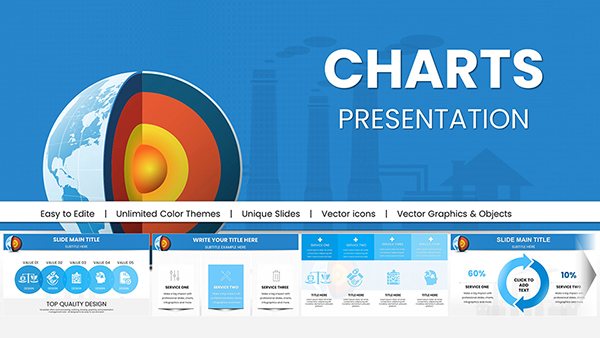
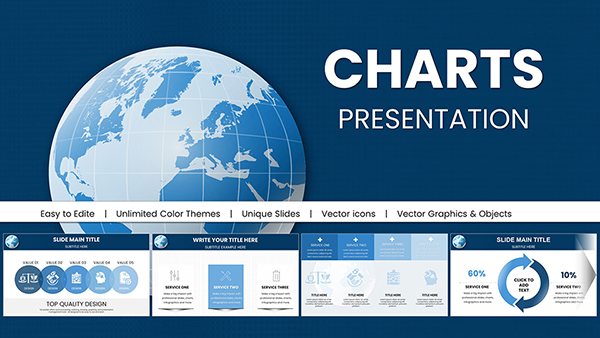
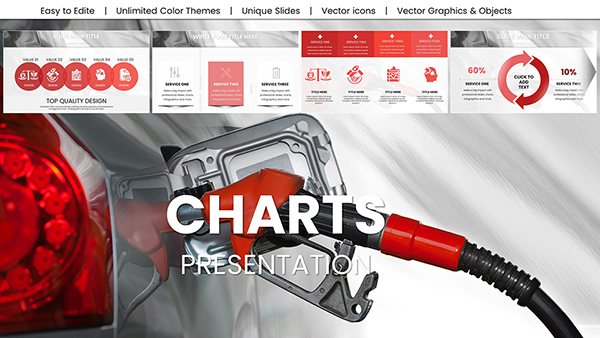
Protection, Economy, Market PowerPoint Charts Template: Navigate Market Dynamics
| Format | .pptx |
| Slides | 63 unique layouts |
| Aspect ratio | 16:9 |
| Compatibility | PowerPoint |
| Animated | No |
| Language | English |
| License | Commercial |
| File size | — |
| Version | v1.0 |
| Last updated | July 2023 |
What's inside
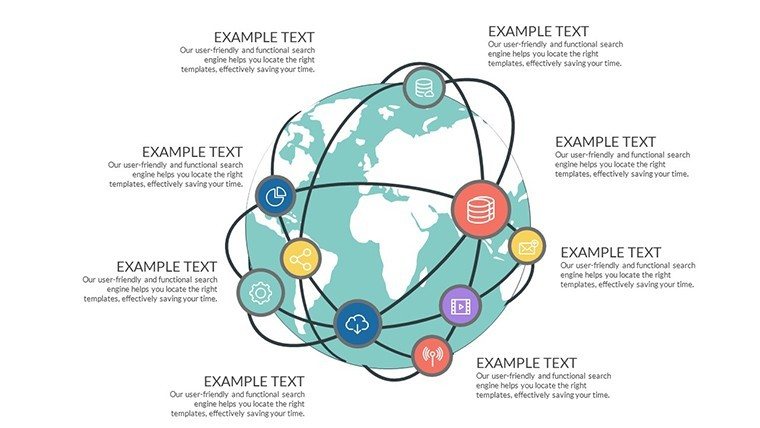
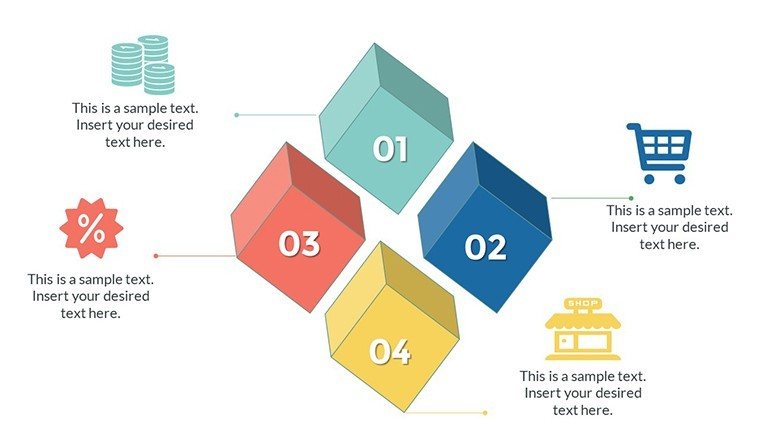
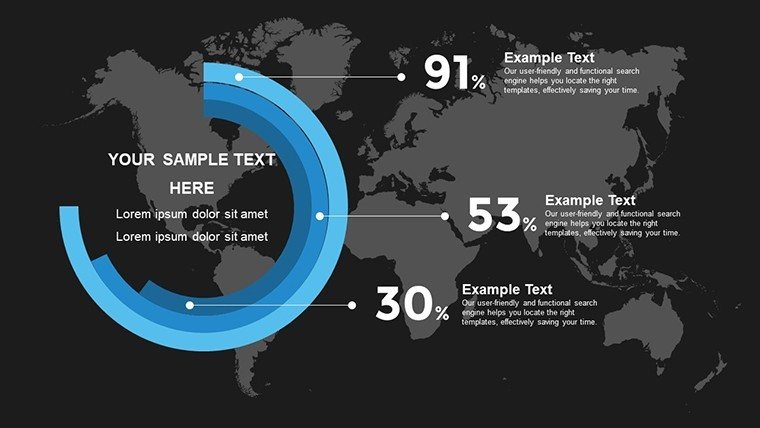
In an era of economic flux, understanding market protections, economies, and trends is crucial for informed strategies. The Protection, Economy, Market PowerPoint Charts Template provides a robust framework with 63 editable slides, blending cycle and relationship diagrams to dissect complex interactions. Consultants, marketers, and business pros will appreciate its depth for illustrating sales trends, financial forecasts, and protective measures in markets. This tool elevates presentations, turning data into strategic assets for pitches or reports.
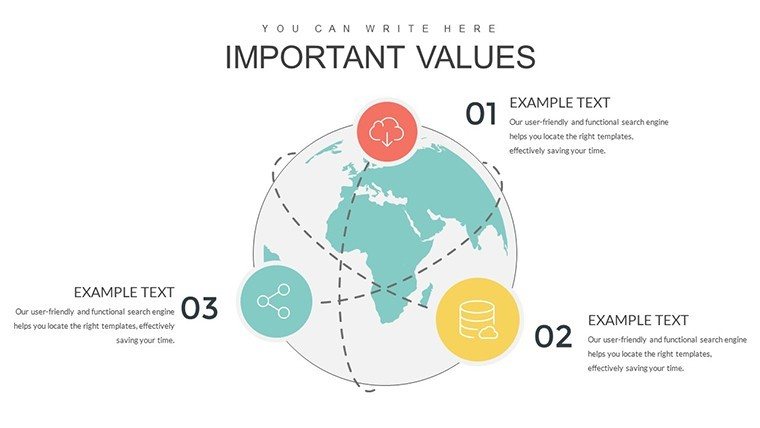
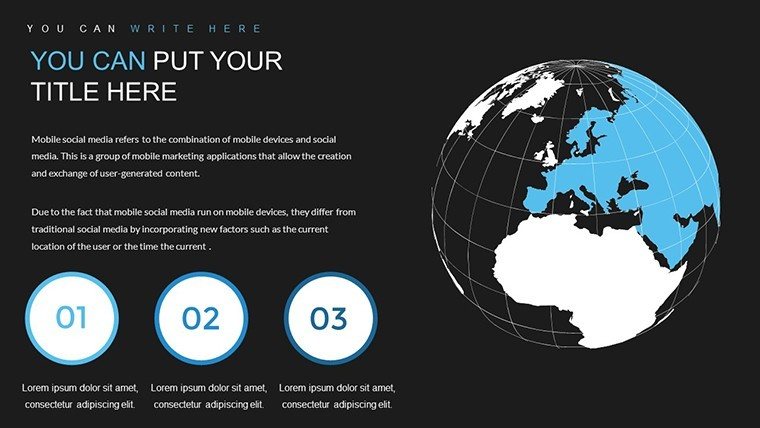
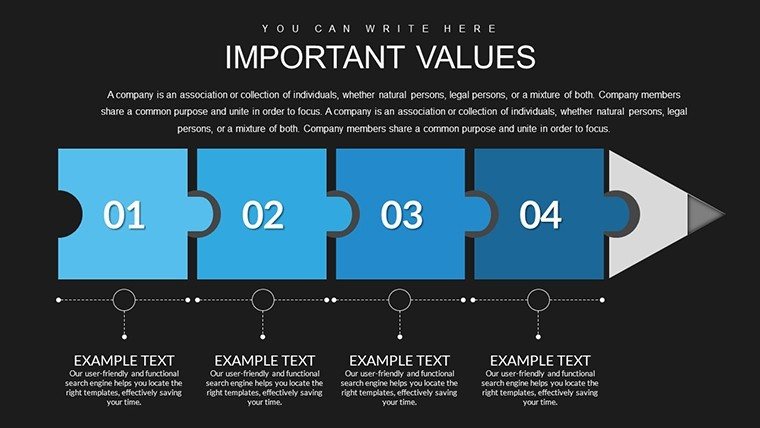
Imagine charting economic cycles on Slide 30, where relationships between protectionist policies and market growth are vividly linked, aiding in policy discussions or investor advisories. Fully compatible with PowerPoint and Google Slides, it offers convenience without compromising on customization.
Unraveling Cycle and Relationship Charts
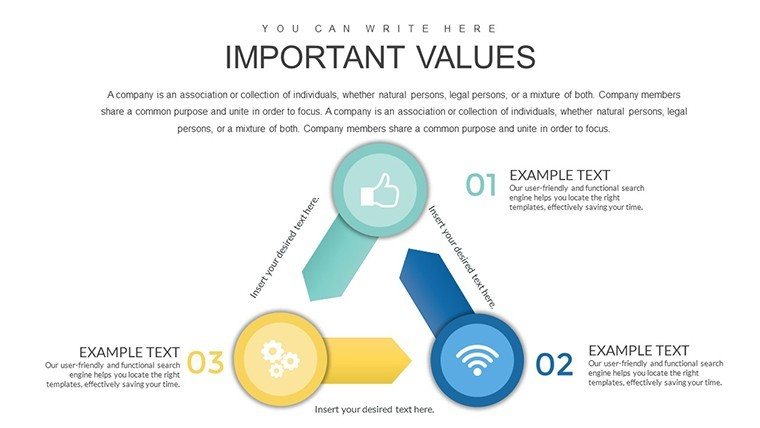
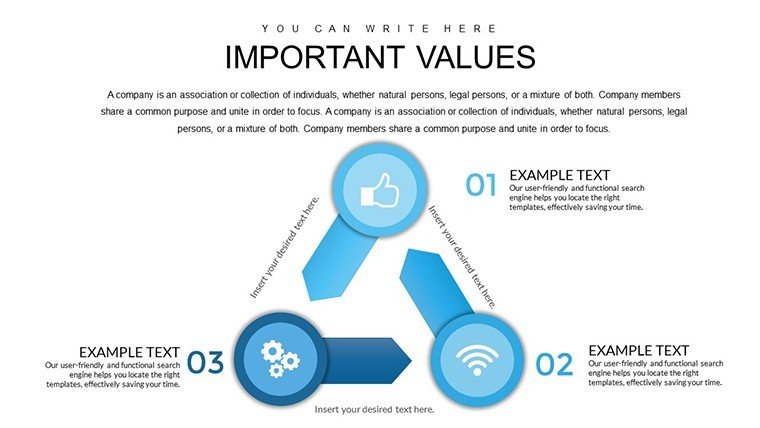
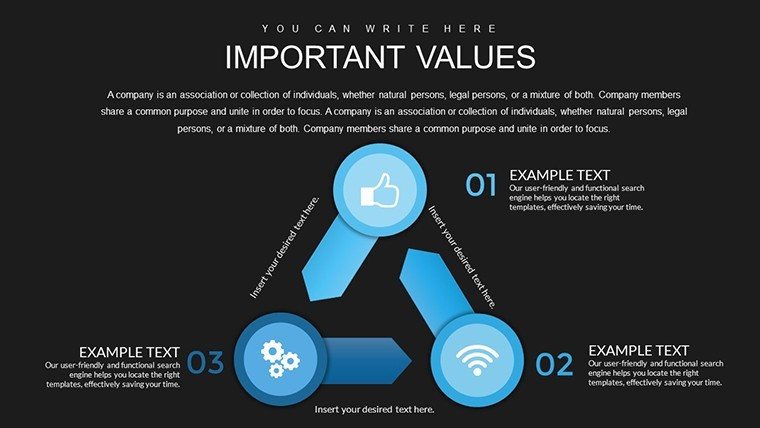
Cycle charts depict ongoing processes, while relationship ones highlight connections. This template fuses them for market analyses, enabling visuals of economic loops and interdependencies.
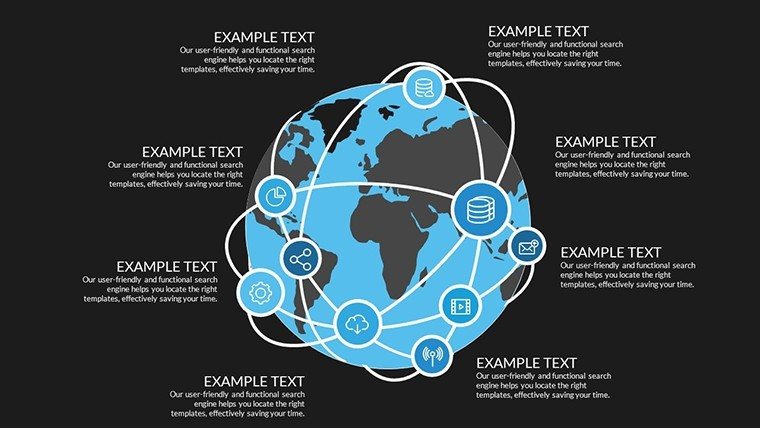
Slide 45's integrated diagram, for instance, maps economy-protection linkages, useful for segmentation studies.
Premier Features for Market Insights
- Extensive Customization: Edit all elements to fit specific narratives.
- Thematic Variety: Covers cycles, relationships for diverse applications.
- Professional Designs: Polished looks for credible presentations.
- Compatibility Assurance: Seamless across platforms.
- Visual Aids: Icons and trends for enhanced storytelling.
Aligned with economic modeling from sources like IMF reports, ensuring authoritative outputs.
Deployment in Market and Economy Contexts
Consultants can use Slide 10 for trend forecasts, predicting market shifts based on economic data.
Marketers segment audiences via relationship charts on Slide 25, optimizing campaigns.
In financial realms, protect strategies are visualized, aiding risk management.
Guide to Market Chart Creation
- Define Objectives: Identify key market elements to visualize.
- Select Diagrams: Choose cycle or relationship based on data.
- Input Insights: Populate with economic metrics.
- Customize for Impact: Adjust visuals for clarity.
- Iterate for Precision: Refine with stakeholder input.
This workflow supports thorough analyses.
Edge Over Generic Market Tools
With 63 slides, it dwarfs basics, offering specialized cycles not in standards.
Preferred for its depth in handling multifaceted market data.
Igniting Market Strategy Discussions
Charts that connect economies and protections spark innovative thinking.
Envision markets as interconnected webs - this template weaves the threads.
Insights for Optimal Market Presentations
- Balance complexity: Simplify for audience grasp.
- Use trends wisely: Highlight protections in economies.
- Narrate connections: Link data to real-world implications.
- Ensure scalability: For various screen sizes.
- Update dynamically: For current market conditions.
These tips maximize utility.
Equip yourself to master market narratives with this comprehensive template.
Frequently Asked Questions
How many editable slides?63, all fully customizable.Compatible with Google Slides?Yes, perfect integration.Suitable for economic forecasts?Ideal, with cycle and trend tools.File format?.pptx for versatility.Can I add custom icons?Yes, enhance with your elements.Good for
- Project roadmaps and sprint plans
- Product launch timelines
- Quarterly or annual review decks
- Company history and milestone summaries
Licence
reviews
Modern and fresh look that refreshed my entire slide deck.
Data replacement process is intuitive and fast.
This made preparing for investor calls less daunting.
Critical feedback minor - some fonts need consistency checks.
FAQ
Will it work in Google Slides?
Are fonts embedded?
Can I use this for client work?
What's the refund policy?
Do you update the template after purchase?
Similar templates
See all PowerPoint Charts →
All 63 slides