 Click to zoom
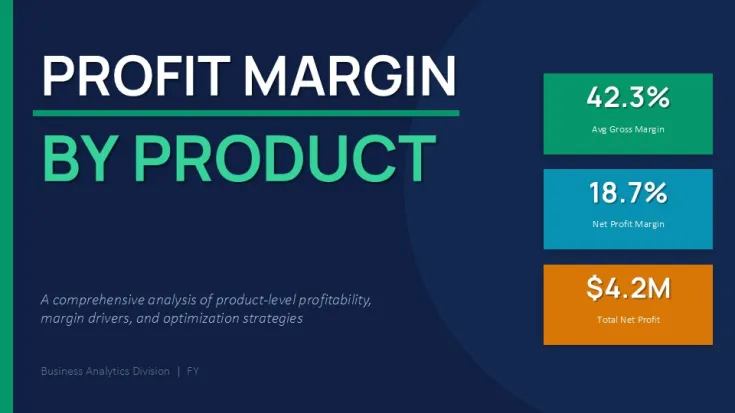
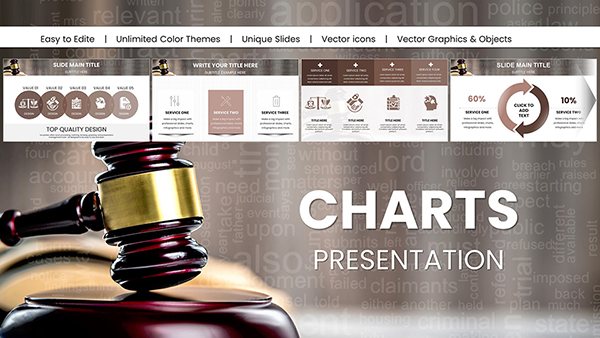
Profit Margin by Product Chart Template for PowerPoint
| Format | .pptx |
| Slides | 30 unique layouts |
| Aspect ratio | 130/73 |
| Compatibility | PowerPoint |
| Animated | No |
| Language | English |
| License | Commercial |
| File size | — |
| Version | v1.0 |
| Last updated | May 2026 |
What's inside
Quarterly financial reports and KPI tracking
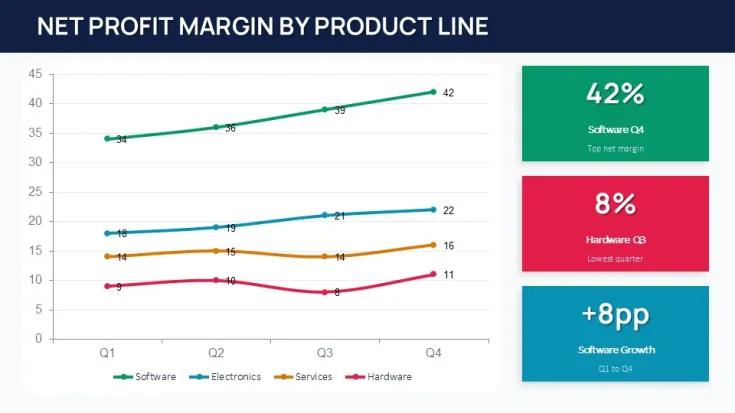
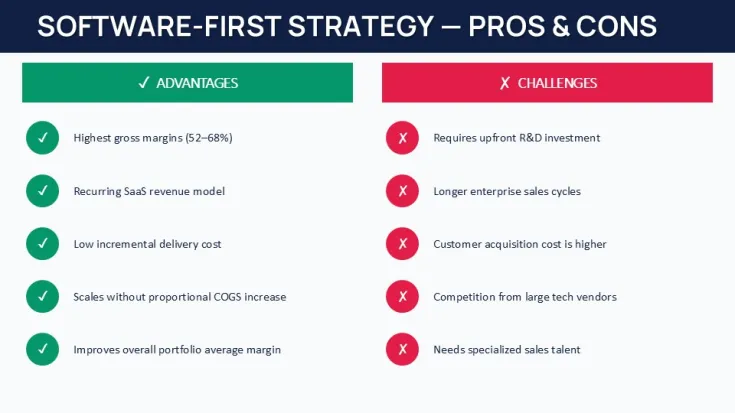
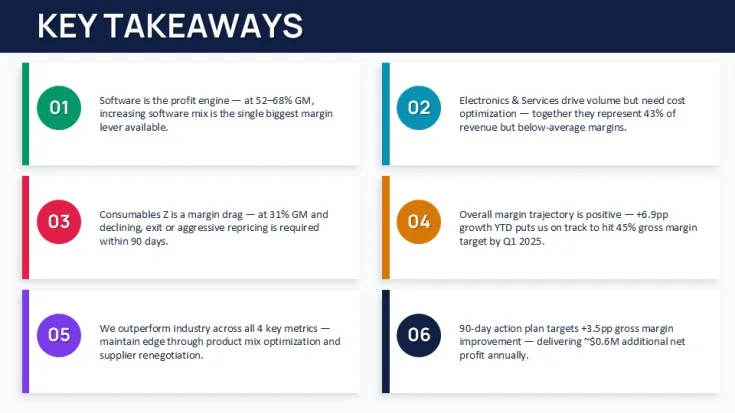
This 30-slide PowerPoint line chart template is built for quarterly reports, financial reviews, and KPI tracking. The layouts use consistent axis spacing and legend positioning, which remain aligned when you duplicate slides. Each chart placeholder links directly to Excel data tables, but you can also edit values manually inside PowerPoint.
Practical editing behavior
Resizing a chart group scales the plot area proportionally, but axis labels may need manual font adjustment if reduced below 70%. Color updates applied through Slide Master affect all line series simultaneously, except for individual series you have manually recolored. Duplicating a slide copies the default data range, not the current chart values -useful for creating multiple versions without resetting formatting.
Technical advantages
- Data labels reposition automatically when chart size changes.
- Legend entries remain editable even after unlinking Excel data.
- Gridline spacing preserves readability across 16:9 and 4:3 exports.
- No external fonts required - uses system-safe Arial and Calibri.
Specifications
SlidesFormatsAspect ratioEditable elementsColor methodCompatibility30PPTX, PPT16:9Chart data, line colors, axis labels, legend textSlide Master color themePowerPoint 2016 or newer (Windows/macOS)Frequently Asked Questions
Can I replace the sample data with my own Excel sheet?
Yes. Right-click the chart, select "Edit Data", then import from an existing Excel file. The chart maintains its visual formatting after data replacement.
Do line styles remain editable after exporting to PDF?
Line thickness and dash types are preserved as vectors in PDF export. Colors stay consistent with your current theme unless you flatten shapes manually.
Does this template work in Keynote?
Keynote imports PPTX files but converts charts to grouped shapes. Data linking is lost, but you can manually edit numbers inside Keynote's chart tool.
Good for
- Project roadmaps and sprint plans
- Product launch timelines
- Quarterly or annual review decks
- Company history and milestone summaries
Licence
reviews
Some of the financial ratios were pre-calculated which saved me time.
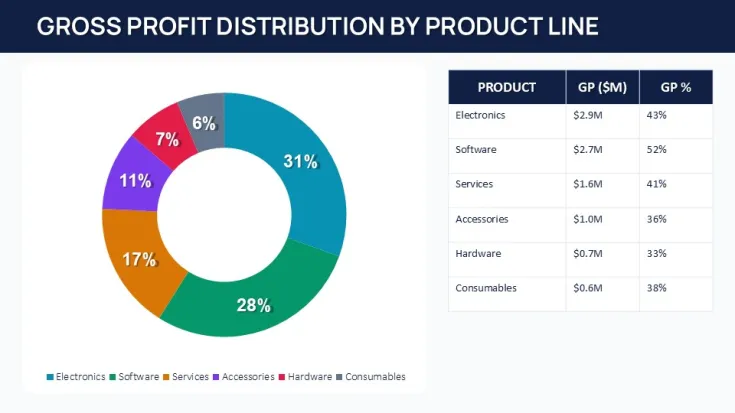
The revenue breakdown donuts are fine but the colors are a bit loud.
Used the EPS trend line, my CFO nodded so that's good.
Could use more sector-specific icons but overall it's solid.
Grabbed this for a quarterly earnings call, the waterfall chart was perfect.
FAQ
Will it work in Google Slides?
Are fonts embedded?
Can I use this for client work?
What's the refund policy?
Do you update the template after purchase?
Similar templates
See all PowerPoint Charts →


All 30 slides