 Click to zoom
Process Puzzle Pie PowerPoint Charts Template
| Format | .pptx |
| Slides | 31 unique layouts |
| Aspect ratio | 130/73 |
| Compatibility | PowerPoint |
| Animated | No |
| Language | English |
| License | Commercial |
| File size | — |
| Version | v1.0 |
| Last updated | December 2025 |
What's inside
In high-stakes boardroom discussions or detailed strategy sessions with enterprise clients, I`ve repeatedly seen how standard pie charts fall short when explaining multifaceted processes where every segment must interlock seamlessly with the others. That`s precisely where the Process Puzzle Pie PowerPoint Charts Template excels - it transforms ordinary proportional data into dynamic visuals that highlight dependencies and integrations, making complex workflows immediately graspable for executives and teams alike.
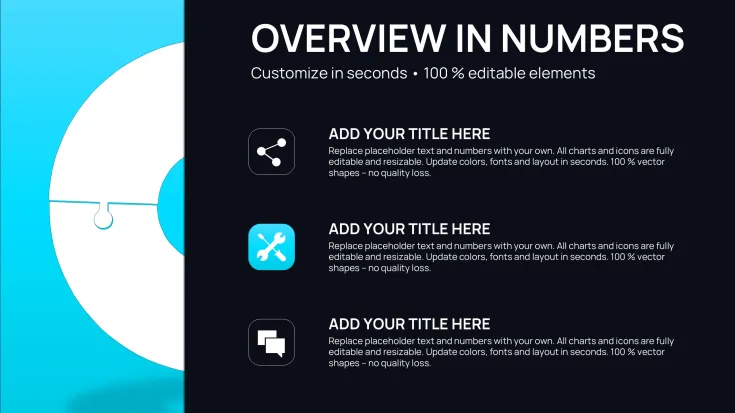
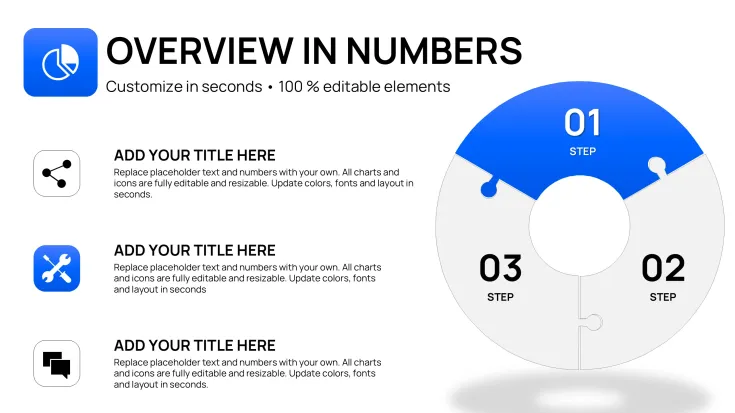
This specialized collection delivers 32 fully editable slides centered on interlocking puzzle pie designs, allowing you to illustrate how individual elements contribute to and connect within a larger system. Whether mapping out operational cycles or demonstrating resource allocations that rely on mutual support, these charts convey cohesion and interdependence far more effectively than traditional formats.
Professionals who build decks under tight deadlines appreciate the immediate impact: stakeholders quickly recognize how parts align to drive overall success, leading to faster alignment and decisive action in meetings.
Exploring the Interlocking Puzzle Pie Layouts
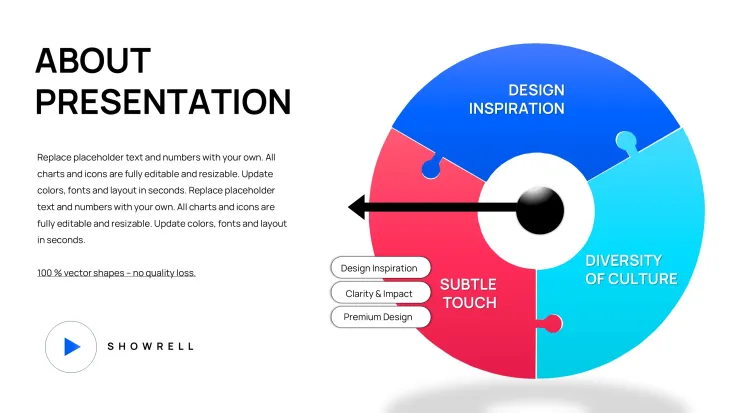
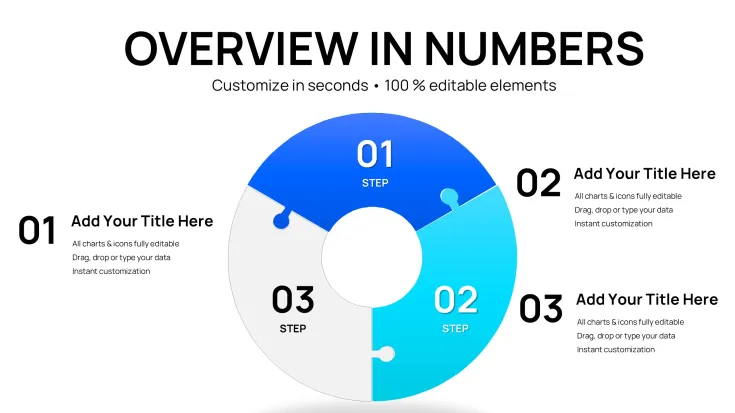
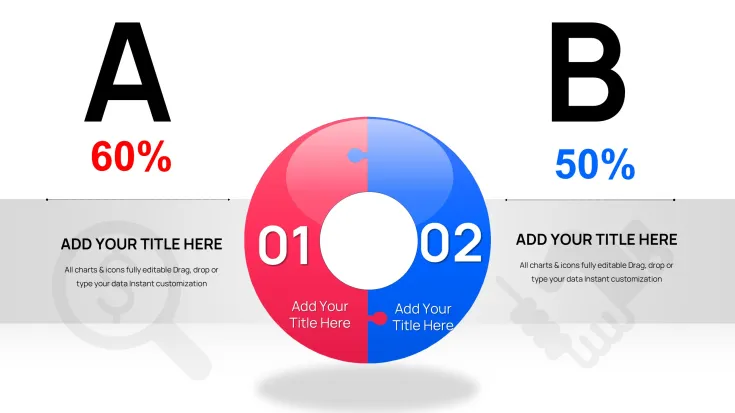
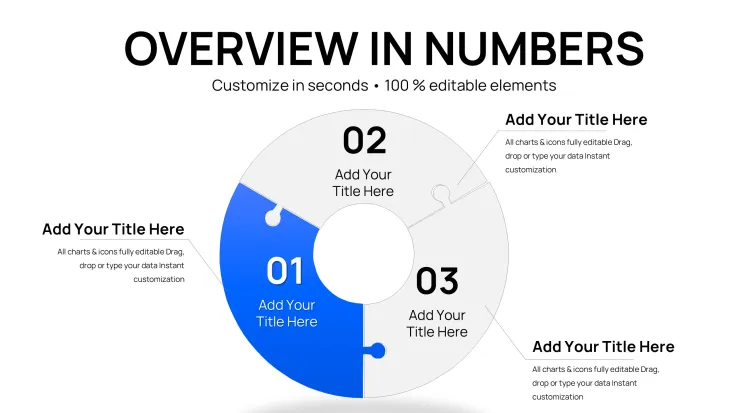
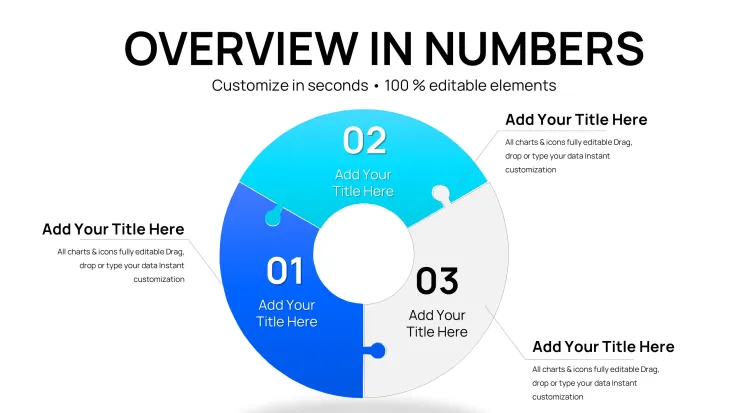
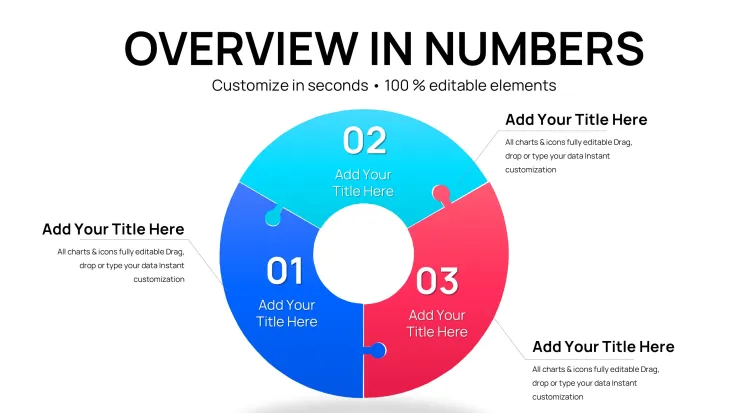
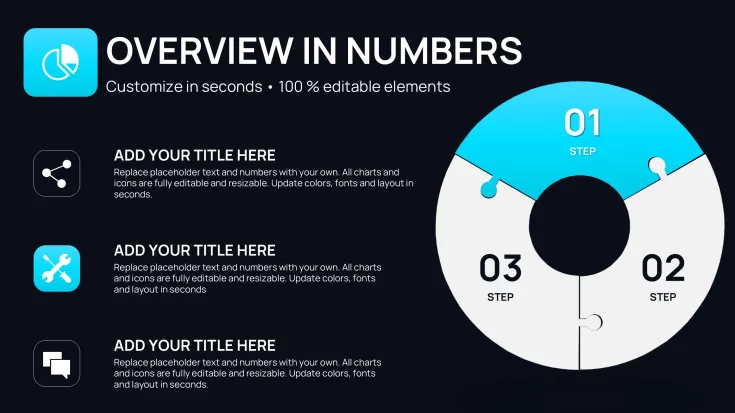
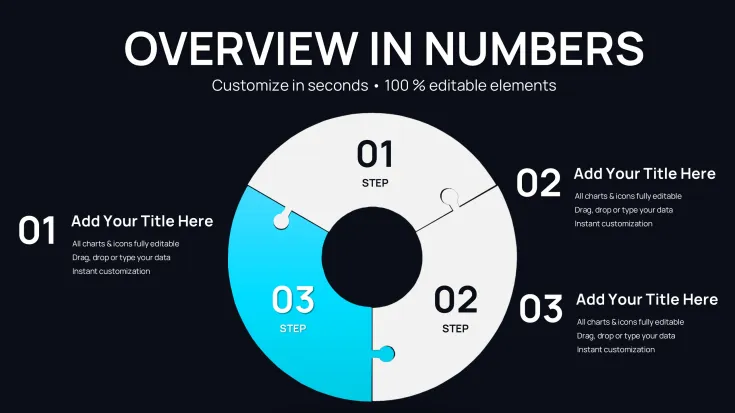
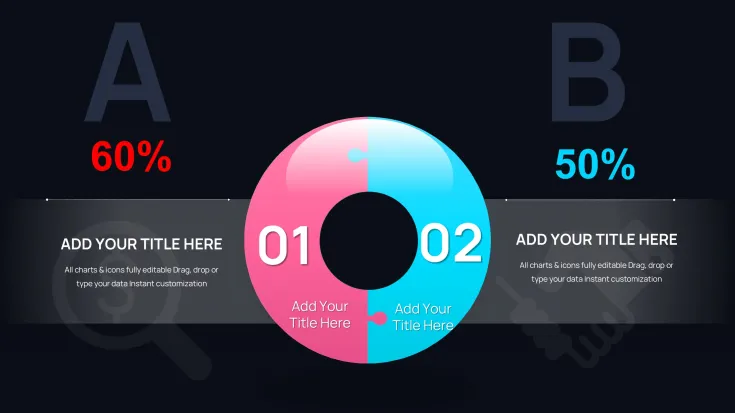
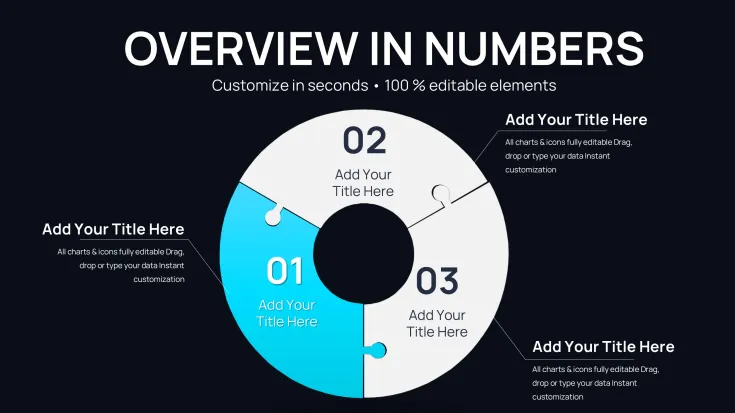
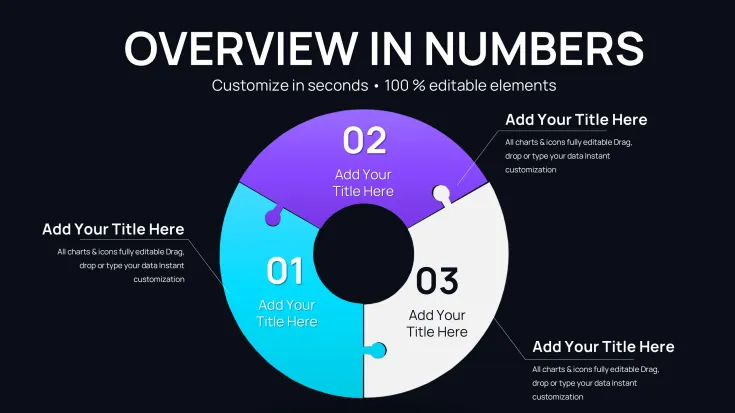
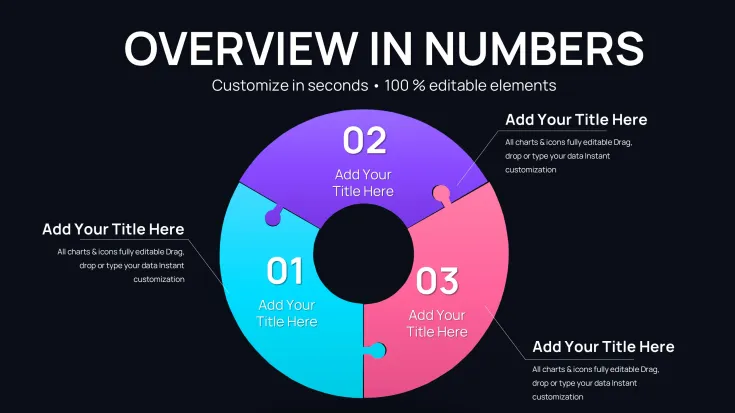
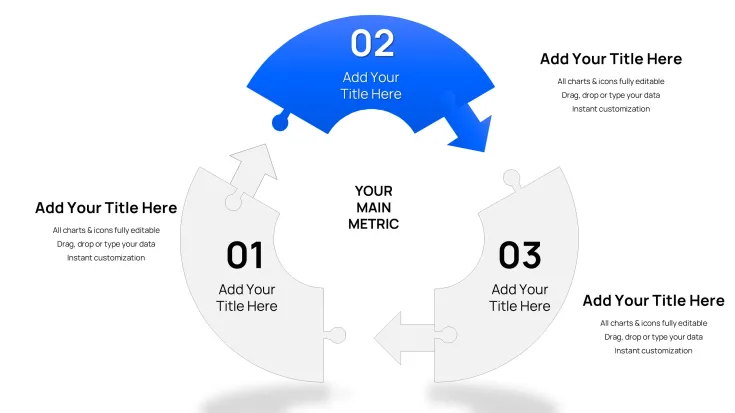
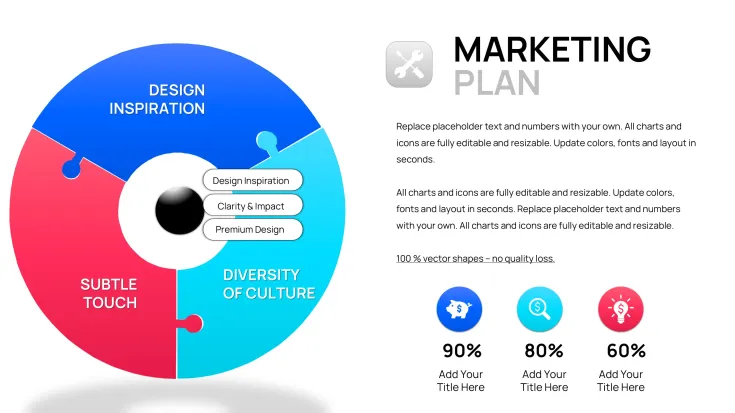
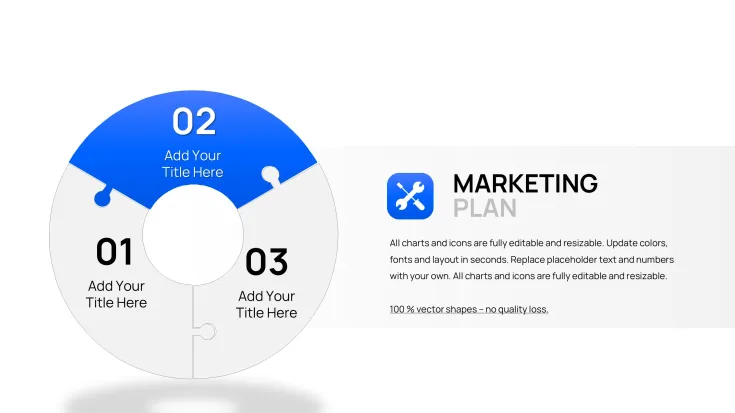
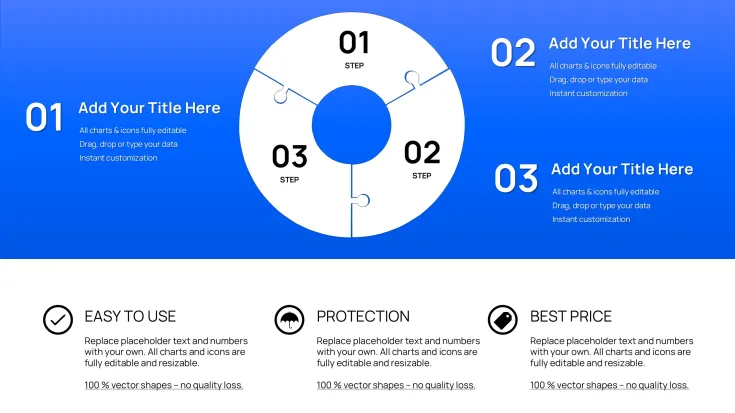
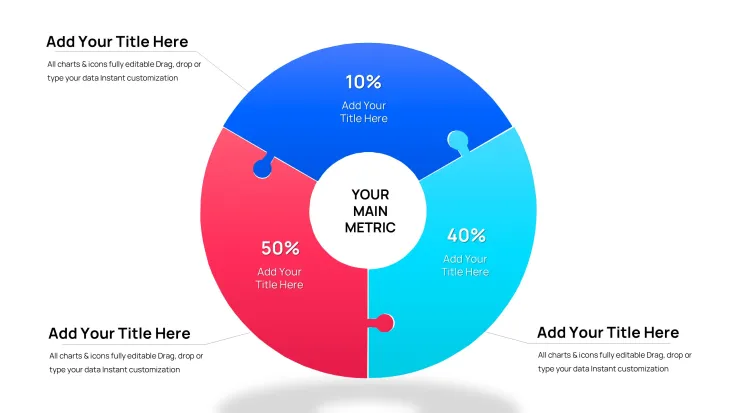
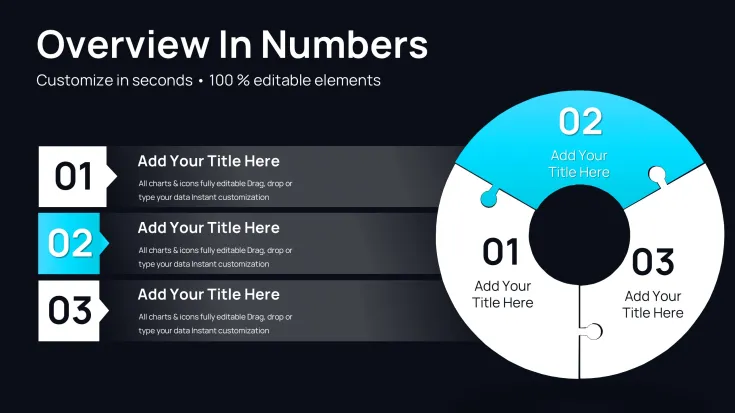
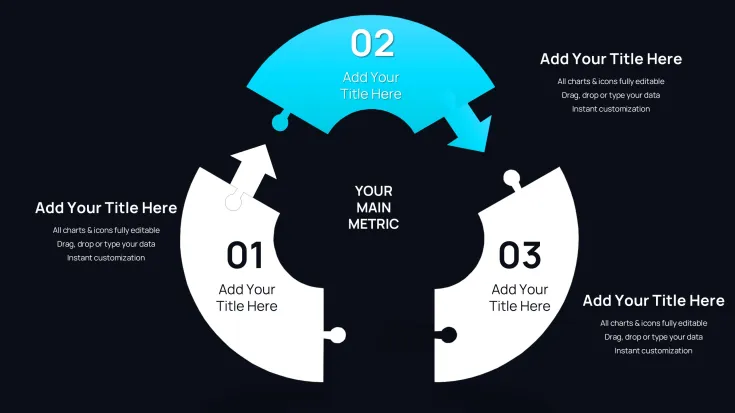
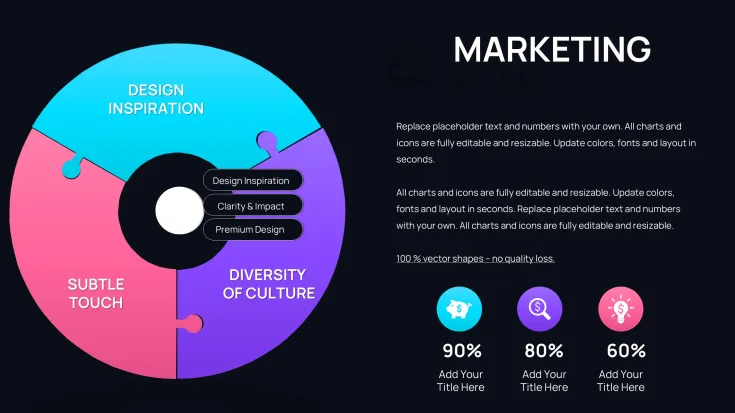
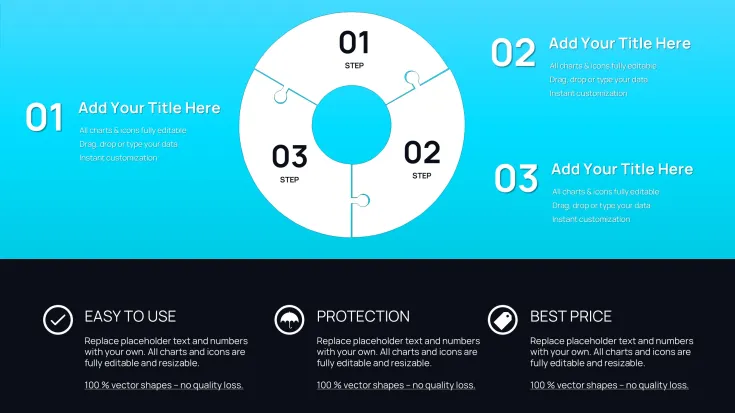
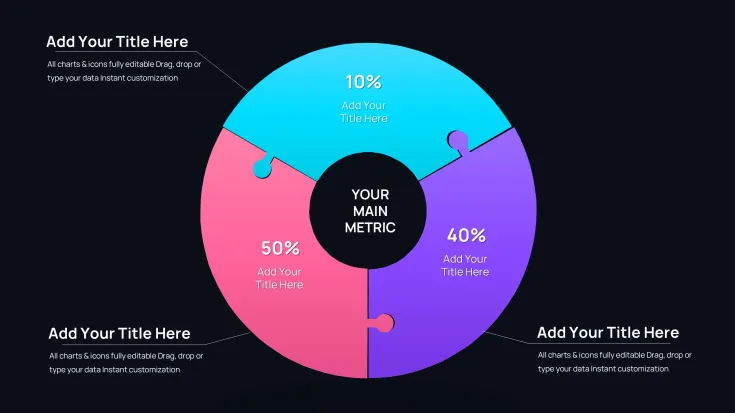
At the core of this template are variations of puzzle pie charts where each segment features jagged edges that visually snap into adjacent pieces, reinforcing the message of interconnected contributions.
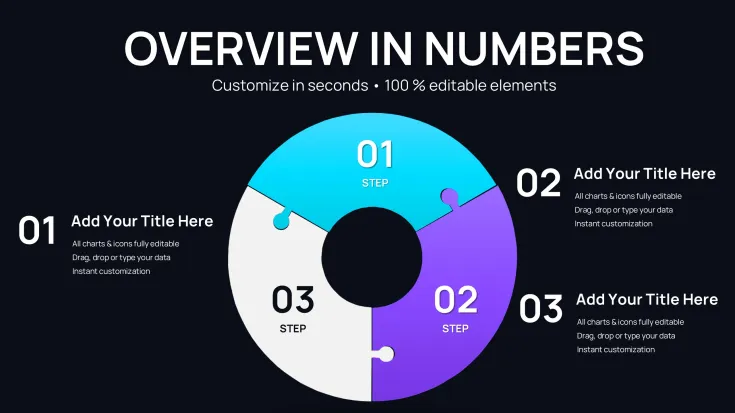
- Core single-view slides: Present a complete circular puzzle pie with 4-8 segments, ideal for overviews where you label each piece with key process stages and add percentage values directly on the interlocking areas.
- Progressive build slides: Layer segments one by one, perfect for walking through how initial components enable subsequent ones in sequential operations.
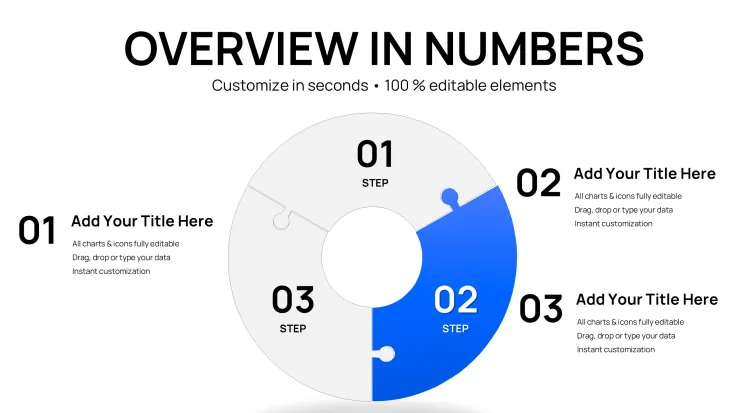
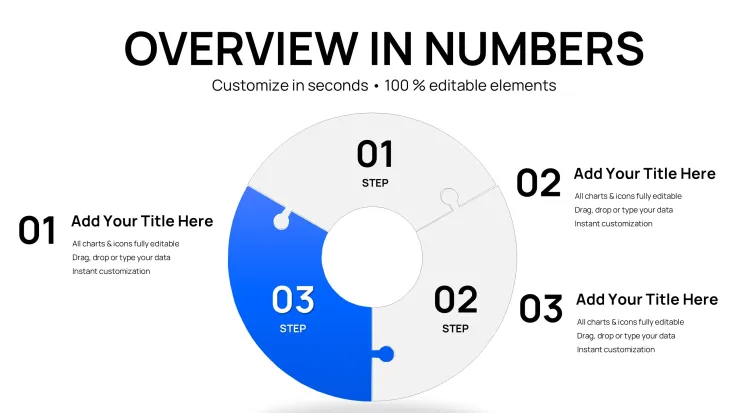
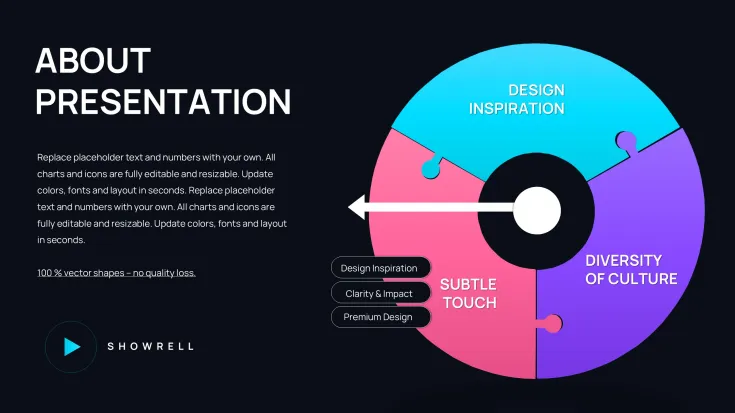
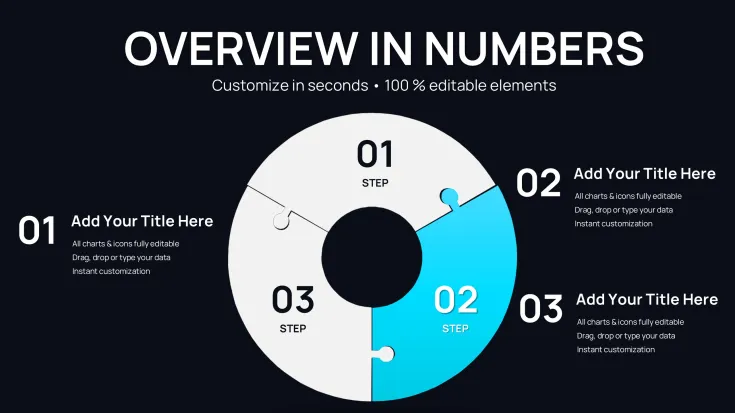
- Highlighted focus variants: Pull out specific puzzle pieces while dimming others, directing attention to critical dependencies or bottlenecks during reviews.
- Multi-chart combinations: Pair the puzzle pie with supporting text boxes or icons placed in the center to summarize the unified outcome.
Every element remains fully customizable - you adjust colors to match brand guidelines, resize segments proportionally, and modify edge patterns for emphasis, all within native PowerPoint tools.
Real-World Applications in Professional Settings
During quarterly operational reviews for manufacturing clients, I`ve used interlocking puzzle pie designs to map supply chain stages, showing how procurement, production, and distribution segments must align perfectly to avoid disruptions.
In consulting engagements with tech firms, these charts effectively depict ecosystem partnerships, illustrating how vendor contributions interlock to form a robust product delivery framework.
Government agencies presenting policy implementation plans benefit from the visual metaphor, clarifying how regulatory, funding, and execution pieces connect to achieve program objectives.
Educators facilitating workshops on systems thinking rely on these layouts to demonstrate feedback loops in organizational structures, helping participants visualize mutual reinforcements.
Seamless Integration into Your Presentation Workflow
This template slots directly into existing decks without disrupting flow. Import the .pptx file, copy selected slides, and populate with your data - the interlocking mechanics update automatically.
Compatibility extends across PowerPoint 2016 and later versions, with smooth performance in Keynote and Google Slides after minor adjustments. Editing takes minutes: select segments, input values via the data table, and refine labels for clarity.
For time-pressed professionals preparing for investor updates or internal audits, starting with these ready layouts cuts preparation time significantly while elevating visual sophistication.
Practical Scenarios from Client Decks
A startup founder pitching to venture partners once used a central puzzle pie slide to outline how marketing, development, and sales efforts interlock to accelerate growth trajectories.
Project managers in enterprise settings highlight resource allocation across departments, using pulled-out segments to discuss adjustments needed for optimal fit.
Training facilitators in corporate programs depict team role interdependencies, fostering discussions on collaboration gaps.
Analysts reporting on market share dynamics show how competitive segments connect within industry ecosystems, providing clear insights for strategic planning.
Advantages Over Alternative Approaches
AspectThis Puzzle Pie TemplateDefault PowerPoint ChartsBuilding from ScratchVisualizing InterdependenciesBuilt-in interlocking edges clearly show connectionsFlat segments lack integration cuesRequires manual shape alignment and groupingSetup TimeMinutes to populate dataBasic but generic appearanceHours for custom puzzle effectsProfessional PolishConsistent, modern interlocking design across 32 slidesLimited styling optionsInconsistent results without advanced skillsAudience ImpactImmediate grasp of systemic relationshipsProportional view onlyVariable quality distracts from messageThe structured interlocking approach ensures your message about connected components lands decisively.
Industry-Specific Implementations
In finance teams, puzzle pie charts map risk mitigation layers, showing how compliance, monitoring, and response segments interlock for comprehensive coverage.
Technology product managers illustrate feature roadmaps, with segments representing modules that must integrate flawlessly.
Healthcare administrators outline patient journey stages, emphasizing handoffs between departments.
Marketing leads depict campaign elements, from awareness to conversion, highlighting required alignments.
Consultants delivering transformation plans use these visuals to convey change initiative interconnections across organizational silos.
Download the Process Puzzle Pie PowerPoint Charts Template today and bring clarity to your interconnected process presentations.
Frequently Asked Questions
How do I edit the interlocking segments in this puzzle pie template?
Select the chart, access the data sheet to input your values and labels - the segments automatically resize and maintain puzzle edges. Adjust individual colors or pull out pieces via right-click format options for emphasis.
Can these puzzle pie charts handle more than eight segments?
Yes, several slides support up to 10-12 segments while preserving clear interlocking visuals; for denser data, use progressive reveal slides to maintain readability.
Is this template suitable for showing sequential processes?
Absolutely - dedicated slides allow numbered or arrow-enhanced segments to indicate flow direction while retaining the puzzle fit metaphor for overall cohesion.
Does it work in Google Slides or Keynote?
The native .pptx format performs best in PowerPoint 2016+, but imports cleanly into Google Slides and Keynote with puzzle elements intact after minor regrouping if needed.
Are animations included for building the puzzle pie?
Select slides feature entrance animations that assemble pieces sequentially, helping control pacing when explaining process interdependencies.
With instant access to these specialized interlocking designs, elevate your next process-focused deck confidently.
Good for
- Project roadmaps and sprint plans
- Product launch timelines
- Quarterly or annual review decks
- Company history and milestone summaries
Licence
reviews
The chart layouts saved me a lot of time during reporting week.
I liked how easy it was to replace the sample numbers.
Some pages had too many grid lines for my taste.
Used this for an analytics meeting and it worked fine.
The graphs looked clear even on a projector.
FAQ
Will it work in Google Slides?
Are fonts embedded?
Can I use this for client work?
What's the refund policy?
Do you update the template after purchase?
Similar templates
See all PowerPoint Charts →

All 31 slides