 Click to zoom
Precision in Every Pixel: Six Sigma Keynote Charts for Peak Performance
| Format | .pptx |
| Slides | 20 unique layouts |
| Aspect ratio | 16:9 |
| Compatibility | PowerPoint |
| Animated | No |
| Language | English |
| License | Commercial |
| File size | — |
| Version | v1.0 |
| Last updated | July 2023 |
What's inside
In the pursuit of perfection, where does your data story begin? With the Six Sigma Keynote Charts Template, that's where - 20 expertly curated, editable slides that distill process excellence into visuals as sharp as a lean engineer's flowchart. Crafted for business pros, educators, and students chasing DMAIC mastery, this template bridges theory and triumph, making complex methodologies accessible and awe-inspiring.
Rooted in Six Sigma's DMAIC (Define, Measure, Analyze, Improve, Control) pillars, infused with pie charts and business model diagrams, it's your ally for quality quests. Keynote core with PowerPoint adaptability ensures versatility, while pro-level customizations let you own the narrative - from color-coded defect analyses to streamlined value streams.
The Six Sigma Advantage: Why These Charts Command Attention
Six Sigma isn't buzz; it's billions saved in efficiencies. Our template embodies that with infographics that clarify chaos, turning sigma levels into strategic spotlights. Benefits? Defect-free decks that persuade C-suites, teach concepts vividly, and scale projects flawlessly.
- Expert Craftsmanship: Designed by Six Sigma Black Belts, aligning with ASQ standards for authentic, impactful visuals.
- Boundless Tweaks: Fonts, layouts, hues - all yours to mold for brand synergy or classroom whimsy.
- Infographic Arsenal: Pies for variance breakdowns, graphs for trend tracking, diagrams for process maps.
A manufacturing firm slashed waste 22% post-Six Sigma pitch using these charts - real results from visualized rigor, as chronicled in Quality Digest case studies.
Exploring the 20 Slides: Layers of Lean Genius
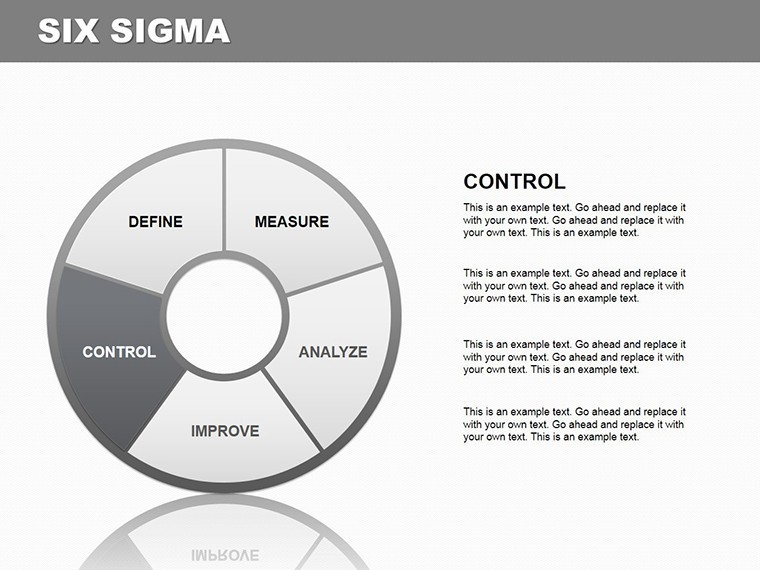
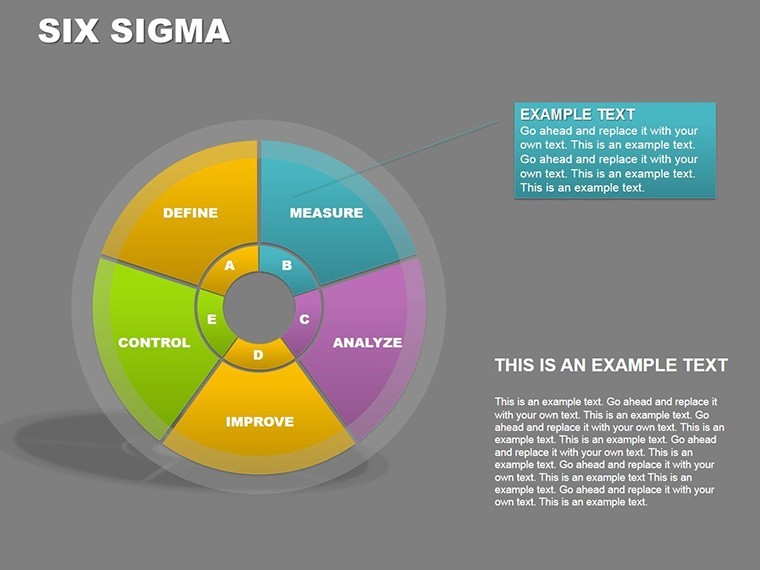
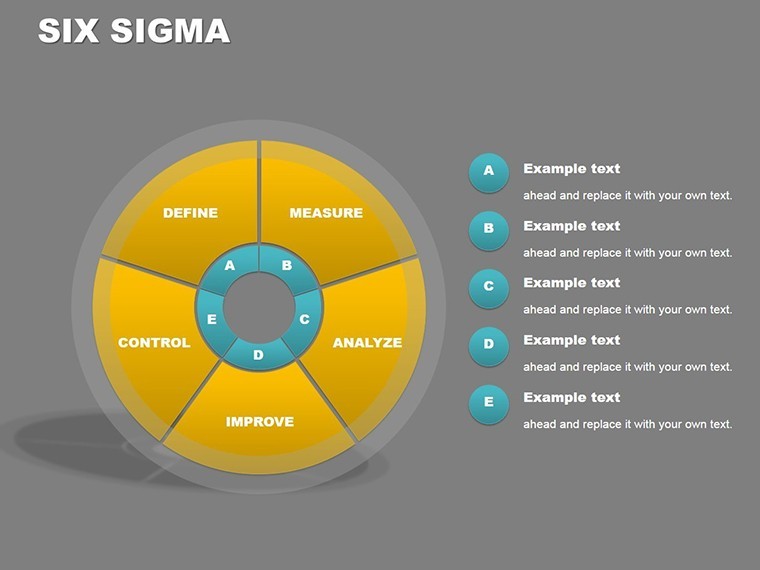
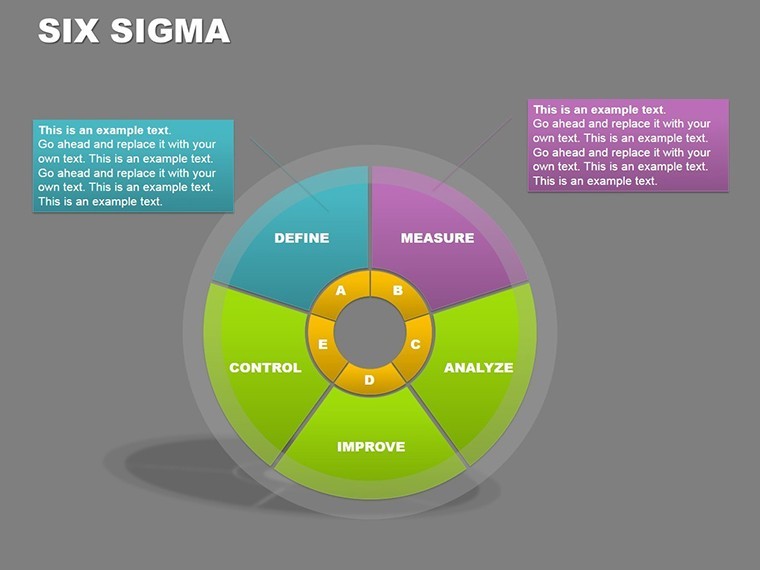
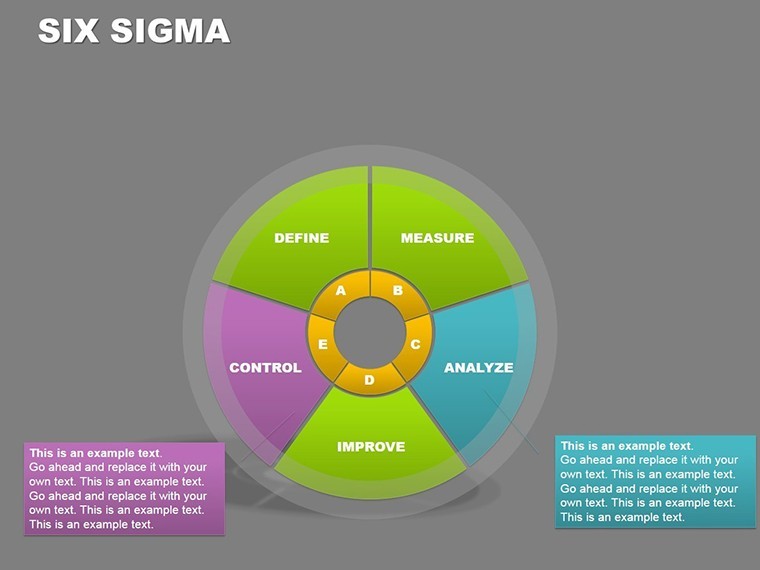
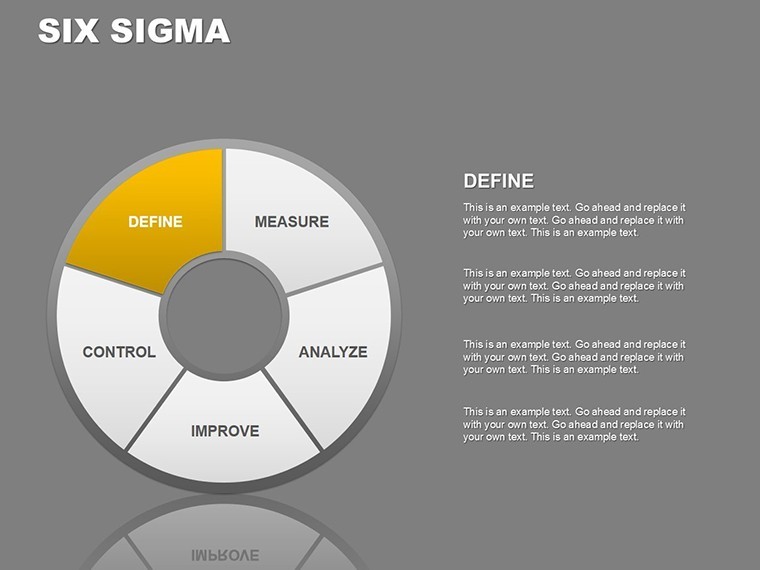
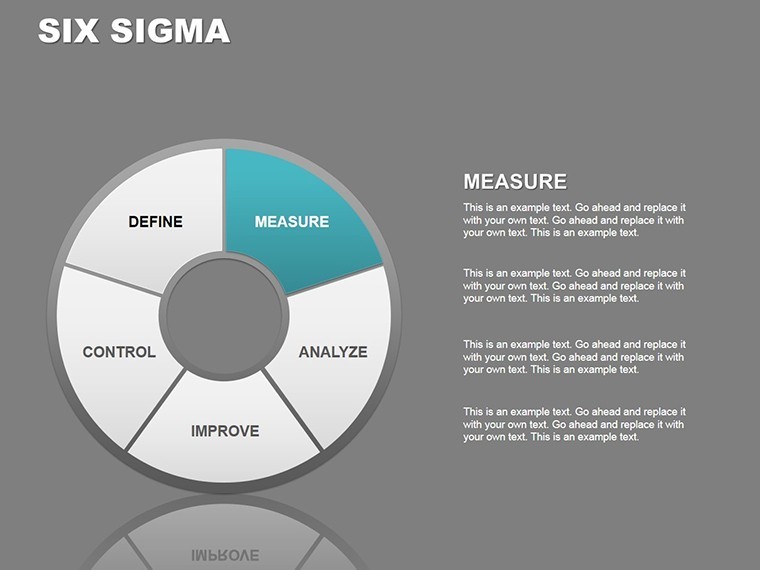
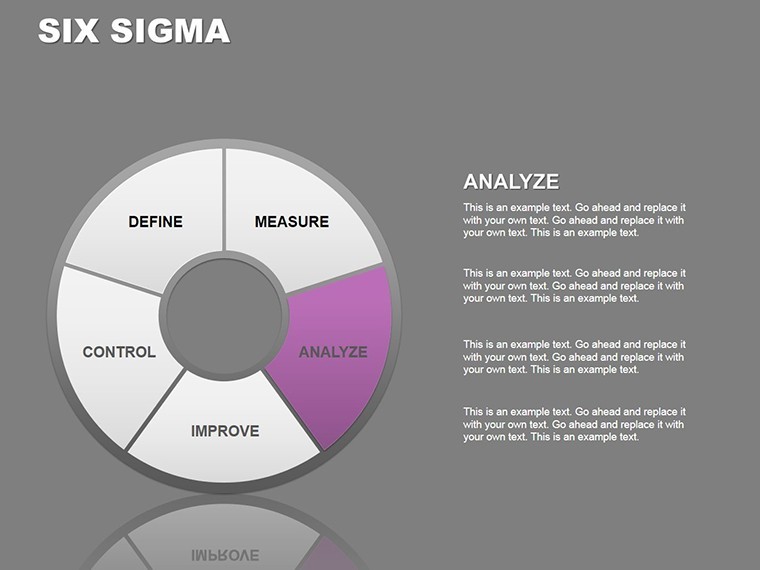
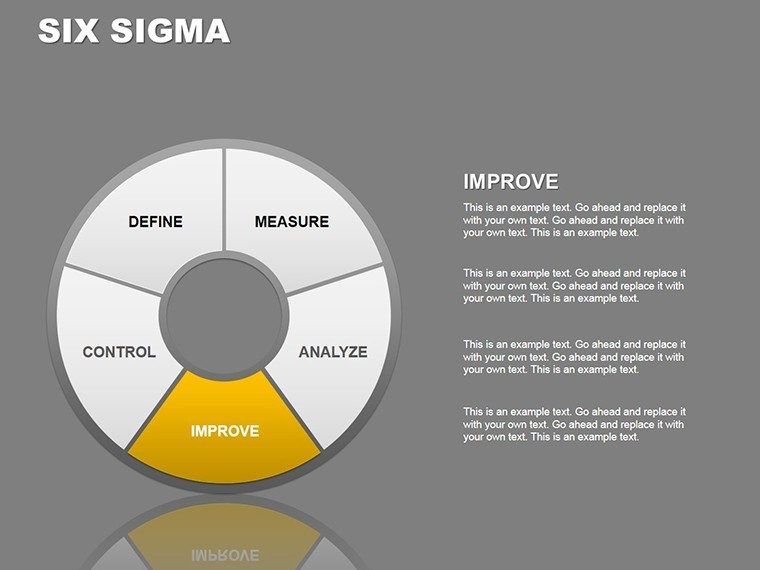
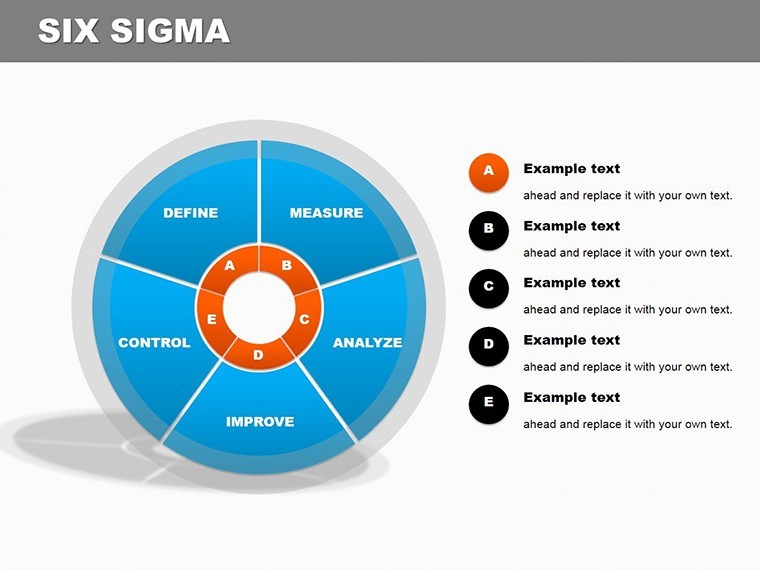
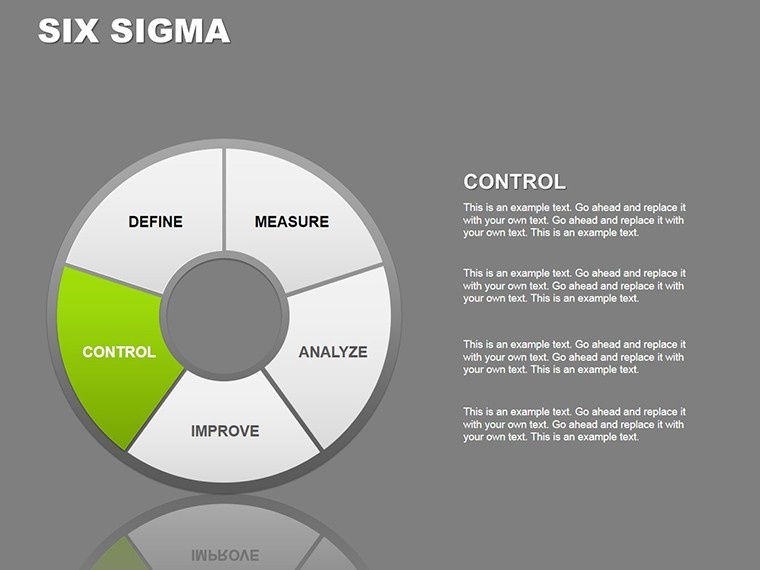
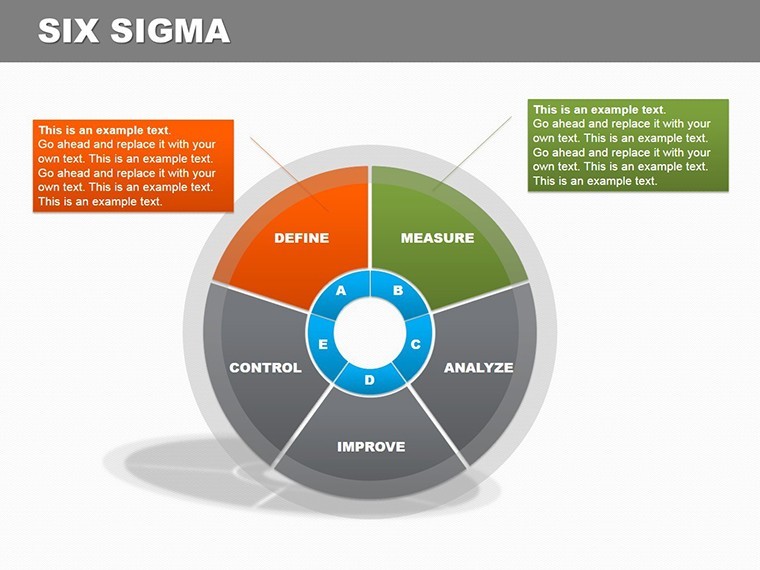
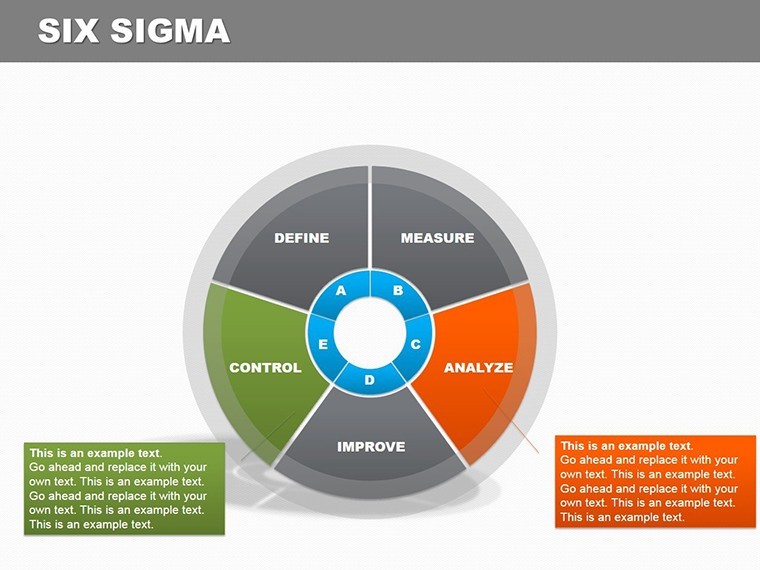
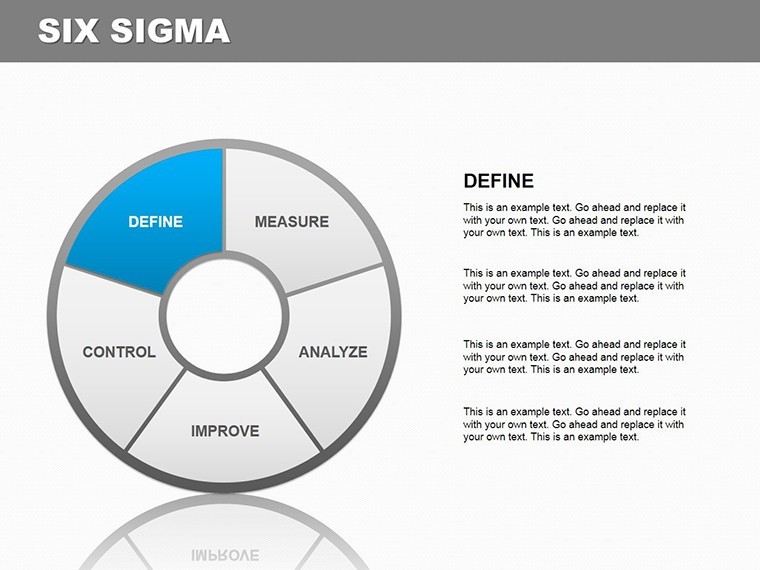
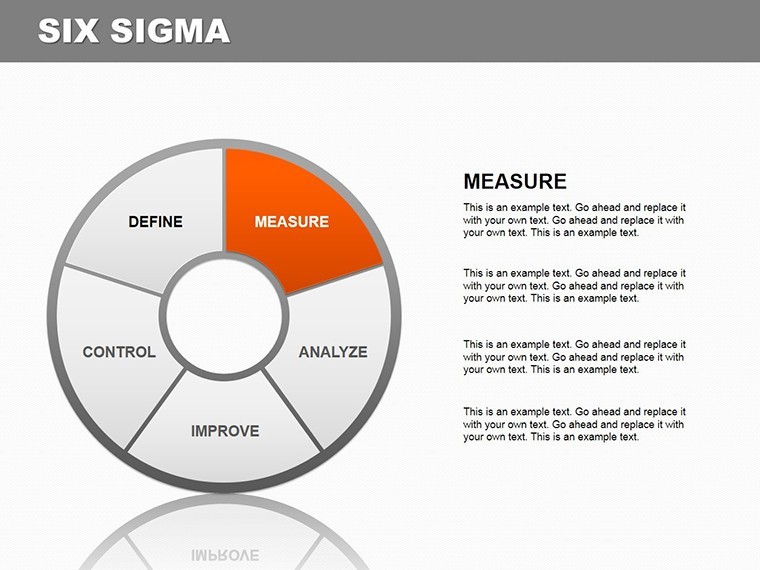
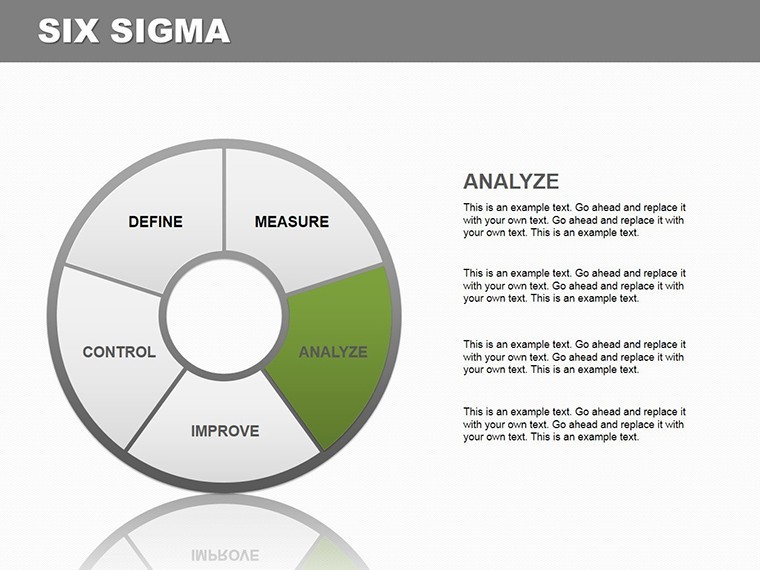
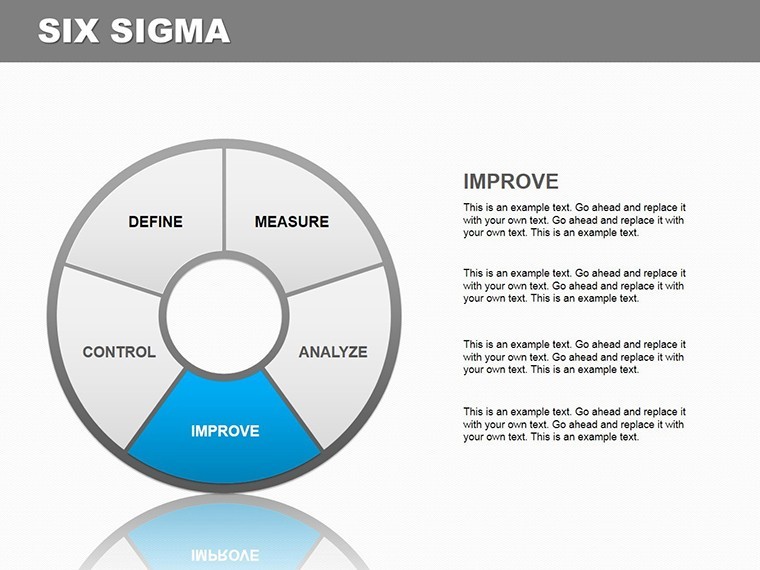
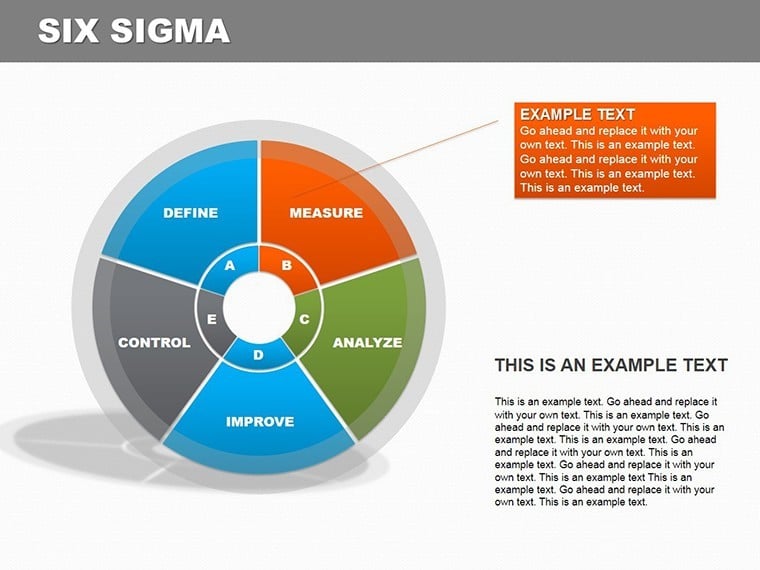
Structured for progression, these slides evolve from basics to breakthroughs. Slide 1: A DMAIC wheel pie, segmenting phases. Slide 15: Fishbone diagrams dissecting root causes within sigma matrices.
- Core DMAIC (Slides 1-5): Pie-centric overviews, with editable phases for project scoping.
- Measurement Tools (Slides 6-10): Control charts and histograms for data dives, sigma-calibrated.
- Analysis Deepens (Slides 11-15): Pareto pies and scatter plots, prioritizing pain points.
- Improve & Control (Slides 16-20): FMEA matrices and sustainment graphs for lasting gains.
Pro move: Animate pie builds to reveal sigma shifts, mirroring process evolutions - like unveiling a renovated structure phase by phase in design reviews.
Seamless Integration: From Desk to Delivery
Link to Minitab exports or embed KPIs live. Outshines generic templates with sigma-specific icons, halving revision cycles for pros under pressure. In education, it's a lecture lifesaver, animating abstract stats into student epiphanies.
For logistics optimizers: Pie out delays across DMAIC, pinpointing Improve levers that reroute efficiencies like a well-planned transit hub.
Proven Pathways: Six Sigma in Action
Spotlight a healthcare overhaul: 20-slide deck mapped patient flow variances, yielding 35% faster throughput. Or academic theses: Visualize model validations with pies that professors praise.
- Quality Audits: DMAIC flows for compliance storytelling.
- Process Training: Interactive pies for hands-on learning.
- Executive Summaries: High-level sigma dashboards for board brevity.
Credibility check: Echoes Motorola's original Six Sigma ethos, with visuals trusted in ISO certifications.
Customization Corner: Tailor to Triumph
Recolor for industry vibes - metallics for manufacturing, pastels for services. Layer transparencies for overlay analyses; iterate via duplicates to test variants. It's empowerment in editable form, dodging the "one-size-fits-none" trap.
From mundane metrics to monumental insights - this is Six Sigma, styled your way.
Sigma Up Your Game - Download Excellence
Claim precision today with the Six Sigma Keynote Charts. Transform data into dominance. Edit, optimize, excel - your sigma journey starts here!
Frequently Asked Questions
What Six Sigma elements are visualized?
DMAIC phases via pies, control charts, and diagrams for full methodology coverage.
PowerPoint friendly?
100% - export maintains sigma scales and infographic fidelity.
Suited for students?
Yes, simplifies concepts for capstones or certifications with editable examples.
Customization depth?
Comprehensive: Colors, data, layouts - all tweakable for unique applications.
Versus basic pie templates?
20 pro slides with Six Sigma specificity eclipse generics in depth and relevance.
Animation included?
Guided builds for phase reveals, enhancing narrative flow.
Good for
- Project roadmaps and sprint plans
- Product launch timelines
- Quarterly or annual review decks
- Company history and milestone summaries
Licence
reviews
Needed quick visuals for a client report and this handled it.
The timeline slides were easier to work with than expected.
A few graph colors blended together on screen.
I mostly used the comparison charts and removed extra stuff.
Good enough for everyday office presentations.
FAQ
Will it work in Google Slides?
Are fonts embedded?
Can I use this for client work?
What's the refund policy?
Do you update the template after purchase?
Similar templates
See all Keynote Charts →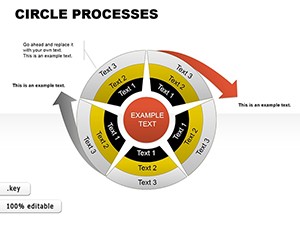

All 20 slides