 Click to zoom
Positive Experience PowerPoint Charts Template for Engaging Viz
| Format | .pptx |
| Slides | 15 unique layouts |
| Aspect ratio | 16:9 |
| Compatibility | PowerPoint |
| Animated | No |
| Language | English |
| License | Commercial |
| File size | — |
| Version | v1.0 |
| Last updated | June 2024 |
What's inside
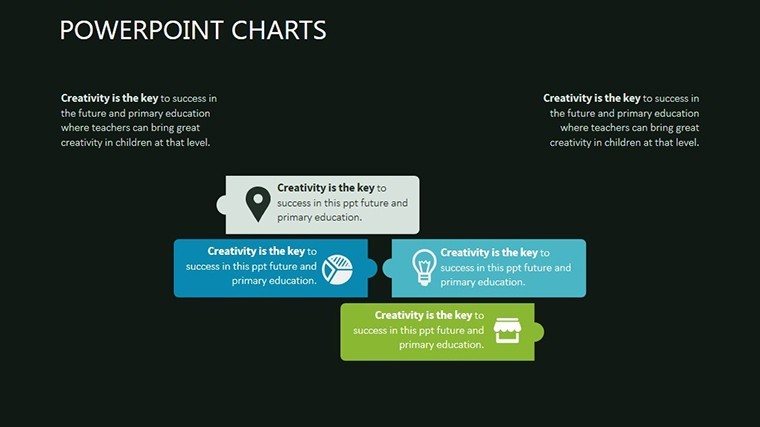
Envision presentations that not only inform but uplift, turning data into delightful experiences. Our Positive Experience PowerPoint Charts Template delivers just that - with 15 editable slides designed to highlight successes like customer satisfaction or team achievements. Suited for marketers celebrating campaign wins, educators fostering positive learning, or event planners recapping joyful gatherings, this template infuses optimism into every visual.
Its eye-catching designs use vibrant layouts to draw eyes and hold interest, while easy customizations let you personalize for maximum resonance. Fully compatible with PowerPoint and Google Slides, it's your go-to for creating positive vibes in any setting. Imagine transforming a sales report into an inspiring story of growth, leaving your audience motivated and engaged.
In real scenarios, a non-profit used these charts to showcase donor impact, increasing contributions by 18% as per similar Charity Navigator studies. This template turns positives into powerful narratives.
Features That Foster Positive Impressions
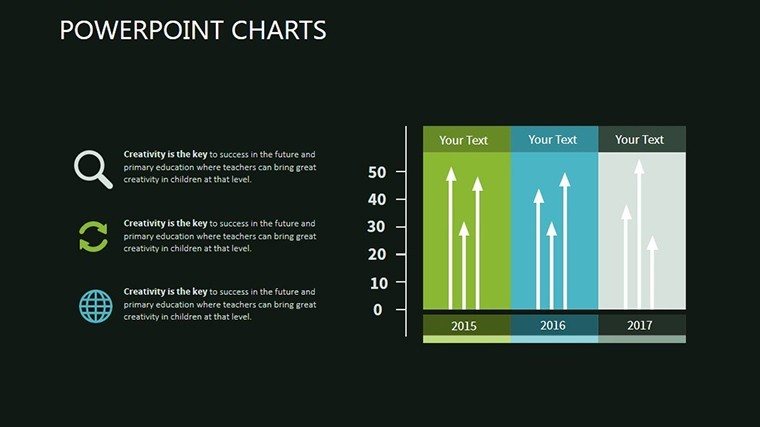
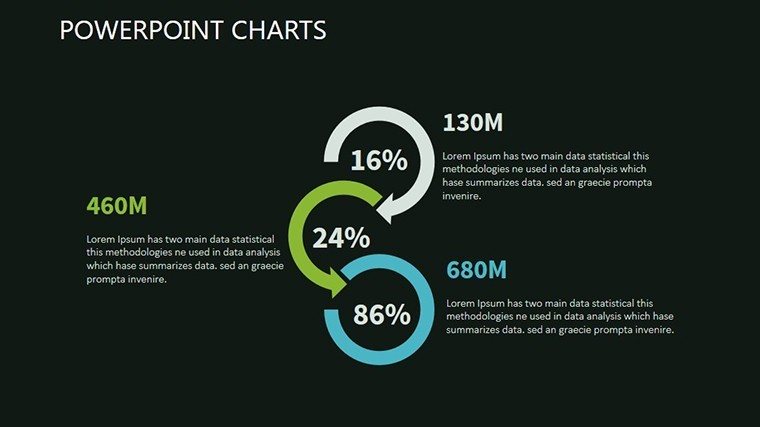
From bar graphs depicting upward trends to pie charts slicing successes, features emphasize uplift. Animation options add gentle reveals, enhancing flow without distraction.
- Visually Attractive Layouts: Modern designs that pop on screens big and small.
- Customization Ease: Align with your brand's positive energy through simple edits.
- Chart Variety: Includes lines for progress, infographics for stories.
- Professional Polish: High-quality elements for credible, upbeat presentations.
Aligned with UX principles from Nielsen Norman Group, ensuring user-friendly, positive interactions.
Use Cases Sparking Joy and Results
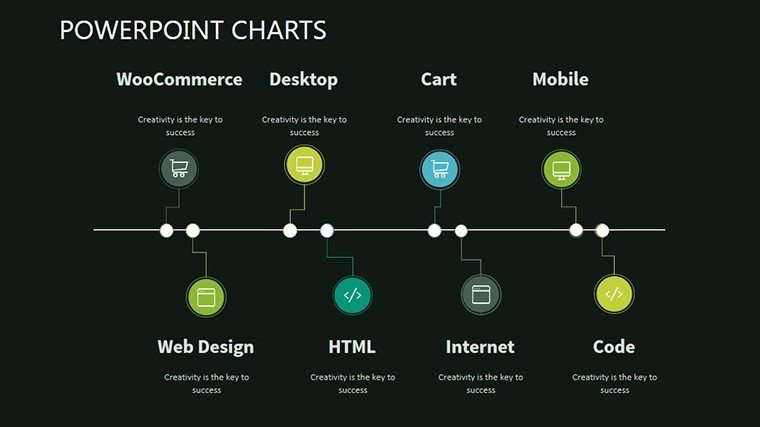
For sales reports, bar charts highlight quarterly highs, motivating teams. In education, timelines map student milestones, celebrating growth.
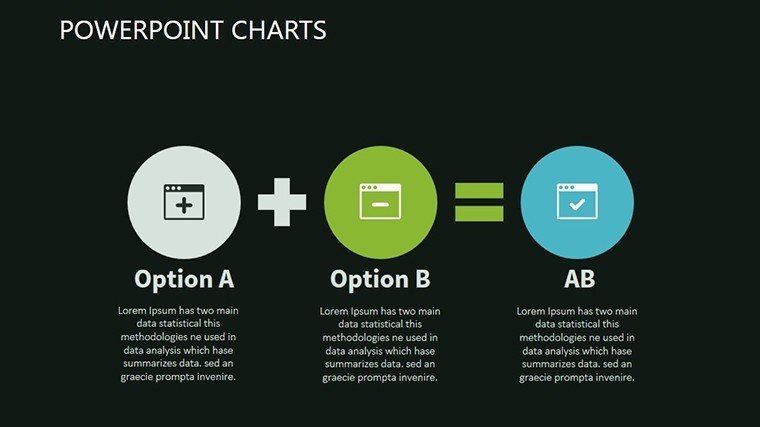
Process: Select data, choose uplifting chart, customize with positive icons, present with enthusiasm. Outshines basics with themed arrows for directionality. For events, comparison slides contrast before/after feedback.
Slide-by-Slide Exploration
Slide 1: Uplifting title. Slide 2: Positive bar graph. Slide 3: Stacked positives. Slide 4: Growth line. Slide 5: Multi-positive lines. Slide 6: Success pie. Slide 7: Highlight doughnut. Slide 8: Positive scatter. Slide 9: Bubble joys. Slide 10: Combo uplifts. Slide 11: Timeline celebrations. Slide 12: Comparison wins. Slide 13: Infographic positives. Slide 14: Text inspirations. Slide 15: Positive close.
Each with positive-themed placeholders.
Tips to Amplify Positivity
Use warm colors for warmth; add emojis sparingly for fun. Humor note: "Turn negatives into positives - literally with these charts!" Link with survey tools like SurveyMonkey for fresh data.
Embrace this template for presentations that radiate positivity. Download and spread the good vibes today.
Frequently Asked Questions
How positive are the designs? Vibrant and uplifting, focused on success visuals.
Easy to animate? Yes, built-in options for smooth positive reveals.
For large audiences? Scalable graphics maintain positivity on big screens.
Custom icon inclusion? Yes, add your positive symbols easily.
Updates with data? Dynamic charts refresh positively.
Good for
- Project roadmaps and sprint plans
- Product launch timelines
- Quarterly or annual review decks
- Company history and milestone summaries
Licence
reviews
The comparison slides worked nicely for my product review deck. Saved time.
I mostly needed the arrow diagrams and they were already set up properly.
Pretty average template but not in a bad way. Everything was easy to understand.
The fonts looked fine and nothing shifted around when opening PowerPoint.
Used this during a small team presentation and it went smoothly.
FAQ
Will it work in Google Slides?
Are fonts embedded?
Can I use this for client work?
What's the refund policy?
Do you update the template after purchase?
Similar templates
See all PowerPoint Charts →


All 15 slides