 Click to zoom
Positive and Negative Effects of Technology PowerPoint Charts Template
| Format | .pptx |
| Slides | 21 unique layouts |
| Aspect ratio | 16:9 |
| Compatibility | PowerPoint |
| Animated | No |
| Language | English |
| License | Commercial |
| File size | — |
| Version | v1.0 |
| Last updated | August 2023 |
What's inside
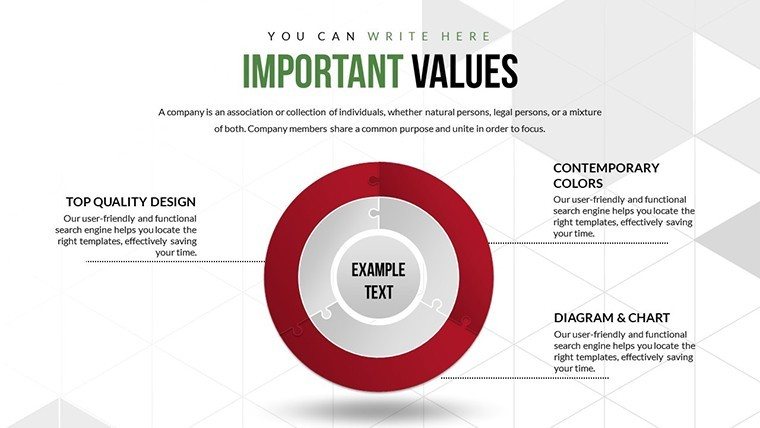
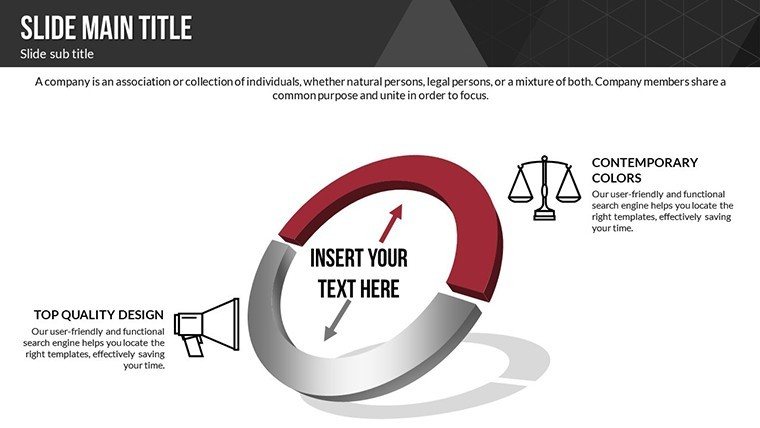
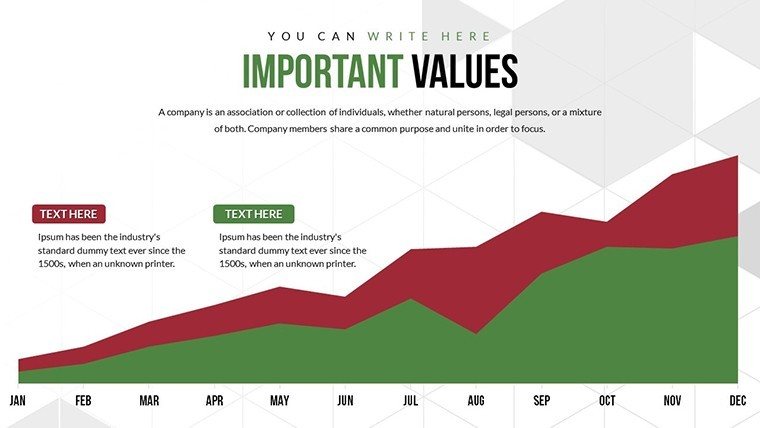
Technology's dual nature shapes our world, offering breakthroughs alongside challenges. Our Positive and Negative Effects of Technology PowerPoint Charts Template, with 21 editable slides, empowers you to explore this balance through stunning visuals. Ideal for educators, researchers, and business pros, it uses relationship diagrams, pie charts, and spheres to illustrate impacts, making abstract concepts tangible and engaging.
Picture a classroom lecture where pie charts slice up tech's pros and cons, or a board meeting analyzing AI's effects on productivity. This template, in .pptx format, includes customizable graphics and data-driven elements, ensuring broad compatibility and visual appeal.
Core Features Enhancing Your Tech Narratives
Crafted for impact, features include visually striking charts that captivate, with easy customization to align with your style and data insights for persuasive arguments.
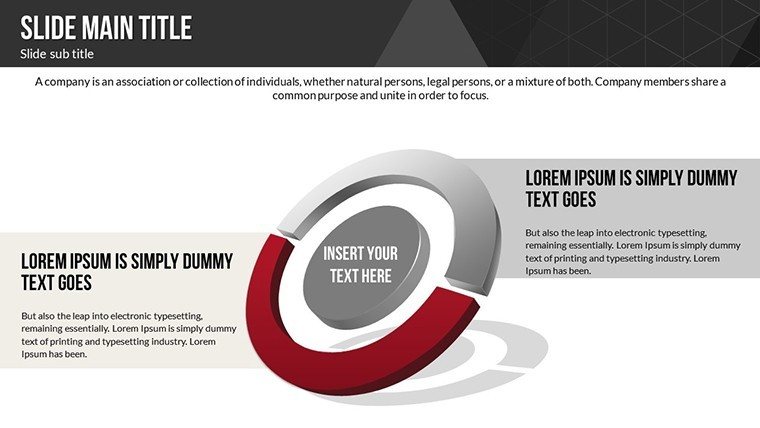
- Pie Charts: Divide effects into quantifiable segments for clear comparisons.
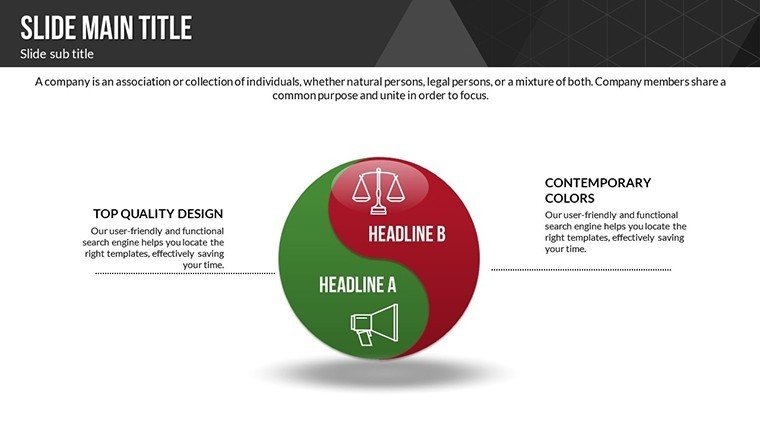
- Sphere Visuals: Represent multifaceted impacts in 3D-like views.
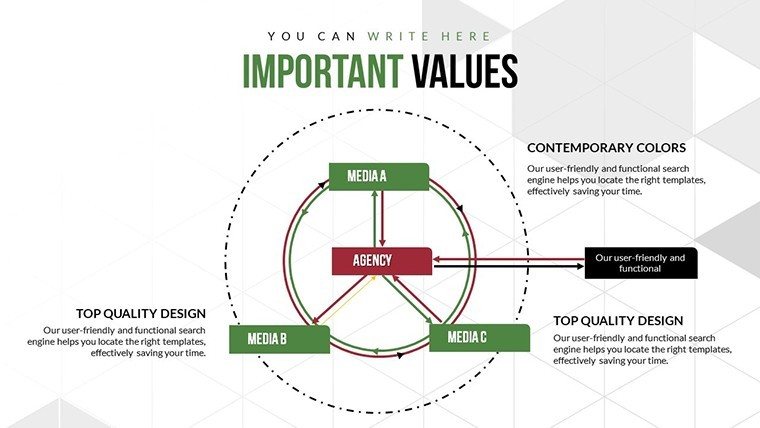
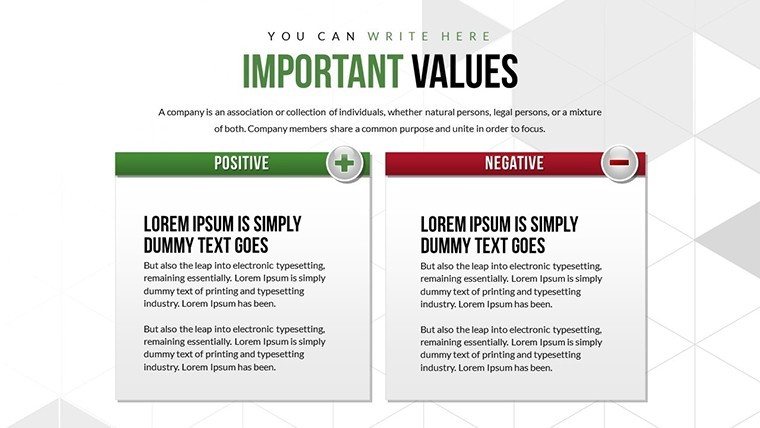
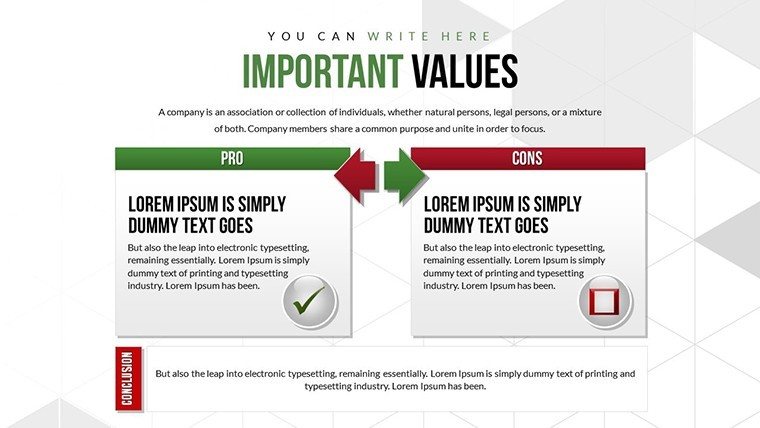
- Relationship Diagrams: Show interconnections between positive and negative aspects.
- 21 Slides: From overviews to deep dives into tech trends.
- Data Customization: Infuse real stats for authenticity.
Aligned with expert insights from sources like Pew Research Center on tech effects, it builds trust in your content.
Targeted Use Cases for Impactful Delivery
In research presentations, use spheres to map global tech influences; educators can employ pies for student discussions on social media. Businesses might diagram automation's job effects, referencing studies from McKinsey Global Institute.
For policy makers, visualize environmental impacts of tech, drawing from UN reports on sustainability.
Building a Balanced Tech Presentation: Steps
- Introduce Dualities: Slide #3's pie overviews positives like efficiency.
- Detail Negatives: Use slide #8 for relationship charts on privacy concerns.
- Balance Views: Slide #13 integrates both for nuanced analysis.
- Provide Insights: Sphere on slide #17 shows broader implications.
- Call to Action: End with slide #21's summary graphic.
This tackles audience skepticism by presenting balanced, data-backed views.
Beyond Basic: Elevated Tech Visualization
Surpasses standard charts with thematic designs tailored to tech themes, incorporating best practices from visualization gurus like Alberto Cairo.
Workflow: Import data, customize, and engage - users praise the time savings and audience feedback.
Tips to Amplify Your Tech Discussions
Balance colors: Greens for positives, oranges for negatives. Keep data current with links to sources. Rehearse for flow. Advanced: Animate reveals for dramatic effect on effects.
Storytell as a tech evolution tale, per narrative psychology, for better retention.
Unlock insights - download this tech effects template now and navigate the future.
FAQ
How do pie charts help in this template?
They quantify proportions of positive vs. negative effects for easy digestion.
Compatible with older PowerPoint versions?
Yes, works on 2010+, with full features in newer ones.
Best for which audiences?
Educators, researchers, business analysts discussing tech's societal roles.
Can I update charts with live data?
Yes, link to Excel for automatic refreshes.
Any design tips included?
Download features basic guides; extend with online resources.
Good for
- Project roadmaps and sprint plans
- Product launch timelines
- Quarterly or annual review decks
- Company history and milestone summaries
Licence
reviews
I liked the small icons beside the text sections.
Some pages looked too similar but I still kept most of them.
Good option if you need charts without spending hours designing slides.
Used this for a monthly performance review at work.
The chart layouts looked clean when projected on a big screen.
FAQ
Will it work in Google Slides?
Are fonts embedded?
Can I use this for client work?
What's the refund policy?
Do you update the template after purchase?
Similar templates
See all PowerPoint Charts →

All 21 slides