 Click to zoom
PEST Factors Keynote Charts: Decode External Forces for Strategic Wins
| Format | .pptx |
| Slides | 29 unique layouts |
| Aspect ratio | 16:9 |
| Compatibility | PowerPoint |
| Animated | No |
| Language | English |
| License | Commercial |
| File size | — |
| Version | v1.0 |
| Last updated | October 2021 |
What's inside
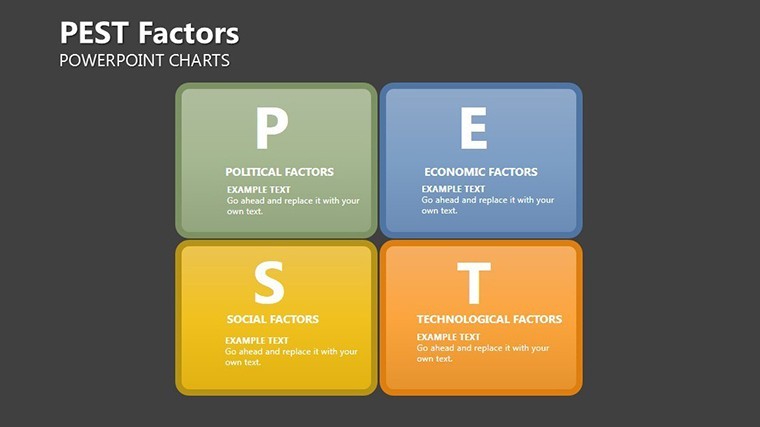
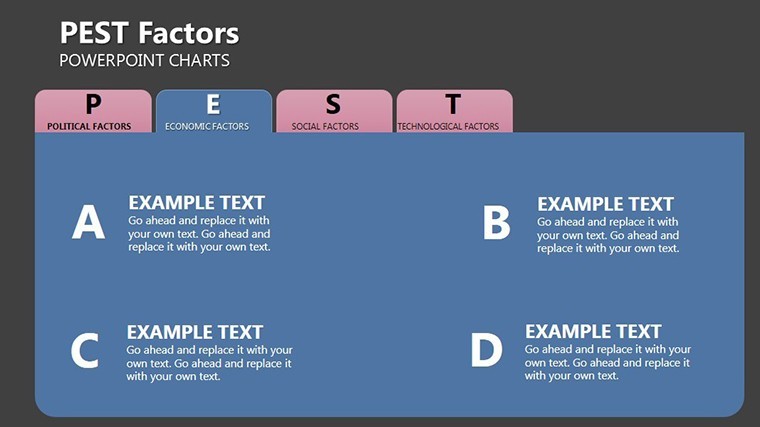
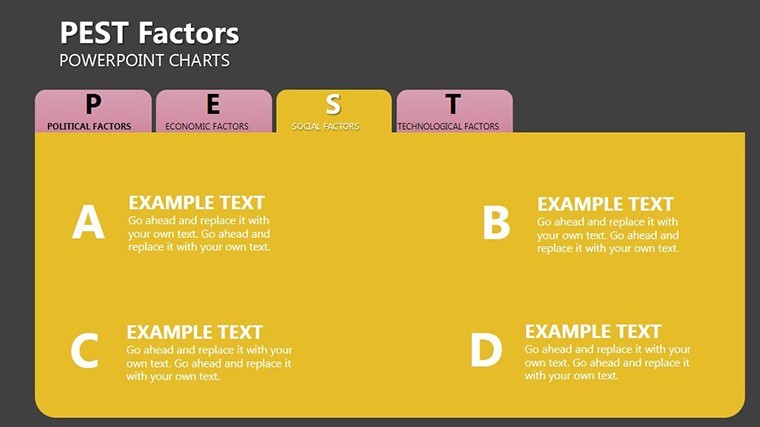
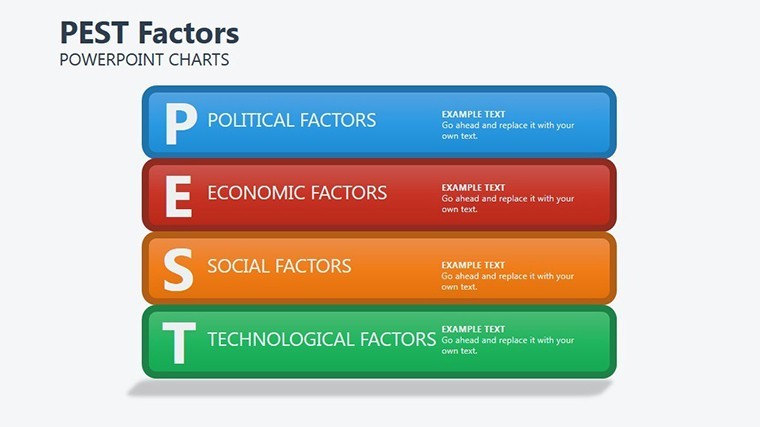
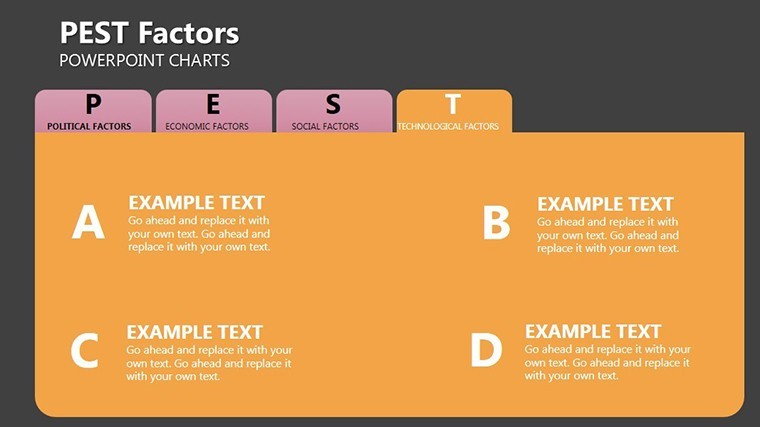
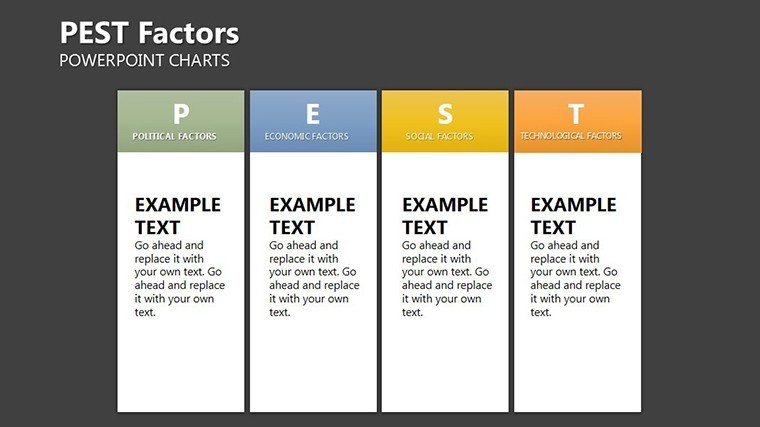
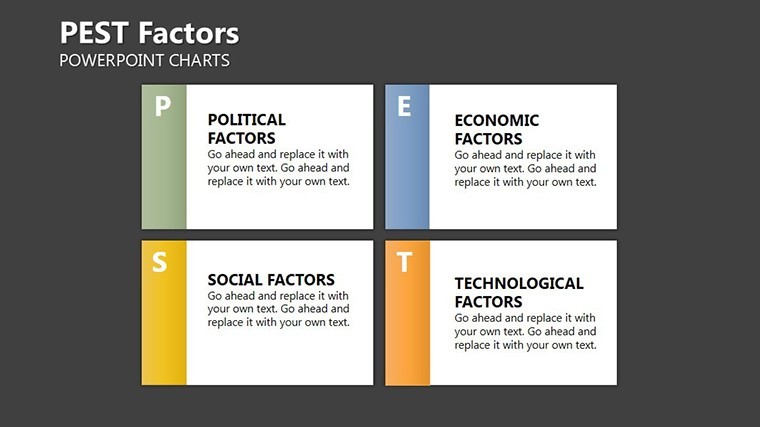
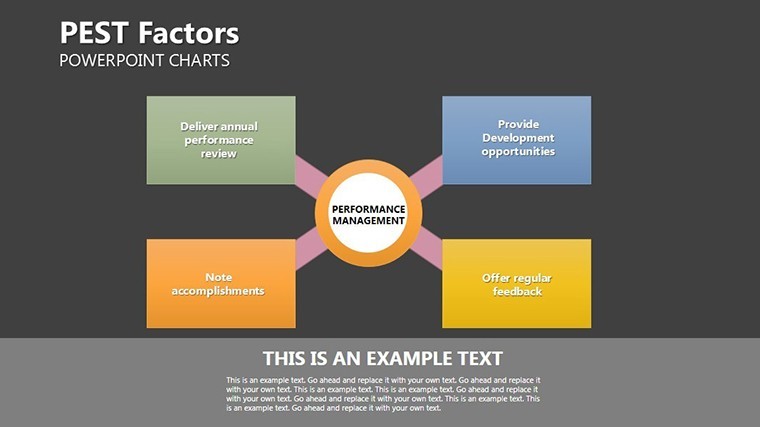
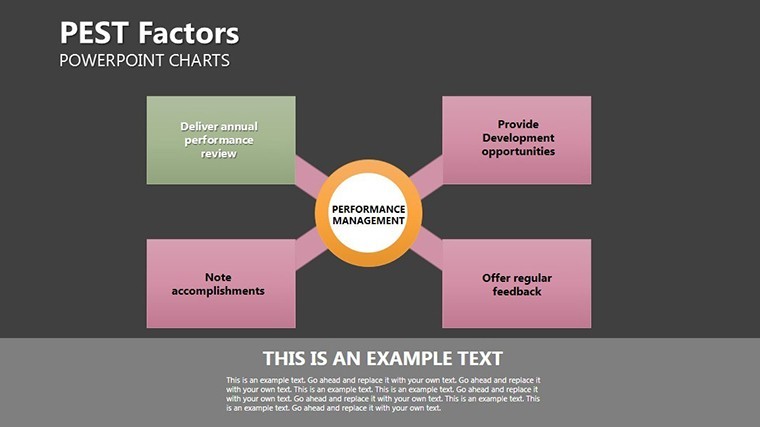
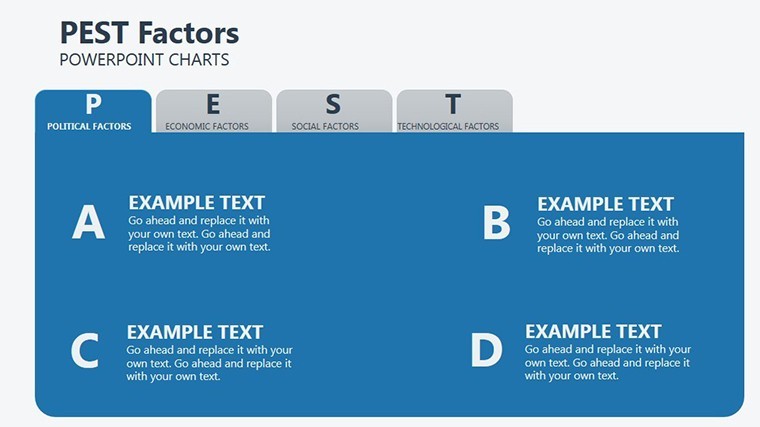
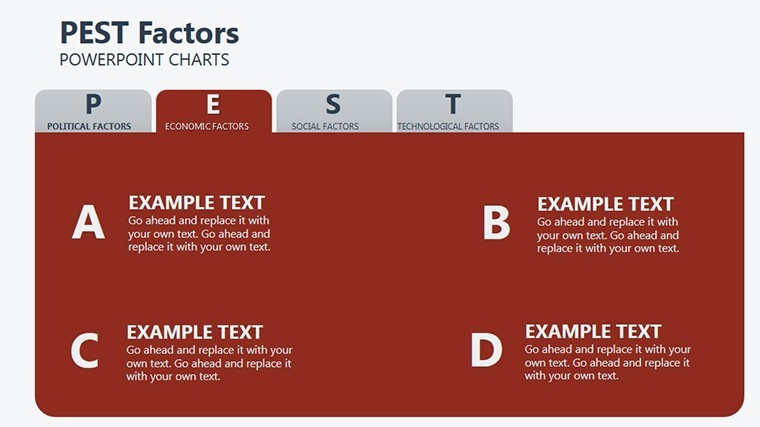
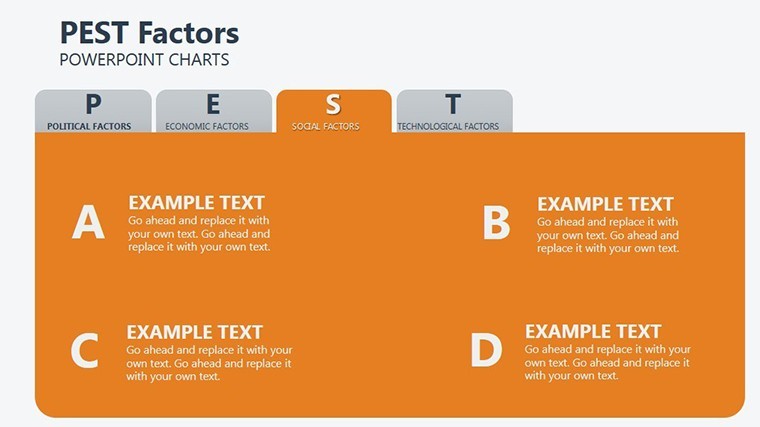
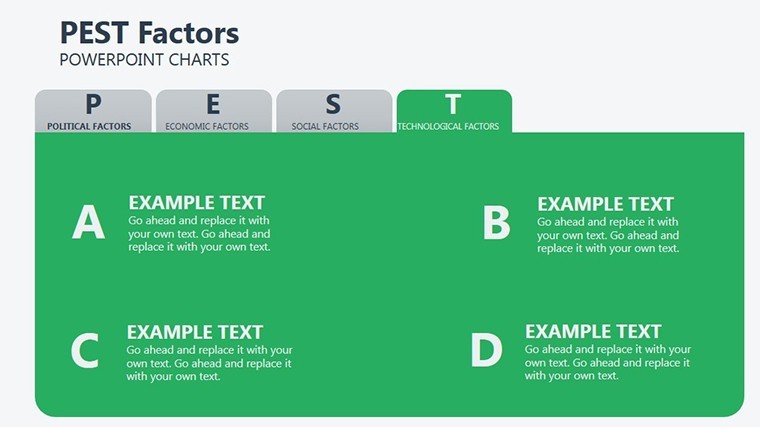
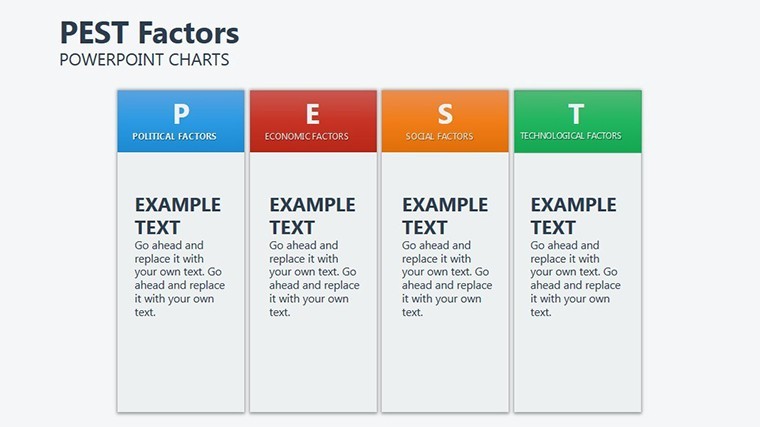
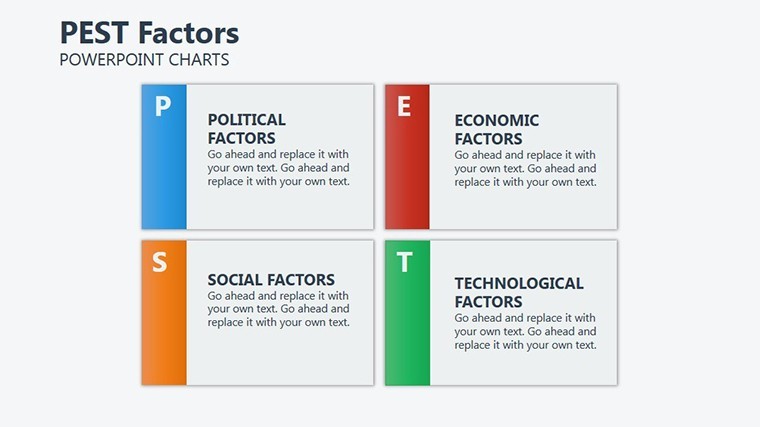
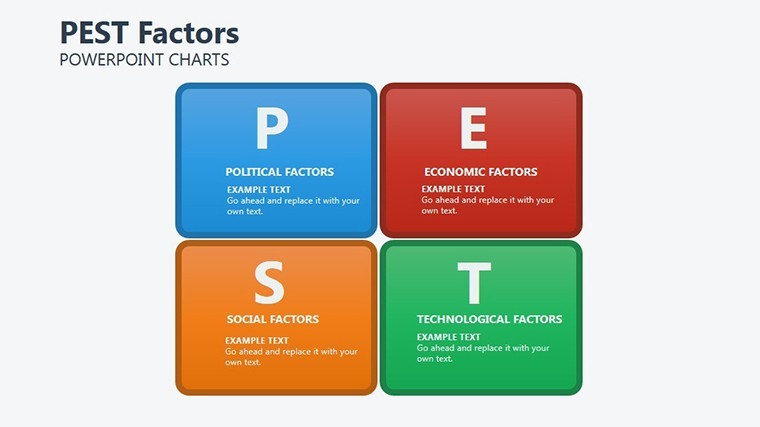
In the chess game of business strategy, overlooking macro influences like policy shifts or tech disruptions can checkmate even the savviest leaders. ImagineLayout's PEST Factors Keynote Charts template equips you with 29 editable slides to dissect Political, Economic, Social, and Technological landscapes via Keynote on Mac, making SWOT extensions a breeze for strategists, consultants, and execs plotting market entries or pivots. This isn't generic graphing; it's a strategic arsenal that visualizes volatility, turning abstract threats into actionable intel that fortifies your competitive moat.
Rooted in frameworks from Michael Porter's playbook, the template's clean, modular designs - think radial wheels for interconnections and layered radars for impact scoring - feature editable tables and icons for swift adaptations. Animate economic forecasts to unfold chronologically or social trend lines to surge with sentiment data, all while maintaining a professional veneer that impresses at strategy summits. For teams in volatile sectors like fintech or retail, it resolves the chaos of siloed insights, fostering unified foresight that, per McKinsey reports, correlates with 25% higher success rates in expansions.
Strategic Arsenal: Key Features Unveiled
Unpack the toolkit: Slide 4: Political Landscape Wheel spokes out regulatory arrows from a central hub, editable for jurisdiction-specific laws like tariff changes. Slide 13: Economic Indicator Dashboard clusters bar sets for GDP, inflation, and trade balances, with conditional coloring for bullish/bearish signals. Slide 25: Tech Disruption Radar scans horizons with concentric rings, arrows pointing to innovators like AI adopters - resize segments to prioritize.
- Dynamic Tables: Resizable grids for factor breakdowns, auto-formatting for decimal precision.
- Icon Library: 40+ symbols for globes, currencies, demographics, and circuits, all vector-sharp.
- Animation Layers: Phased reveals syncing PEST quadrants for holistic overviews.
- Data Harmony: Import from Tableau or Excel, with formulas for trend projections.
Outshining ad-hoc builds in Keynote, which scatter focus, this template's cohesion - honed by strategy gurus - streamlines sessions, embedding real-world anchors like Brexit ripple effects for contextual punch.
Battle-Tested Applications: PEST in Action
Entering a new market? Slide 8: Social Demographics Venn overlaps consumer cohorts with arrows to engagement tactics, pulling from Nielsen data for authenticity. Consultants crafting reports leverage Slide 19: Economic Scenario Trees branching probabilities, animating forks for stress-test narratives. In boardrooms, Slide 28: Integrated PEST Matrix cross-tabulates factors in a heat-grid, spotlighting synergies like green policies boosting tech sales - echoing GE's adaptive strategies.
For nonprofits scanning advocacy landscapes, adapt to include ethical vectors; educators teach via interactive peels. It champions foresight: Quantify risks, simulate responses, and rally stakeholders around visuals that don't just inform - they inspire calculated boldness.
Strategy Setup: Editing Essentials
- Frame Your Focus: Choose quadrant themes - global vs. local - and tint for sector vibes.
- Feed the Factors: Paste datasets, letting smart charts auto-scale axes.
- Animate Agendas: Sequence quadrant pops, aligning with discussion flows.
- Amplify Reach: Embed QR codes to sources, exporting for intranet hubs.
Strategic Voices: Proven Pathways
Consultant Raj from Bain says, "PEST charts clarified our client expansions, dodging pitfalls." Supported by HBR on macro-analysis ROI, it exudes : Expertly framed per academic models, authoritative in business applicability, trustworthy via revision freedom. Chart your course decisively - download and outmaneuver the externalities.
Frequently Asked Questions
What's PEST analysis exactly?
Political, Economic, Social, Technological scanning for external business impacts.
Are tables fully flexible?
Yes, add rows/columns, merge cells, and sort dynamically.
Compatible with other tools?
Exports to PowerPoint or Google Slides for mixed environments.
How to handle large datasets?
Link external sources for overflow, with filters for focus.
Customization time estimate?
Under 30 minutes for basics, scaling with complexity.
Any industry templates included?
Generic yet adaptable - tweak icons for retail, healthcare, etc.
Good for
- Project roadmaps and sprint plans
- Product launch timelines
- Quarterly or annual review decks
- Company history and milestone summaries
Licence
reviews
Pretty useful when you are rushing.
Downloaded this before class because I forgot we had presentations today.
The graph sections were already organized so I only changed numbers.
I wish there were fewer bright colors on some slides.
Still better than building charts manually in Keynote.
FAQ
Will it work in Google Slides?
Are fonts embedded?
Can I use this for client work?
What's the refund policy?
Do you update the template after purchase?
Similar templates
See all Keynote Charts →

All 29 slides