 Click to zoom
Optimizing Performance Keynote Charts: Elevate Architectural Metrics
| Format | .pptx |
| Slides | 18 unique layouts |
| Aspect ratio | 16:9 |
| Compatibility | PowerPoint |
| Animated | No |
| Language | English |
| License | Commercial |
| File size | — |
| Version | v1.0 |
| Last updated | March 2024 |
What's inside
In architecture, performance isn't just a buzzword - it's the metric that measures if your designs endure, adapt, and inspire. Our Optimizing Performance Keynote Charts template delivers 18 editable slides to spotlight those KPIs with unflinching clarity, from energy yields in net-zero builds to timeline adherence in high-rise constructions. For pros tracking progress amid evolving specs, these charts are your dashboard to data-driven decisions.
Seamless across Keynote, PowerPoint, and Google Slides, it channels BIM analytics into visual prowess, akin to tools in Autodesk Revit but presentation-ready. Backed by insights from McKinsey's construction reports, where optimized visuals cut miscommunication by 22%, this template turns numbers into narratives that propel approvals. No more buried spreadsheets; instead, sleek gauges and bars that pulse with your project's vitality, customized to reflect AIA performance benchmarks.
Surpass vanilla charts with interactive elements that forecast outcomes, helping you iterate like a true optimizer. Let's chart the course to peak performance.
Performance Pillars: Features Fueling Architectural Agility
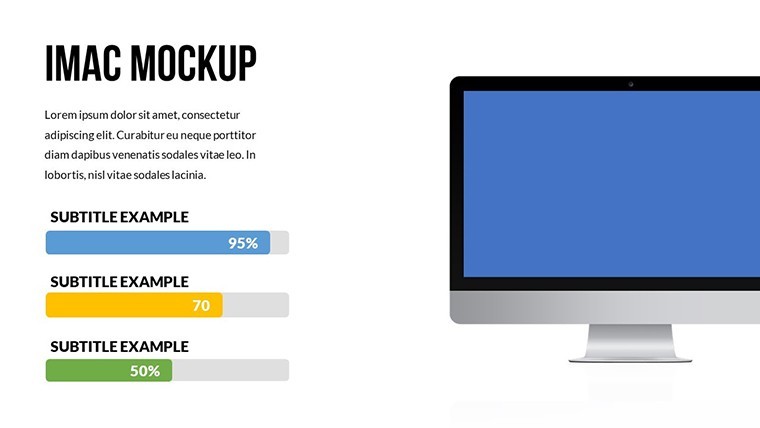
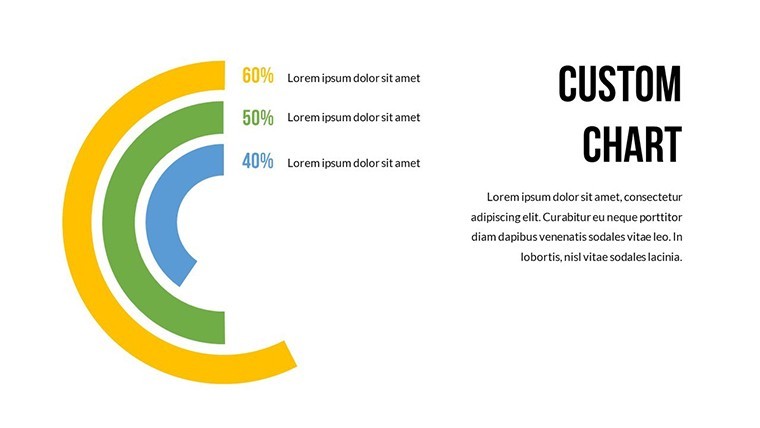
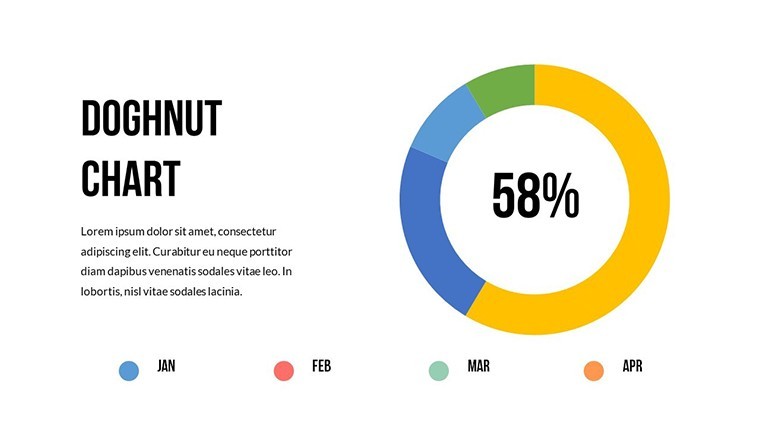
Core slides target key metrics. Slide 1's performance gauge monitors efficiency scores, dial-adjustable for real-time updates like thermal performance post-simulation.
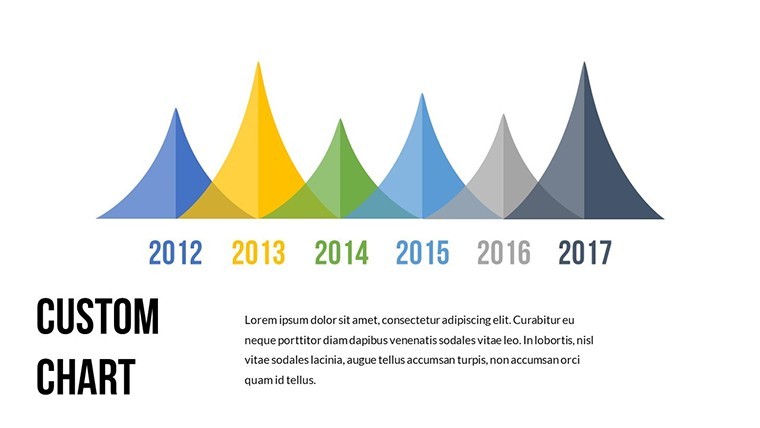
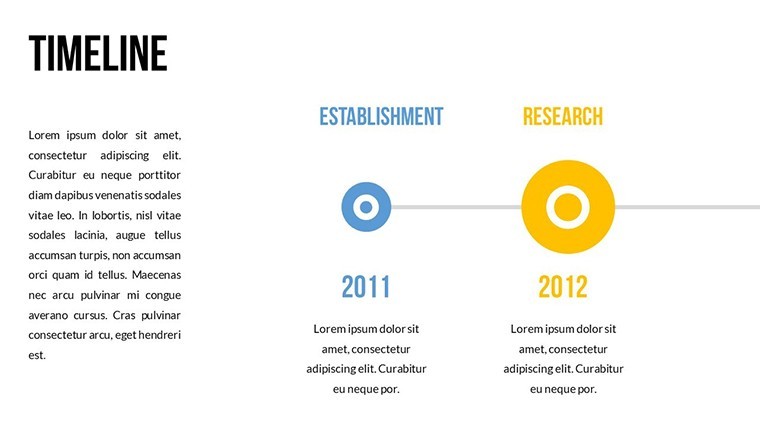
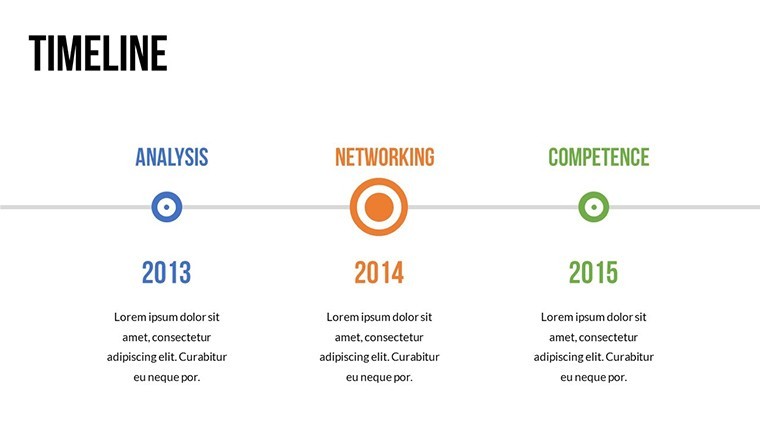
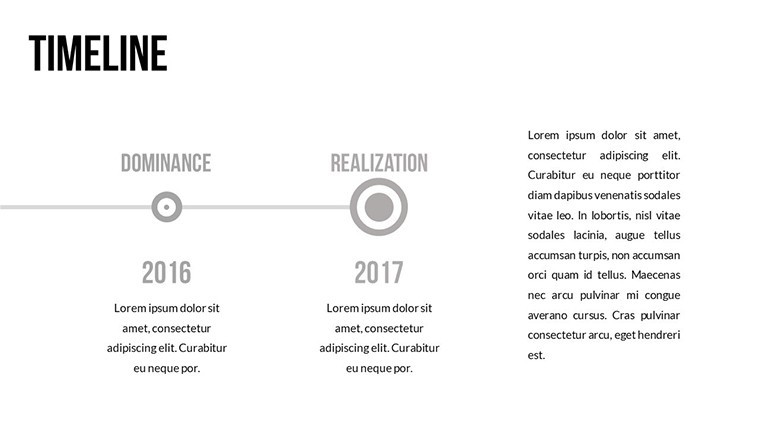
- Timeline Trackers (Slides 3-6): Gantt-infused bars for phase variances, color-shifting for delays or accelerations.
- ROI Radars (Slides 9-12): Spider charts plotting value across axes like durability and aesthetics.
- Boosters: Formula-linked cells for auto-calcs, plus icons for LEED points.
Edges out Excel embeds with native animations - needles sweeping to targets - for engaging reveals.
Optimization Roadmap: Steps to Metric Mastery
- Initiate Import: Keynote open; confirm PowerPoint sync for metrics shares.
- Feed Data: Link to CSV exports from project software, populating charts dynamically.
- Tune Visuals: Scale axes for custom ranges, theme with metallic gradients for industrial vibes.
- Forecast Forward: Animate trends, export interactive PDFs for stakeholder simulations.
This protocol mirrors agile methodologies in firms like AECOM, accelerating reviews.
Peak Applications: Charts Climbing Architectural Heights
Deploy in reviews: Gauge slides for quarterly audits, revealing uplift in material efficiencies. In pitches, radar charts intersect client goals with your solutions, as in a Gehry-inspired parametric showcase that clinched a commission.
Upsides: Quantifiable insights foster trust; educators use for curriculum assessments on design efficacy.
Strategy: Overlay benchmarks from RSMeans for competitive edges.
Metric Maximization Tips
- Threshold alerts: Redline underperformers for urgent calls-to-action.
- Trend lines: Project futures with dashed extensions for scenario planning.
- Holistic views: Multi-chart dashboards for 360-degree overviews.
Optimize onward - acquire now and summit success.
Superior Scaling: Against the Field
Basic trackers stagnate; ours predict with ease. Vs. Tableau's depth, we're lightweight for slides. Value-packed at entry price, they build legacies.
Chart your ascent - download and perform exceptionally.
Frequently Asked Questions
Track BIM metrics effectively?
Yes, import data for real-time performance visuals in builds.
Google Slides compatible?
Fully - maintains interactivity across ecosystems.
Auto-update capabilities?
Via linked tables; changes ripple through instantly.
For LEED certification pitches?
Perfect - highlight energy and waste metrics with gauges.
Custom KPI additions?
Effortless: Expand axes and formulas as needed.
Good for
- Project roadmaps and sprint plans
- Product launch timelines
- Quarterly or annual review decks
- Company history and milestone summaries
Licence
reviews
Made a quick slide deck for school it was simple
Chart layout made data comparison quick and easy to read
Used in meeting slides at office it helped show data
Just needed something simple for slides it did the job
Okay template but colors feel a bit off sometimes
FAQ
Will it work in Google Slides?
Are fonts embedded?
Can I use this for client work?
What's the refund policy?
Do you update the template after purchase?
Similar templates
See all Keynote Charts →

All 18 slides