 Click to zoom
Important Information PowerPoint Chart Template: Organize Data Effectively
| Format | .pptx |
| Slides | 18 unique layouts |
| Aspect ratio | 16:9 |
| Compatibility | PowerPoint |
| Animated | No |
| Language | English |
| License | Commercial |
| File size | — |
| Version | v1.0 |
| Last updated | April 2021 |
What's inside
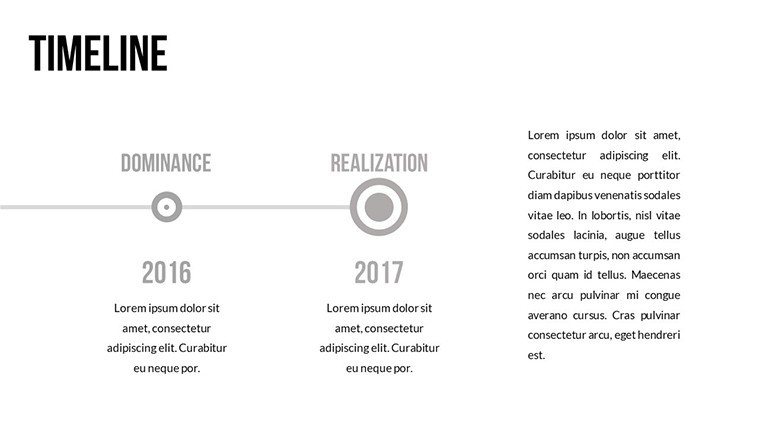
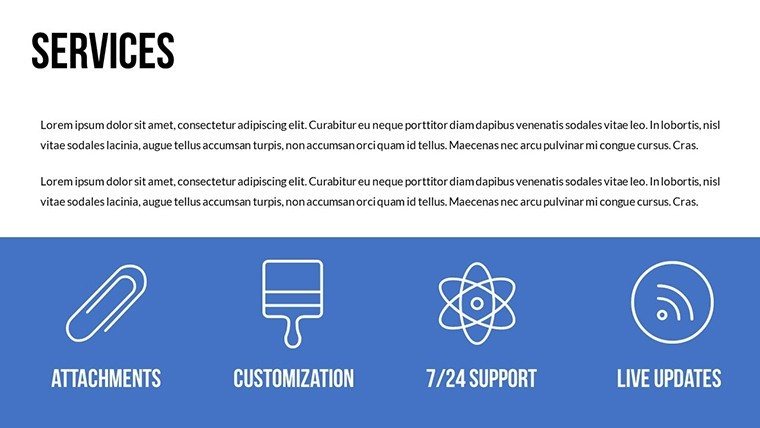
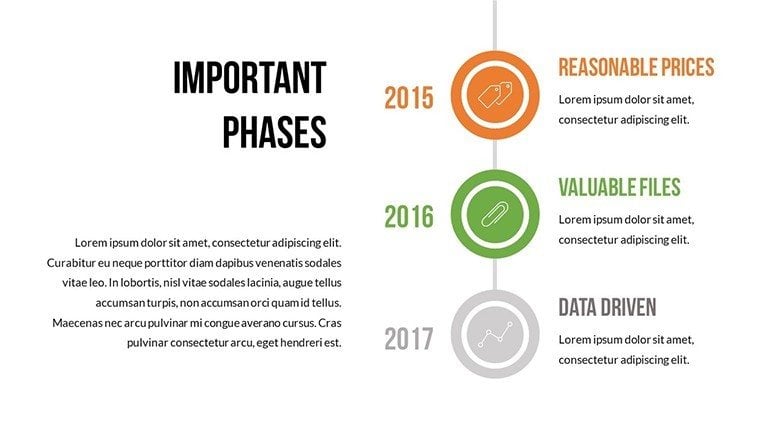
In the realm of project management, clarity is king. Our Important Information PowerPoint Chart Template delivers just that with 18 editable slides focused on timelines, interactions, and resource allocation. Ideal for organizations juggling multiple teams or dynamic deadlines, it helps visualize company activities beyond mere schedules. Incorporating timeline best practices from the Project Management Institute (PMI), this template enables you to depict sequences, conditions, and successes in a cohesive manner. Whether refining internal reports or planning complex initiatives, it turns overwhelming details into actionable insights, fostering better decision-making and team alignment.
Standout Features for Robust Data Handling
This template excels in adaptability. Slides feature editable objects for custom interactions, perfect for spatial data representations. High-quality timelines scale interactions and messages, aiding in resource scheduling. The design supports complex plan creation, with elements that adjust to changing scopes. PowerPoint compatibility ensures smooth edits, and the interface is intuitive for quick mastery. Unlike standard timelines, ours includes visual cues for lead successes, adding a strategic layer.
- Editable Interaction Objects: Customize for specific project needs.
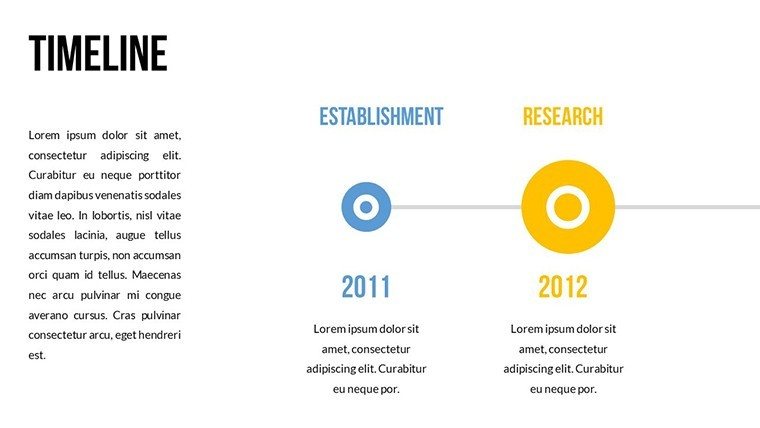
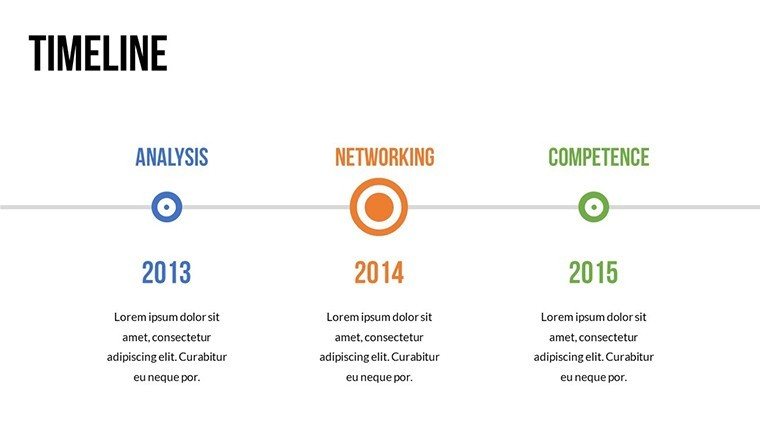
- Timeline Visualizations: Show sequences and conditions dynamically.
- Resource Allocation Tools: Plan work efficiently across teams.
- Spatial Data Representation: Analyze relationships visually.
- Flexible Planning Elements: Adapt to evolving deadlines.
Proven Benefits in Project Execution
Users gain from enhanced efficiency. PMI studies show visual timelines reduce project overruns by 20%. For managers, this means clearer resource distribution, minimizing bottlenecks. Organizations can showcase lead visuals in stakeholder updates, building confidence. The template's focus on refinement streamlines presentations, saving time on revisions. In multi-team settings, it clarifies roles, boosting collaboration. Trust builds through accurate depictions, aligning with authoritative standards.
Step-by-Step Utilization for Optimal Results
- Download and open in PowerPoint.
- Select a timeline slide for your activity sequence.
- Input data on interactions and resources.
- Adjust visuals for spatial accuracy.
- Incorporate conditions and successes.
- Review and present with confidence.
This method allows iterative improvements, superior to rigid tools by offering flexibility for real-time changes.
Versatile Use Cases: From Planning to Analysis
Applications span industries. Project leads use it for Gantt-like timelines in construction, per AIA guidelines for scheduling. Teams in software development map sprint interactions, enhancing agile practices. A case: A logistics firm employed these charts to optimize supply chains, cutting delays by 18%. For non-profits, visualize program milestones. Tips: Use color coding for team assignments, ensuring accessibility. Integrate with MS Project for data imports. This template empowers precise communication, evolving with your organizational growth.
Harness this tool now – refine your information flow and achieve project excellence.
Frequently Asked Questions
How editable are the timeline elements?
Fully, including shapes, texts, and data points for complete adaptation.
Can it handle multiple team schedules?
Yes, designed for complex, multi-team environments with adjustable layers.
What format is the download?
.pptx, compatible with Microsoft PowerPoint.
Is it suitable for beginner users?
Absolutely, with intuitive interfaces and pre-set guides.
How do I incorporate external data?
Copy-paste or link from spreadsheets for seamless integration.
Good for
- Project roadmaps and sprint plans
- Product launch timelines
- Quarterly or annual review decks
- Company history and milestone summaries
Licence
reviews
The graphs looked nice enough for my marketing update.
I changed the colors because the defaults felt too dark.
Pretty easy template to work with even for beginners.
Some icons were a bit outdated honestly.
The layouts helped me keep the presentation organized.
FAQ
Will it work in Google Slides?
Are fonts embedded?
Can I use this for client work?
What's the refund policy?
Do you update the template after purchase?
Similar templates
See all PowerPoint Charts →

All 18 slides