 Click to zoom
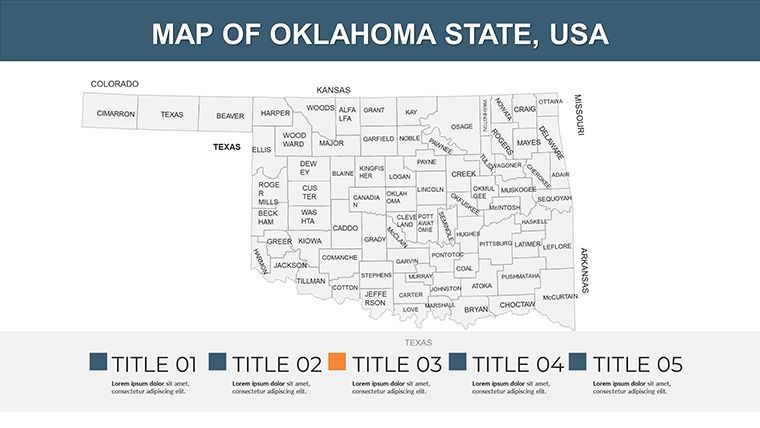
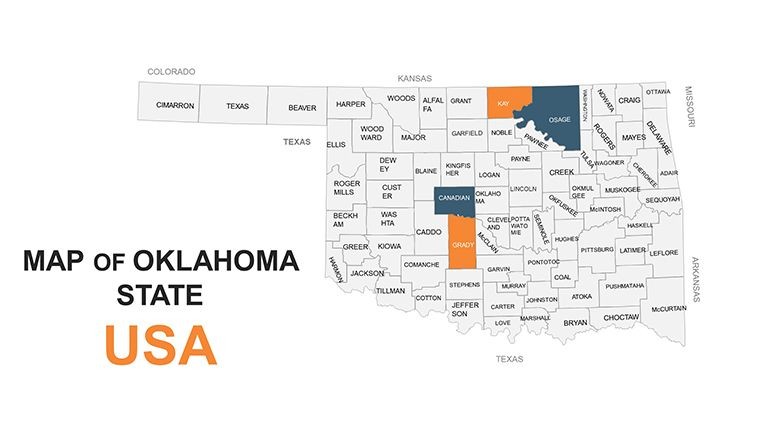
Oklahoma Editable Keynote Map Template
| Format | .pptx |
| Slides | 26 unique layouts |
| Aspect ratio | 16:9 |
| Compatibility | PowerPoint |
| Animated | No |
| Language | English |
| License | Commercial |
| File size | — |
| Version | v1.0 |
| Last updated | May 2022 |
What's inside
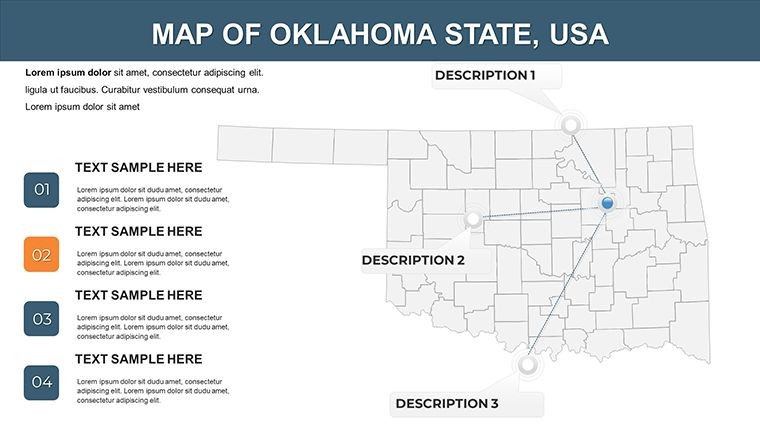
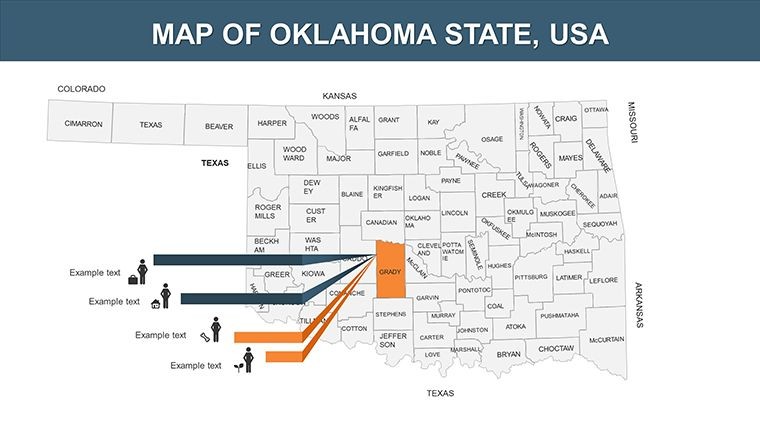
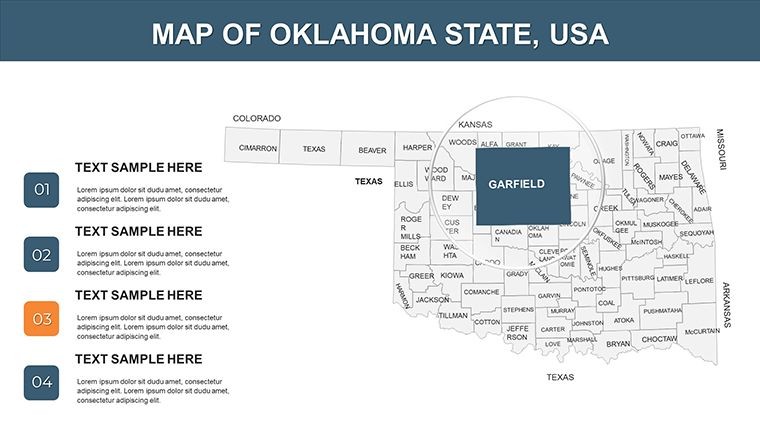
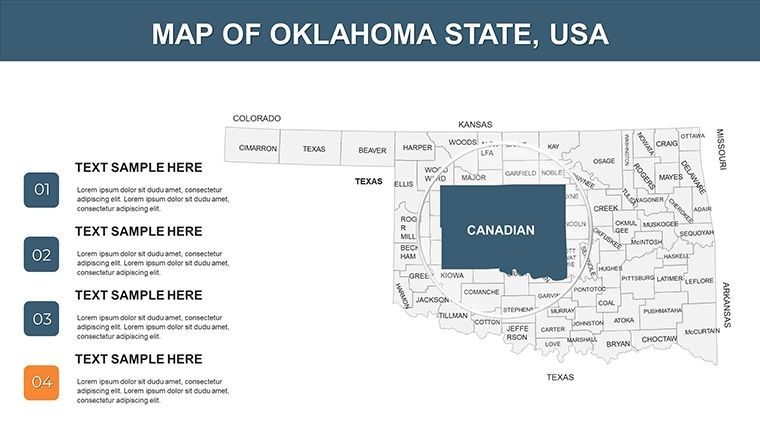
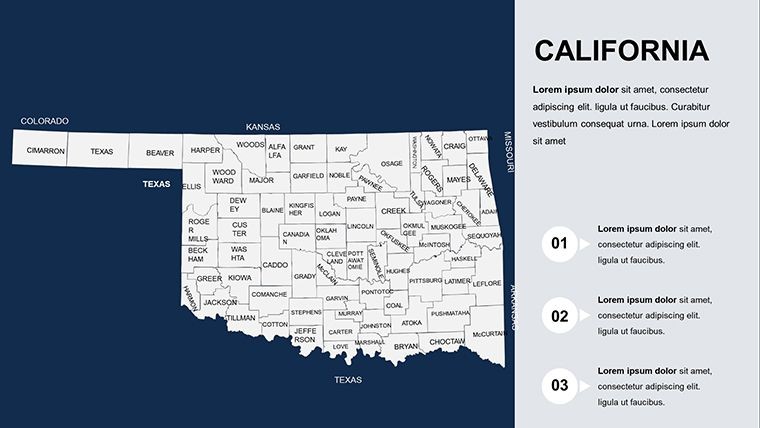
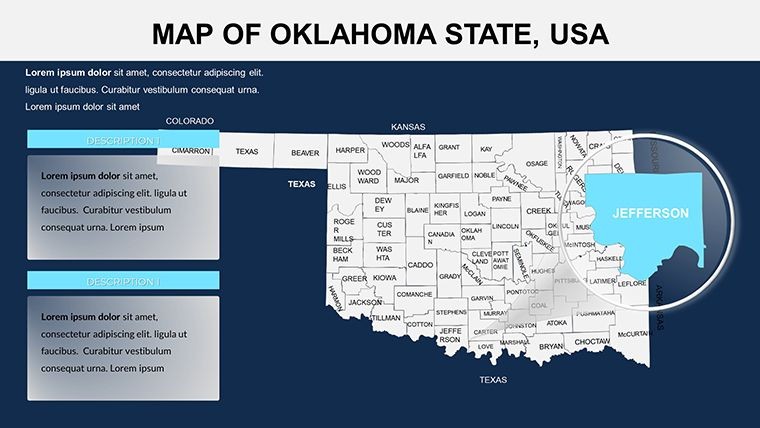
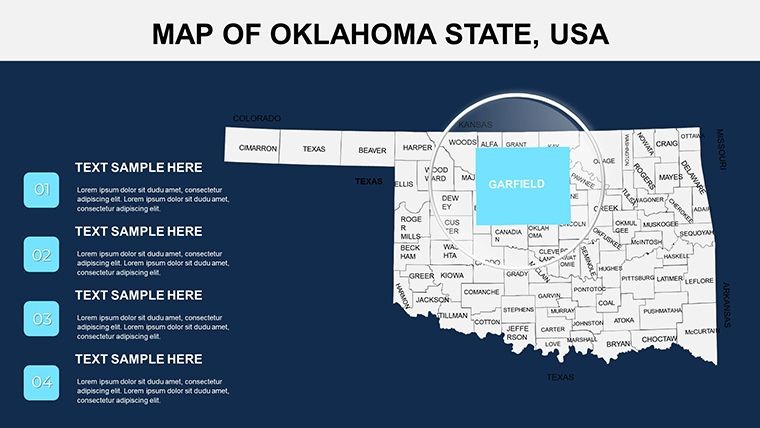
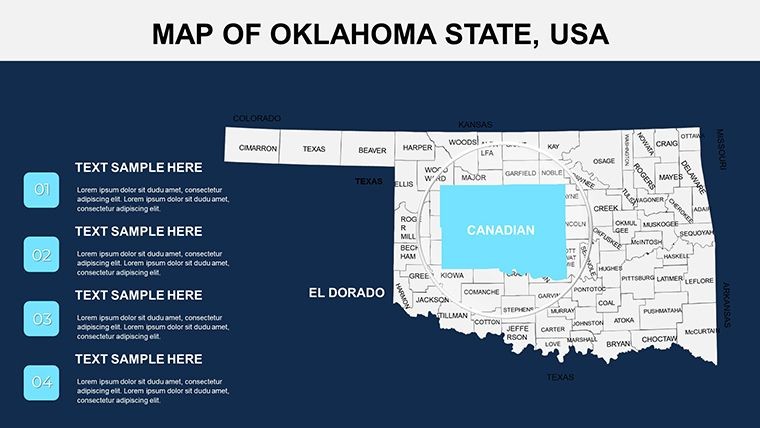
Deep in the heart of the Great Plains, where energy pipelines crisscross vast landscapes, effective visual communication is key to conveying complex ideas. Our Oklahoma Editable Keynote Map Template delivers just that, with 26 innovative slides tailored for architects, energy sector analysts, and historians seeking to illuminate regional dynamics. Optimized for Keynote on Mac and iPad, it features handcrafted vectors, custom animations, and free fonts, ensuring your presentations exude professionalism while adhering to standards like those from the American Society of Civil Engineers for infrastructure visuals.
Envision an oil and gas executive mapping drilling sites across the Sooner State: use these slides to animate territorial expansions, layering economic data over political boundaries for persuasive investor updates. The template's clean, modern style cuts through jargon, making it a favorite for educational modules on Native American heritage - Oklahoma's indigenous roots are subtly woven into contextual notes. At $15, it's an affordable gateway to elevated storytelling, with users reporting faster audience comprehension in high-stakes meetings, backed by design workflow insights from industry leaders.
Navigating Oklahoma's Political and Geographic Layers
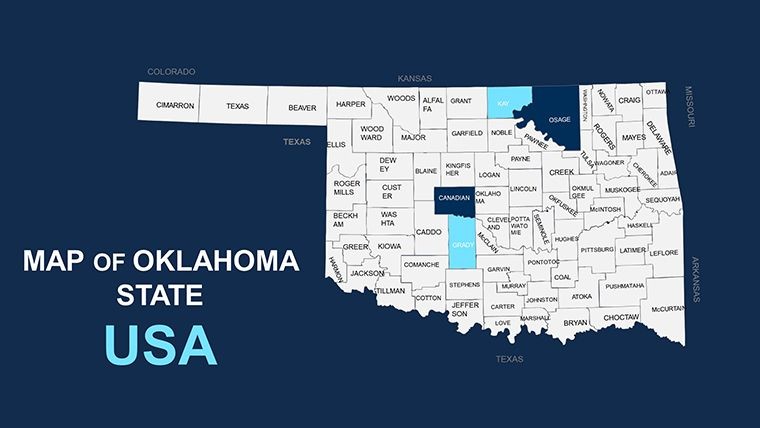
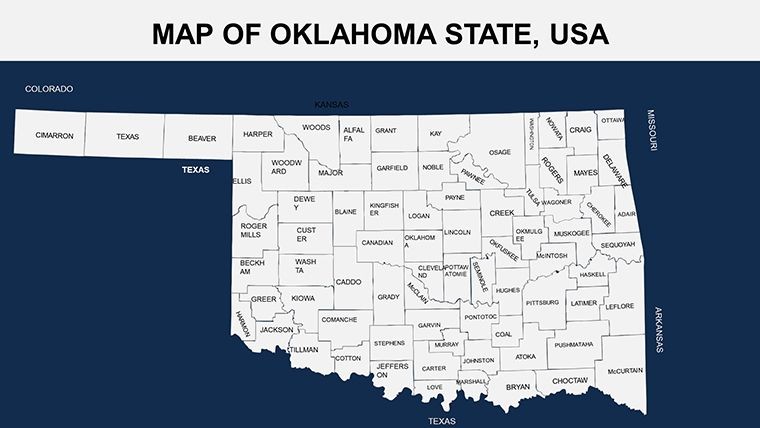
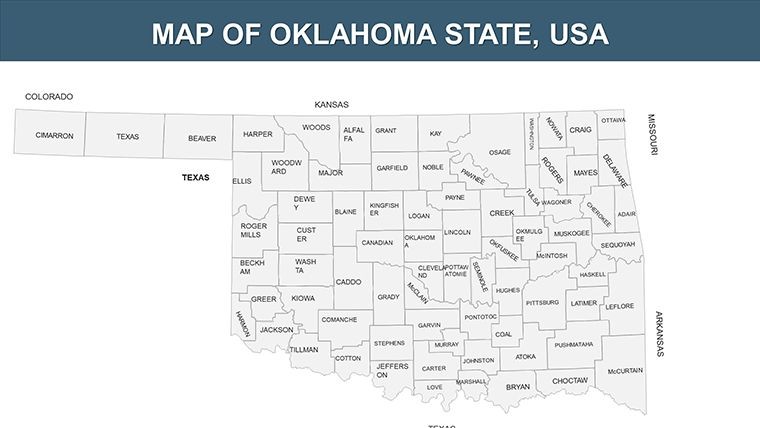
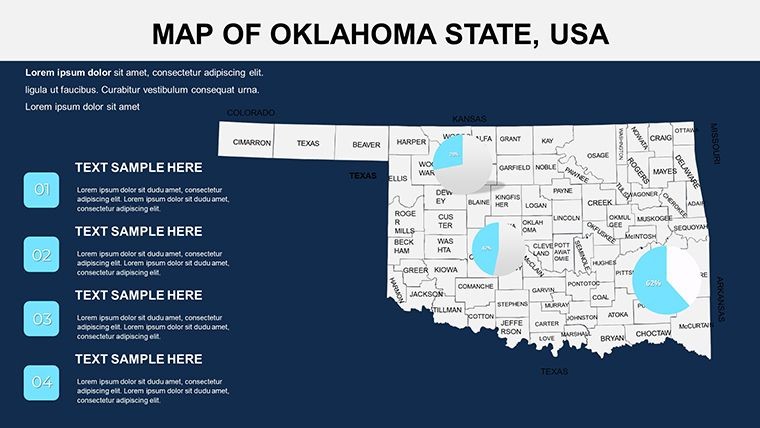
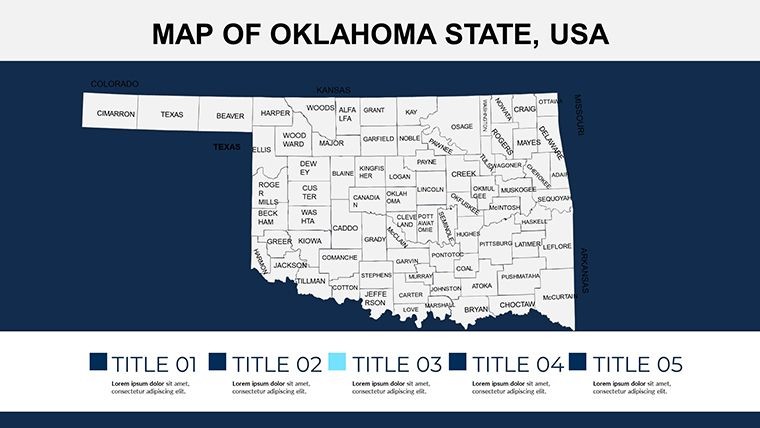
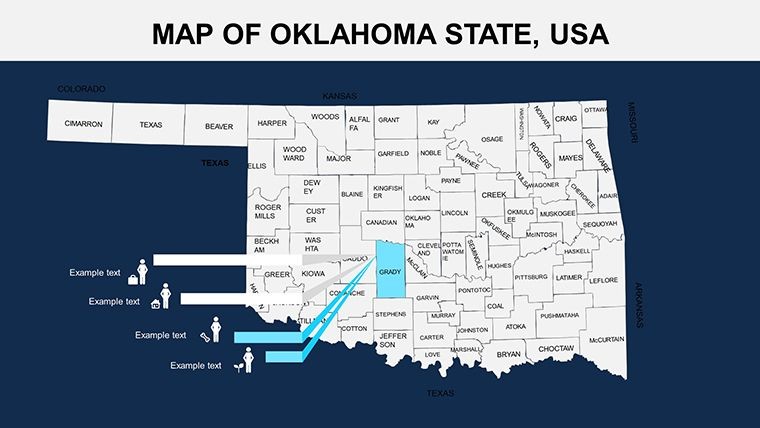
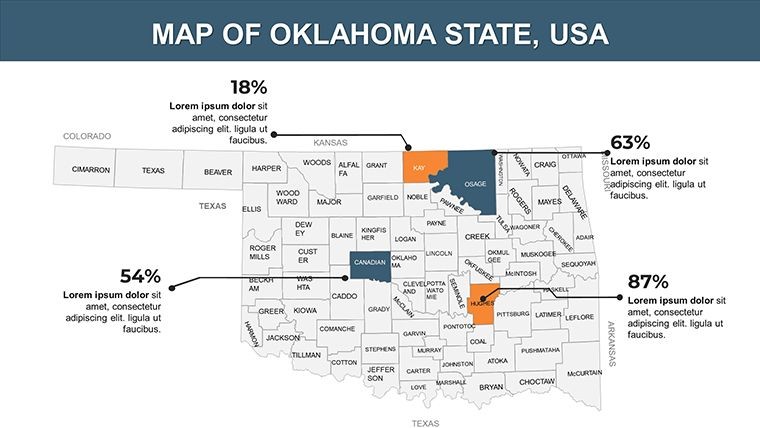
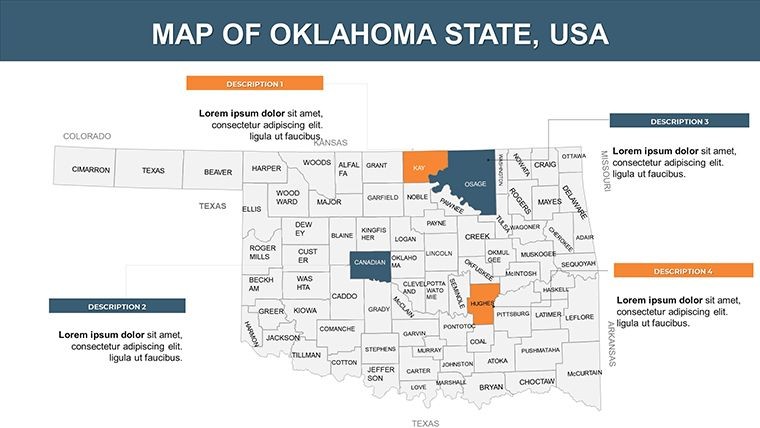
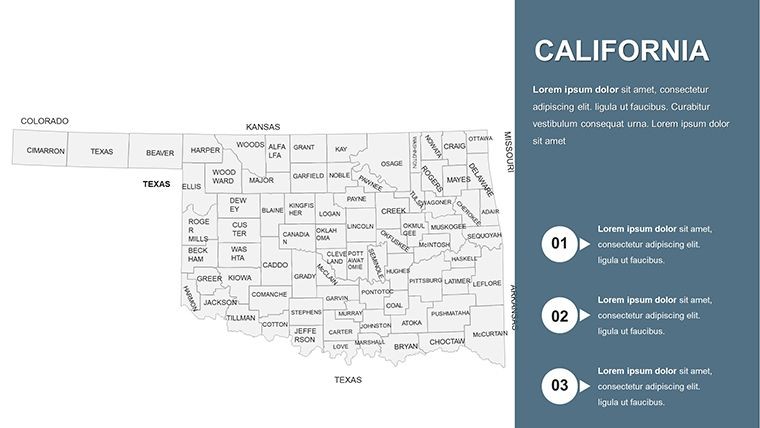
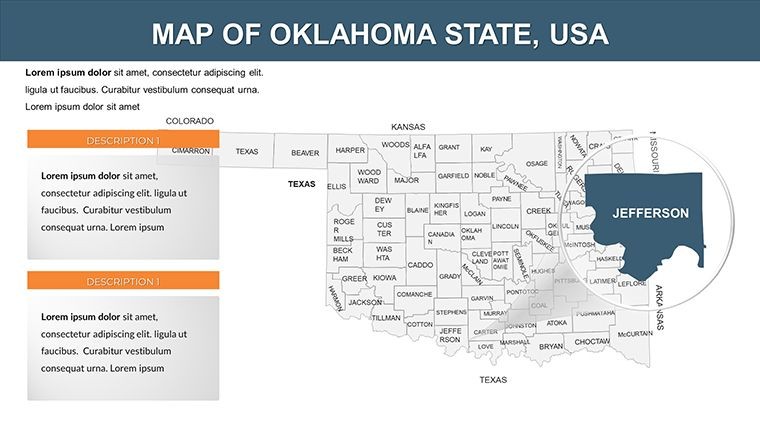
From the panhandle's windswept plains to the Ouachita Mountains' folds, this template captures Oklahoma's essence in editable detail. Slide 0 provides a statewide political map, perfect for overviews, while #7 zooms into congressional districts for nuanced policy discussions. Architects find value in integrating topo lines for site analysis, customizing colors to denote soil types or flood zones - essential for resilient building proposals. The hand-drawn infographics add a creative touch, differentiating your deck from cookie-cutter reports.
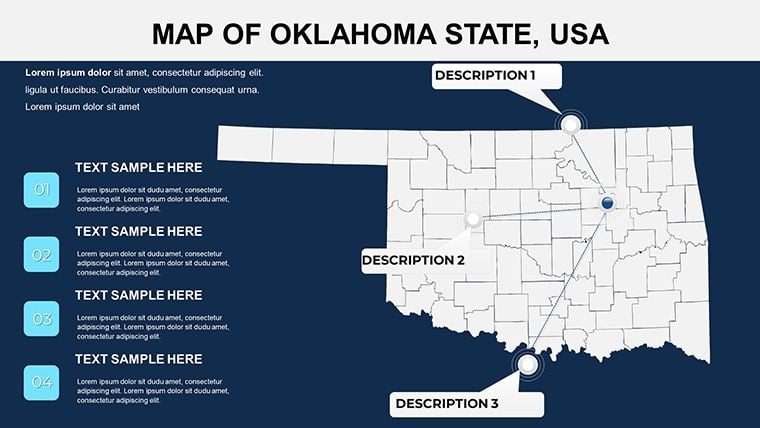
Inspired by minimalist design principles, the slides balance simplicity with depth. For energy pros, overlay pipeline routes on Slide 14, using animations to trace flows from Anadarko Basin to export points, vividly illustrating supply chain resilience. This approach, akin to case studies from Tulsa-based firms, has helped secure regulatory nods by clarifying environmental impacts.
Features Engineered for Excellence
- Political Map Mastery: Editable boundaries, counties, and cities with vector flexibility for precise modifications.
- Custom Animations: Object-by-object reveals, ideal for sequencing historical events or project phases.
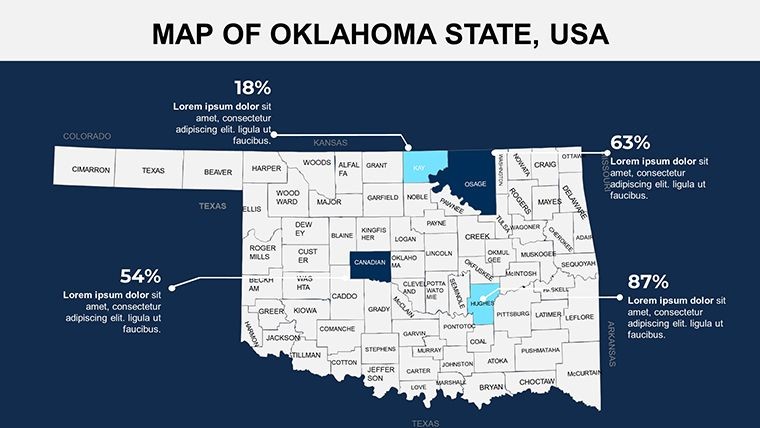
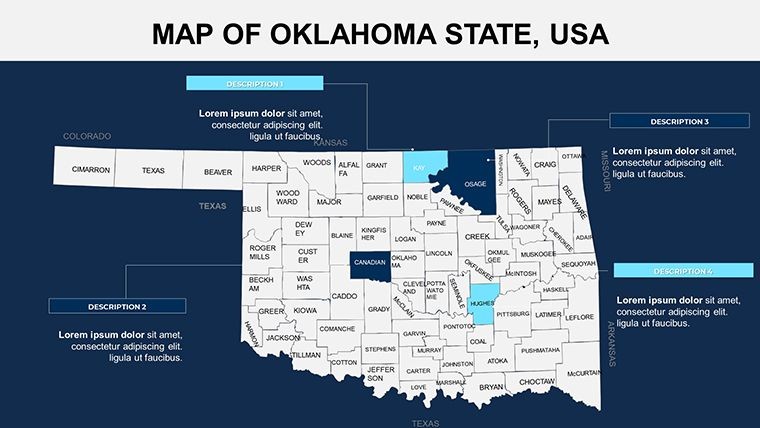
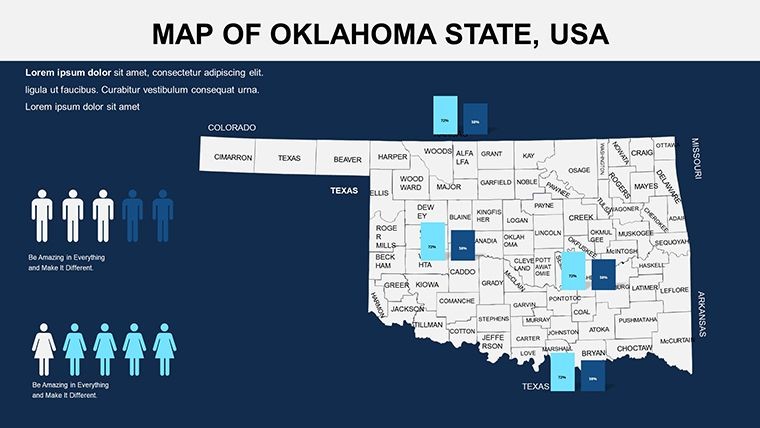
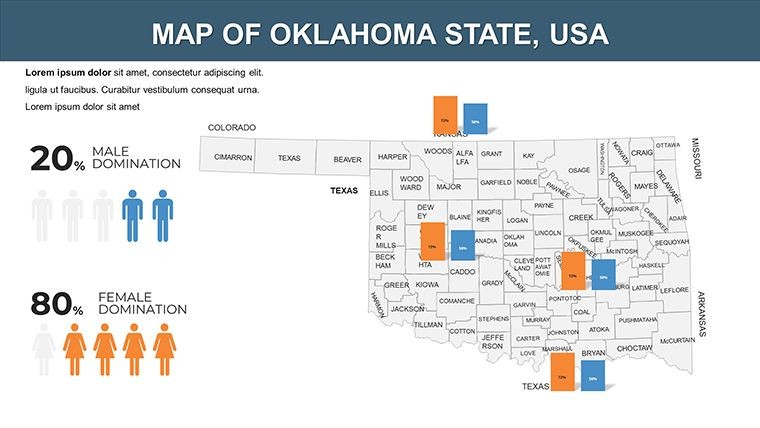
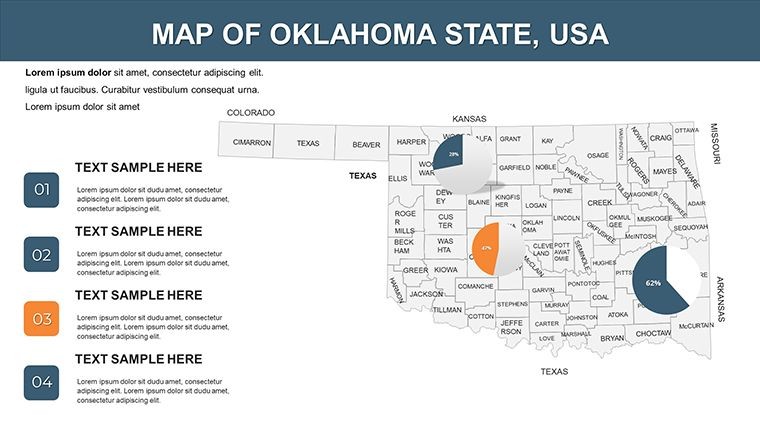
- Infographic Integration: Handmade elements like timelines and icons, enhancing data without complexity.
- Wide-Screen Ready: Optimized layouts for modern displays, with section breaks for organized flows.
- Easy Customization: Adjust fonts, grids, and axes effortlessly, using free resources for brand alignment.
These perks shine in practice; a planning consultant used animated district maps to advocate for urban renewal, boosting community approval rates significantly.
Versatile Applications in Key Sectors
Energy analysts thrive with this template, mapping reserves and transport networks to forecast market shifts - think animating fracking expansions for stakeholder briefings. In education, it facilitates lessons on Oklahoma's statehood, editing maps to highlight tribal lands and cultural migrations, meeting social studies benchmarks. Architects apply it to infrastructure bids, layering road grids over terrain for feasibility studies, as seen in successful highway project tenders.
Non-profits leverage it for advocacy, visualizing disaster recovery zones post-tornadoes, with color-coded severity levels to garner aid. The iPad compatibility enables remote edits during site visits, streamlining fieldwork to office transitions.
Streamlined Editing Process
- Launch and Explore: Open .key file to browse 26 slides, starting with the overview.
- Modify Maps: Select elements to recolor or reshape, incorporating local data like energy outputs.
- Add Dynamics: Apply animations to paths or symbols for engaging narratives.
- Infuse Graphics: Insert custom infographics, syncing with Keynote's smart guides.
- Review and Deploy: Test transitions, export for multi-format use.
Expert advice: Pair with documentation for quick guides, and use subtle humor in notes - like quipping about Oklahoma's "tornado alley" for lighter moments.
Superior to Standard Options
Free maps lack the polish and editability here - no more pixelated imports or rigid layouts. This template's innovative slides support hyperlinks to sources, building trust in data-driven talks. For creative twists, blend with photos of iconic routes like Route 66, crafting memorable heritage presentations.
Empower your narratives with Oklahoma's story - secure this Keynote map template and animate your vision now.
Frequently Asked Questions
How customizable are the political boundaries?Fully vector-based; stretch, color, or label districts and counties to fit your analysis.
Is it suitable for energy sector reports?Yes, with overlays for pipelines and reserves, animations highlight operational flows effectively.
Can animations be adjusted for pacing?Certainly - tweak durations per object for tailored reveals in educational or professional settings.
Does it cover historical contexts?Includes editable elements for timelines, ideal for statehood or indigenous history lessons.
What about iPad usage?Optimized for touch edits, great for on-site planning adjustments.
Good for
- Project roadmaps and sprint plans
- Product launch timelines
- Quarterly or annual review decks
- Company history and milestone summaries
Licence
reviews
Used the map slides for a regional sales presentation.
The highlighted areas were easy to edit.
I liked the simple color choices.
Some labels were too small at first.
FAQ
Will it work in Google Slides?
Are fonts embedded?
Can I use this for client work?
What's the refund policy?
Do you update the template after purchase?
Similar templates
See all Keynote Maps →
All 26 slides