 Click to zoom
Observe, Think, Do PowerPoint Diagrams: Empower Your Analysis
| Format | .pptx |
| Slides | 28 unique layouts |
| Aspect ratio | 16:9 |
| Compatibility | PowerPoint |
| Animated | No |
| Language | English |
| License | Commercial |
| File size | — |
| Version | v1.0 |
| Last updated | January 2022 |
What's inside
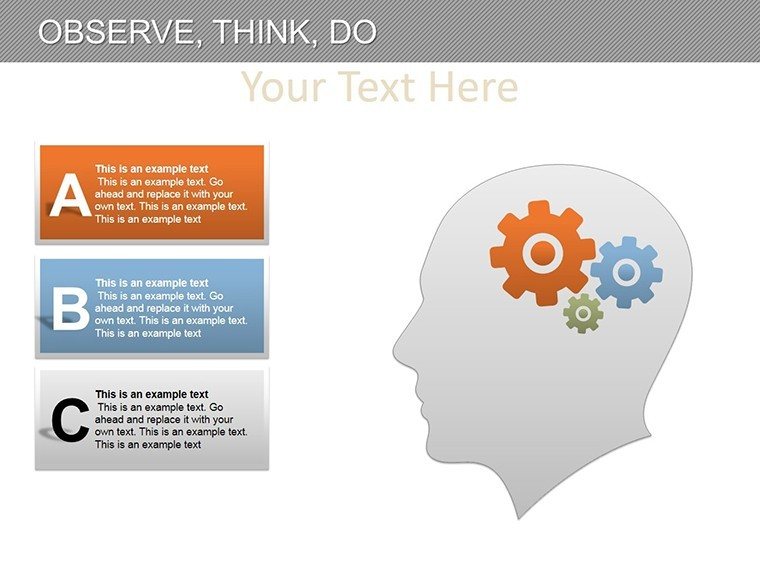
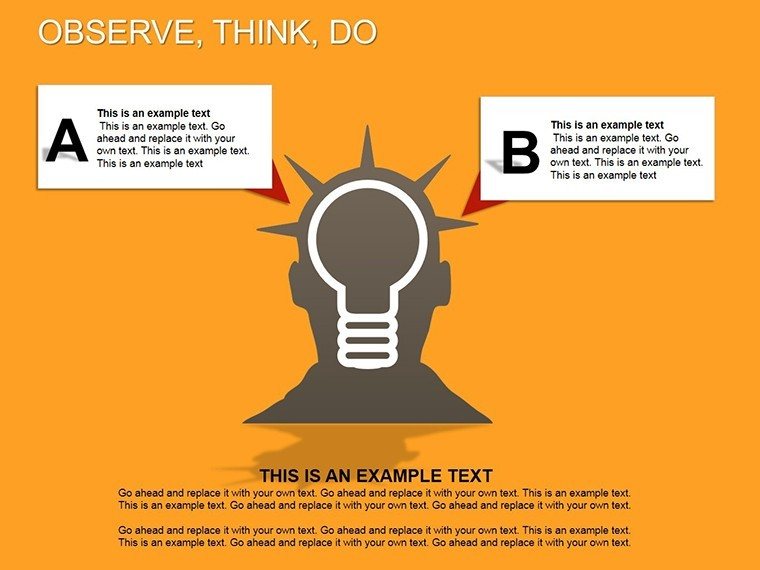
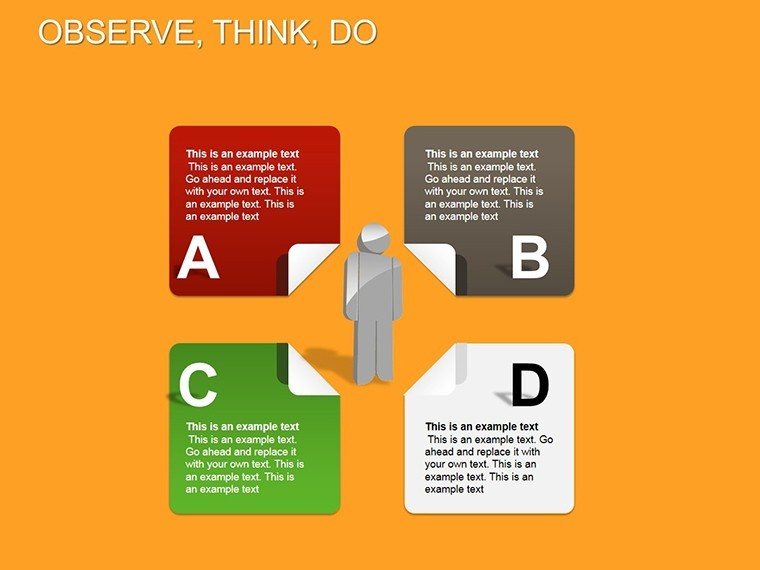
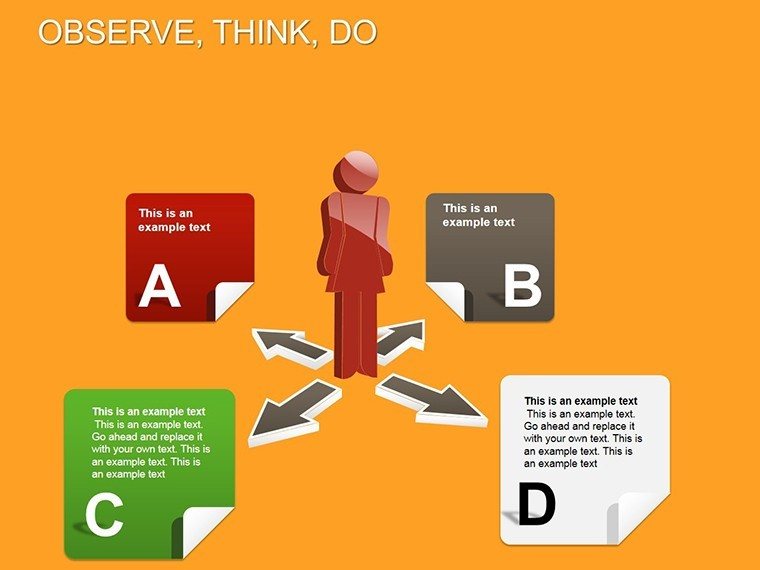
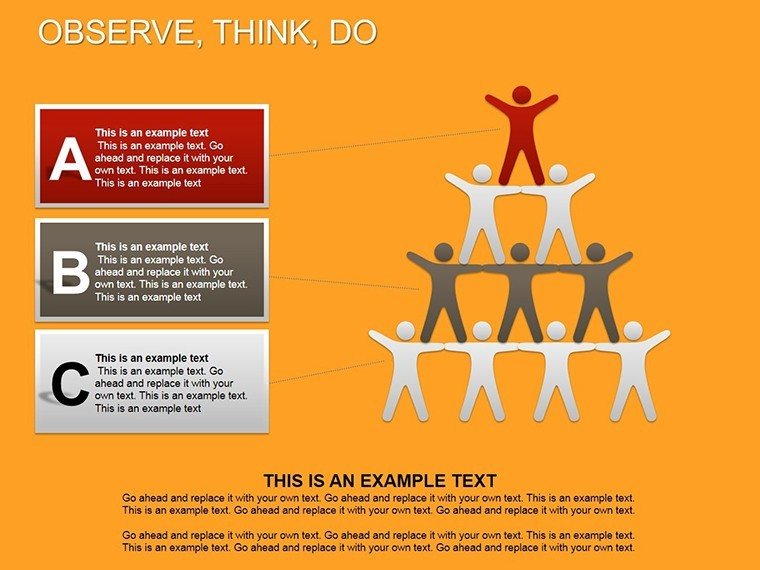
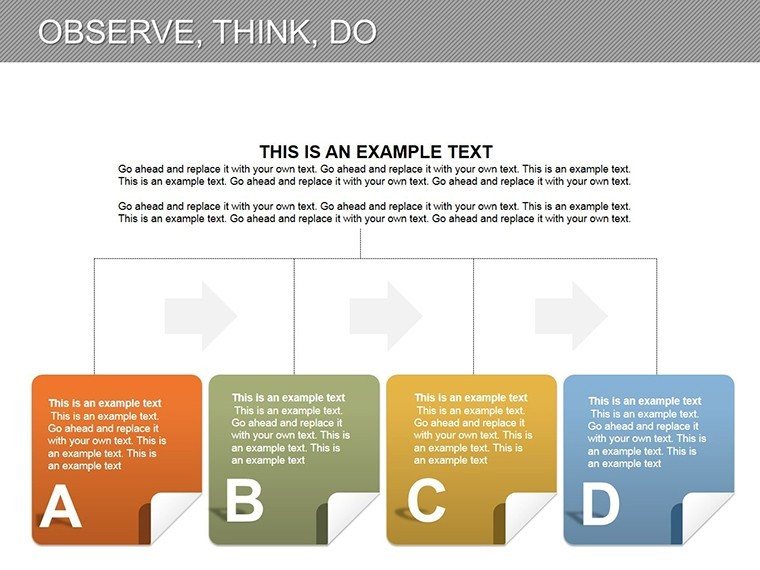
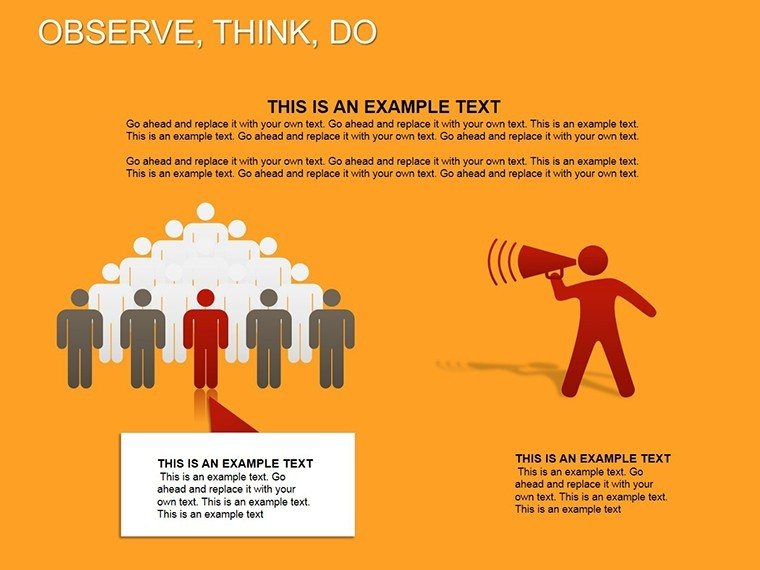
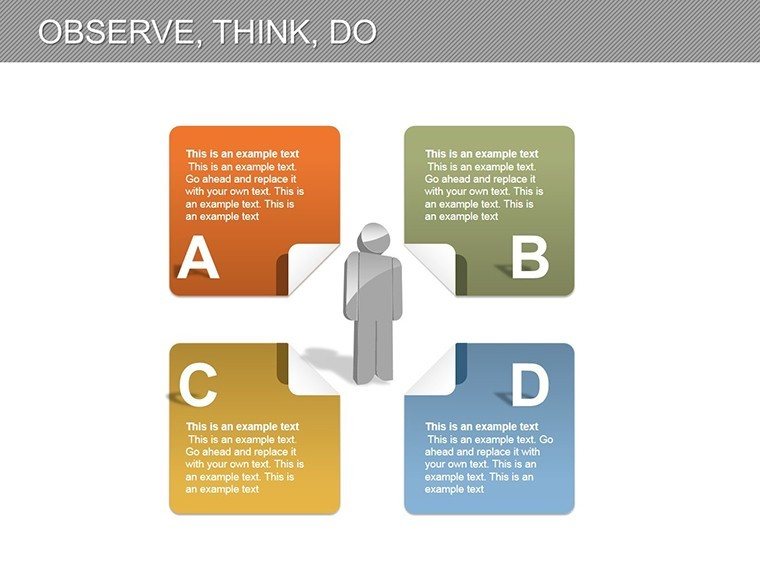
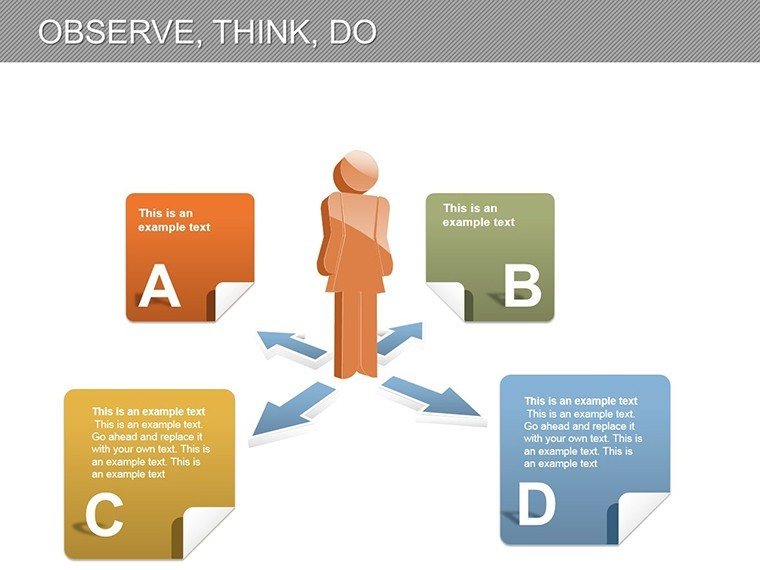
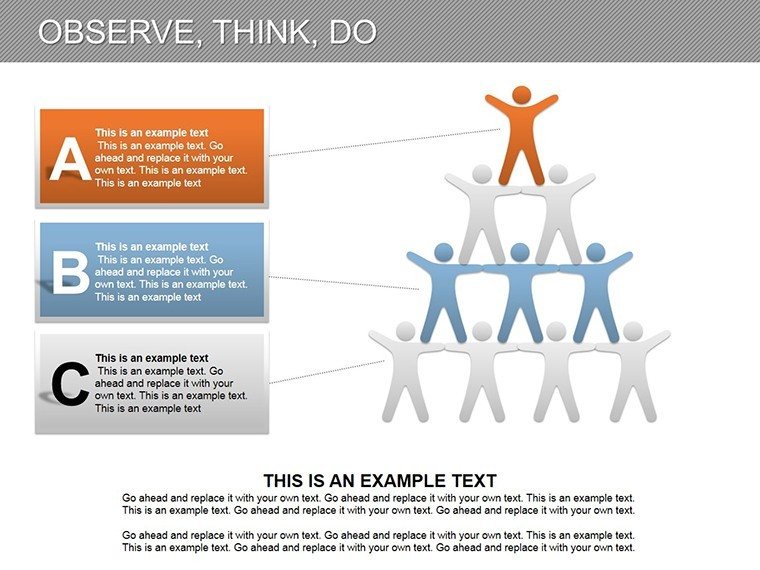
Picture this: You're in a high-stakes strategy session, unraveling complex data patterns that could redefine your project's trajectory. Our Observe, Think, Do PowerPoint Diagrams template equips you with 28 editable slides to navigate this journey seamlessly. Designed for analysts, researchers, and decision-makers, it embodies a cyclical approach - observe phenomena, think through implications, and do actionable steps. From statistical explorations in urban planning to process optimizations in manufacturing, these diagrams simplify diversity and complexity. Editable to your core, they allow for tailored visualizations that turn raw observations into strategic actions. Whether dissecting market volatilities or educational methodologies, this template fosters deep understanding, drawing on proven analytical frameworks to make your presentations authoritative and engaging. Embrace a tool that not only visualizes but accelerates your path from insight to implementation.
The Core Cycle: Observe, Think, Do in Action
At its heart, this template revolves around a proven methodology: Observe to gather data, Think to interpret, and Do to apply. In fields like data science, use it to chart statistical methods - starting with simple examples like trend spotting, then scaling to multifaceted scenarios. The slides' editability shines here, letting you adjust shapes, colors, and flows to mirror real complexities without losing clarity.
For professionals in analysis-heavy roles, this means bridging gaps between theory and practice. Consider a researcher observing consumer behaviors: Diagram initial data points, think through correlations via interconnected nodes, and outline do-steps like campaign adjustments. This structured flow enhances , positioning you as an expert with trustworthy visuals backed by logical progression.
Essential Features for Analytical Excellence
- Editable Diagrams: Modify every element to fit unique datasets or narratives.
- Statistical Focus: Built-in tools for representing methods, from basics to advanced.
- Versatile Applications: Adaptable across industries despite diverse complexities.
- High-Quality Layouts: Ensure professional polish for reports or pitches.
Inspired by analytical standards, these features include options for animations that simulate the cycle, adding dynamism to your storytelling.
Practical Applications Across Sectors
Dive into use cases: In business intelligence, observe market trends, think on impacts, and do with strategy pivots - visualized in looping diagrams for iterative refinement. Educators can apply to teaching cycles, observing student engagement, thinking on improvements, and doing curriculum tweaks.
A case from a consulting firm: Using these diagrams, they streamlined a client's supply chain analysis, reducing inefficiencies by 15% through clear visualization of observe-think-do phases. For urban planners, map environmental observations, think on sustainability implications, and do with policy recommendations. Tips: Layer data with charts for hybrid views; use color coding - blue for observe (cool collection), yellow for think (illuminating ideas), green for do (growth actions).
Comprehensive Slide Overview
- Observation Slides: Data collection templates with grids and charts.
- Thinking Diagrams: Mind maps and flowcharts for interpretation.
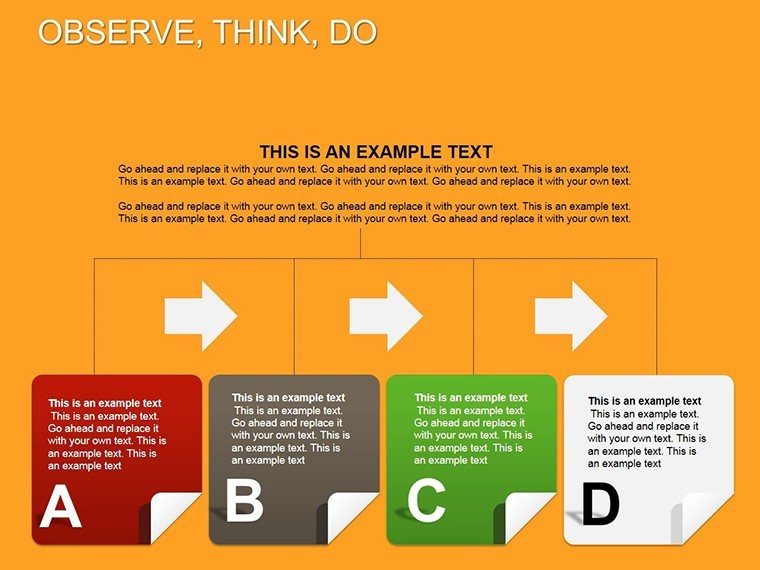
- Doing Action Plans: Step-by-step layouts for implementation.
- Integrated Cycles: Full-loop visuals for holistic reviews.
With 28 slides, cover nuances like variance analysis or scenario planning, all customizable for precision.
Workflow Enhancement and Best Practices
Integrate into PowerPoint workflows effortlessly, with compatibility for team shares. Best practice: Begin with objectives, populate with data, iterate based on feedback. In a statistical project, this led to faster insights, as per industry benchmarks.
Tackle challenges like data overload by focusing on key cycles; ensure accessibility with alt texts on diagrams. This user-centric design makes analysis intuitive, fostering better outcomes.
Unlock analytical prowess - grab this template and cycle through success.
Frequently Asked Questions
How flexible are the diagrams for different data?Fully editable to accommodate various statistical methods and complexities.Is it suitable for non-experts?Yes, simple structures guide users through the process.What industries benefit most?Analysis, research, business, education, and more.Can I animate the cycles?Absolutely, PowerPoint animations enhance the flow.Good for
- Project roadmaps and sprint plans
- Product launch timelines
- Quarterly or annual review decks
- Company history and milestone summaries
Licence
reviews
The workflow diagrams helped explain our system better.
I liked the cleaner backgrounds and spacing.
Some icons looked generic but okay.
The slides stayed readable after edits.
Honestly this saved me from making everything from scratch.
FAQ
Will it work in Google Slides?
Are fonts embedded?
Can I use this for client work?
What's the refund policy?
Do you update the template after purchase?
Similar templates
See all Powerpoint Diagrams →
All 28 slides