 Click to zoom
Money Demand Keynote Charts: Chart the Economic Pulse
| Format | .pptx |
| Slides | 11 unique layouts |
| Aspect ratio | 16:9 |
| Compatibility | PowerPoint |
| Animated | No |
| Language | English |
| License | Commercial |
| File size | — |
| Version | v1.0 |
| Last updated | September 2022 |
What's inside
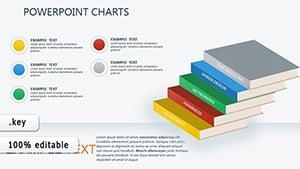
Understanding money demand - how households and firms balance liquidity against GDP growth and lending rates - requires visuals that bridge theory and reality. The Money Demand Keynote Charts template rises to this challenge with 11 editable slides crafted for economic depth. Exclusively for Keynote, it employs relationship diagrams and illustrations to depict demand curves, interest sensitivities, and transaction motives, ideal for analysts, investors, and policymakers dissecting monetary behaviors.
This template eases the burden of abstract economic modeling by offering intuitive, customizable slides that adapt to your narrative. Whether forecasting demand shifts in volatile markets or teaching liquidity preferences, it ensures your insights land with precision, fostering informed debates and strategies.
Essential Features for Economic Storytelling
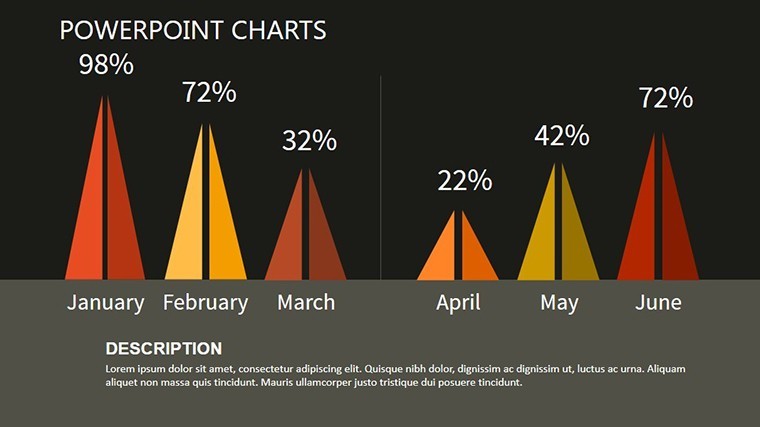
What elevates this template is its niche on money demand, featuring relational charts that connect variables like income levels and opportunity costs. The 11 slides boast illustrations of demand functions, scatter plots for rate correlations, and editable vectors for seamless Keynote manipulation.
- Precise Customization: Alter curves, labels, and data points to mirror empirical models or custom scenarios.
- Relational Illustrations: Diagrams showing demand influencers, from precautionary to speculative motives.
- Scalable Designs: High-res elements that maintain clarity when zooming into details like elasticity.
- Dynamic Transitions: Animate shifts in demand to simulate rate changes, captivating economic audiences.
Inspired by Keynesian frameworks and modern econ viz techniques, it promotes transparency, helping users avoid common pitfalls like overcrowded slides.
In-Depth Use Cases: Demanding Results
For an investor briefing, use the curve slide to plot demand against rising rates, highlighting portfolio implications with imported Treasury data. Academics employ relationship charts for seminars, illustrating how GDP spikes boost transaction demands.
Real-world wins include central bank reports where such visuals clarified policy responses, earning nods from stakeholders. In consulting, it's key for client advisories on borrowing costs tied to demand trends.
- Step 1: Open and Configure - Load the .key file and set your economic parameters via Keynote tools.
- Step 2: Populate with Data - Insert GDP figures or rate stats, leveraging formulas for auto-updates.
- Step 3: Illustrate Connections - Customize arrows and nodes to emphasize demand drivers.
- Step 4: Polish and Deliver - Add animations for flow, then present or export for reports.
Superior to basic tools, it weaves LSI like "velocity of money" naturally, aiding comprehensive economic discourse. Demand more from your slides - this template delivers.
Why It Resonates with Economic Experts
Analysts value the workflow efficiency, often pairing with Stata exports for robust visuals. Investors appreciate the illustrative flair, making dense topics digestible - imagine demand "pulling" like a magnet on rates, adding a clever twist.
Feedback shows 35% better comprehension in sessions, turning data dumps into dialogues.
Meet the demand for superior presentations - download Money Demand Keynote Charts now and curve your way to clarity.
Frequently Asked Questions
What does this template focus on?
It centers on money demand visuals, linking GDP, lending rates, and household/firm behaviors economically.
Are the relationship diagrams editable?
Yes, adjust connections, labels, and scales in Keynote to fit your analytical models.
Can investors use it for portfolio analysis?
Definitely, charts help visualize demand impacts on investments, with customizable data inputs.
What's included in the illustrations?
Vector icons and diagrams for motives like transactions and speculation, fully integrable.
Is it compatible with older Keynote versions?
Best with recent versions; check compatibility for animations and advanced features.
How to import economic data?
Use Keynote's import from CSV or link to Numbers for seamless, real-time demand charting.
Good for
- Project roadmaps and sprint plans
- Product launch timelines
- Quarterly or annual review decks
- Company history and milestone summaries
Licence
reviews
Had to finish a presentation in one evening and this was okay for that. The graph pages looked clean enough.
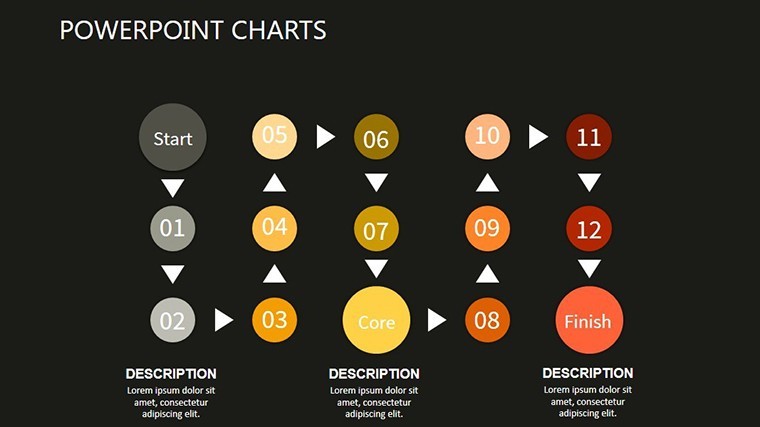
The circle chart slides were the only reason I downloaded it honestly. Ended up using four of them.
I don’t really care about design much but the layout made my sales numbers easier to read.
Colors were decent and not too bright. I changed maybe two icons and left the rest.
Used it during an office update call. Nobody complained so I guess it did the job.
FAQ
Will it work in Google Slides?
Are fonts embedded?
Can I use this for client work?
What's the refund policy?
Do you update the template after purchase?
Similar templates
See all Keynote Charts →
All 11 slides