 Click to zoom
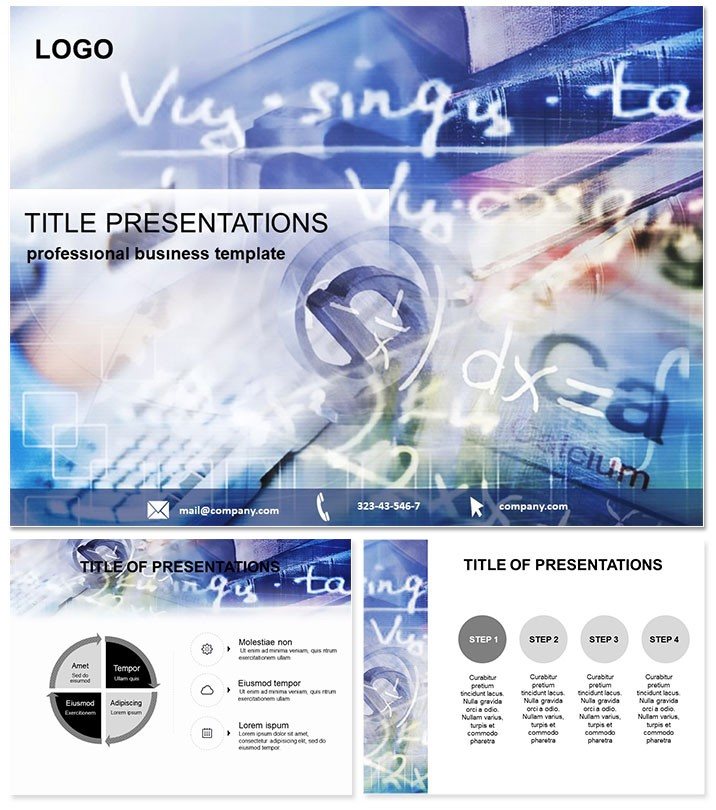
Mathematical Statistics PowerPoint Template
| Format | .pptx |
| Slides | 3 unique layouts |
| Aspect ratio | 16:9 |
| Compatibility | PowerPoint |
| Animated | No |
| Language | English |
| License | Commercial |
| File size | — |
| Version | v1.0 |
| Last updated | March 2019 |
What's inside
Make abstract numbers tangible and thrilling for your students or teams with this Mathematical Statistics PowerPoint Template. It`s the key to unlocking statistical insights that stick, fostering deeper understanding in every session.
Tailored for teachers, researchers, and analysts in science and computing, it demystifies variances and regressions through smart visuals. PowerPoint 2016+ compliant, it`s plug-and-play. Refine your approach today.
Visualize Stats with Precision Diagrams
Explore 28 diagrams dissecting probability distributions to hypothesis testing matrices, all geared for educational clarity. Harness 7 color schemes - from analytical grays to vibrant hypothesis highlights - to engage diverse learners.
Three masters and backgrounds form a robust base, with editable formulas intact. .jpg, .pot, .potx versatility. $22 once for perpetual access, lifetime value assured.
Core Features for Analytical Minds
- 28 Statistical Diagrams: Encompassing bell curves, scatter plots, and confidence intervals.
- 7 Insightful Color Schemes: Differentiate variables for computer science tie-ins.
- Formula-Ready Edits: Insert LaTeX-like equations without reformatting.
- PowerPoint 2016+ Fluid: Ideal for interactive classroom tech.
Surpasses plain charts by automating correlations, freeing you for interpretive depth over drudgery.
Impactful Applications in Learning Labs
Envision a stats seminar: Regression line diagrams predict outcomes, guiding discussions on real datasets like climate models, sparking innovation.
Project leads in data science use variance analyses to benchmark algorithms, streamlining team decisions. For lesson plans, sequential probability trees branch into what-if scenarios, captivating young minds.
An instructor saw quiz scores rise 30%, attributing it to the template`s visual scaffolding. From theorems to applications, it computes confidence.
Integration Blueprint
- Lock a master for syllabus branding.
- Embed R outputs for dynamic graph refreshes.
- Sequence reveals in p-value slides to build evidential tension.
Calculate your edge with this statistics diagram template.
Advanced Over Amateur Attempts
Default slides muddle metrics; this, calibrated by statisticians, clarifies. Supports Jupyter exports for reproducible research.
For online courses, modular sections facilitate bite-sized modules. Merge with Python scripts for live computations.
FAQ
Fits advanced probability units?
Yes, Bayesian network diagrams handle conditional complexities.
Works with statistical software links?
Seamlessly, for embedding SPSS or Excel visuals.
For non-math audiences?
Simplify layers to focus on story over symbols.
Schemes for color-blind users?
Pattern-inclusive options ensure inclusive access.
Animations for theorem proofs?
Stepwise builds illustrate inductive steps engagingly.
Good for
- Project roadmaps and sprint plans
- Product launch timelines
- Quarterly or annual review decks
- Company history and milestone summaries
Licence
reviews
Our data science team used this for a statistical modeling workshop and the bell curves and scatter plots were a huge help. The hypothesis testing matrices and confidence intervals are very detailed.
The analytical grays and vibrant hypothesis highlights color schemes are perfect for academic presentations. The regression line diagrams and probability trees are well thought out.
Used this for a research seminar and the laTeX-like equations and p-value slides helped us explain our findings. The audience actually understood the complex stats for once.
Not bad but a bit too math heavy for a general audience
the bayesian network diagrams and variance analyses are best for statisticians. The R and python integrations are a nice bonus though.
Good for computer science students
the formula-ready edits and pattern-inclusive options for color-blind users are well designed. The jupyter exports are a nice touch.
FAQ
Will it work in Google Slides?
Are fonts embedded?
Can I use this for client work?
What's the refund policy?
Do you update the template after purchase?
Similar templates
See all PowerPoint Templates →

All 1 slides