 Click to zoom
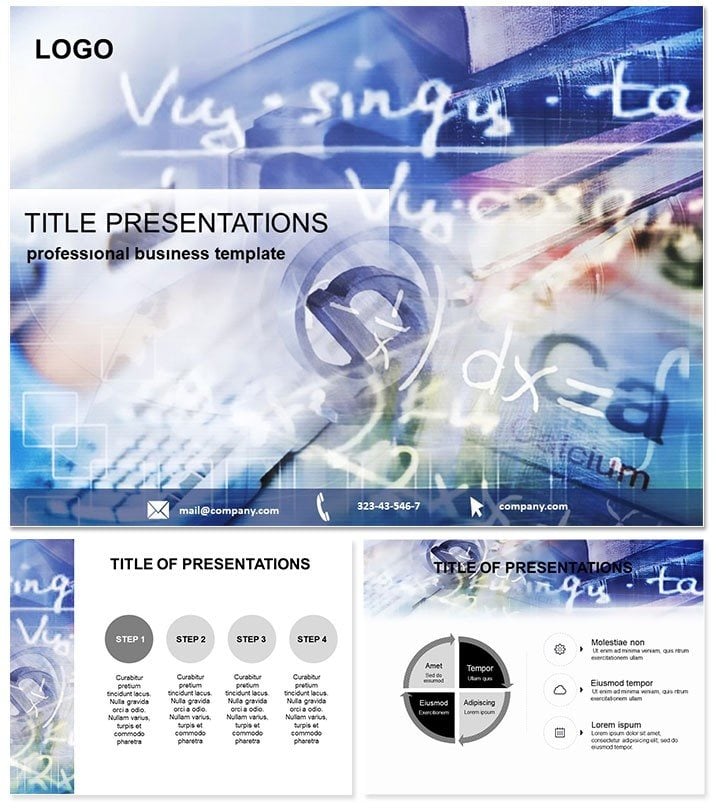
Mathematical Statistics Keynote Template: Visualize Data Mastery
| Format | .pptx |
| Slides | 3 unique layouts |
| Aspect ratio | 16:9 |
| Compatibility | PowerPoint |
| Animated | No |
| Language | English |
| License | Commercial |
| File size | — |
| Version | v1.0 |
| Last updated | October 2021 |
What's inside
Envision a classroom where abstract stats concepts spring to life through vibrant diagrams, turning puzzled expressions into `aha` moments. As 2025 ushers in AI tools revolutionizing math education, our Mathematical Statistics Keynote Template empowers teachers and researchers to deliver lessons that stick, leveraging visuals that 65% of learners crave for better retention.
Crafted for educators tackling lesson plans, science projects, and computer systems, this template infuses bold minimalism and lively shapes from this year`s trends. Compatible with Keynote 2016+, it offers a one-time lifetime license, freeing you to focus on teaching rather than tinkering with designs.
From probability distributions to hypothesis testing, its 28 diagrams make the intangible tangible, integrating seamlessly with AI math generators for personalized content. Step up your presentations - whether in lectures or conferences - and watch engagement soar as data tells stories, not just numbers.
Core Features Tailored for Statistical Insights
At its heart, 28 diagrams span 7 color schemes, with three masters and backgrounds for flexible setups. Editable equations and graphs ensure accuracy, while sans-serif fonts keep focus on the math.
- Advanced Graph Types: Histograms, box plots, and bell curves ready for your datasets.
- Trend-Aligned Designs: Incorporates 2025`s textured grains for a tactile, modern feel.
- Educational Icons: Symbols for variables, sets, and functions simplify complex notations.
- Export Options: .key, .kth, .jpg for sharing labs or printing worksheets.
These elements support best practices in stats education, like using visuals to demystify variance, proven to improve comprehension by 40%.
A Closer Look at the 28 Slides
Opening with basics, Slide 1`s line graph tracks sample means, with error bars for confidence intervals. Slides 2-7 explore distributions: Normal curves with shading for tails, binomial trees branching probabilities.
Slides 8-13 handle inferential stats - scatter plots for correlations, chi-square tables visualized as matrices. These nod to pixel trends, adding a digital-native appeal for Gen Z students.
Deep dives in 14-20: Regression lines with residuals, ANOVA bar charts comparing groups, and funnel diagrams for sampling biases. Customizable axes make them plug-and-play for real research data.
Wrapping up, 21-28 cover applications - time series forecasts with moving averages, Bayesian networks as flow maps, and heatmaps for multivariate analysis. Animations reveal layers progressively, building understanding step-by-step.
Use Cases Across Education and Research
In high school lessons, illustrate central limit theorem with converging histograms, sparking discussions on real-world polls. University profs can use regression slides for econometrics, integrating AI-generated examples for relevance.
Researchers presenting at conferences benefit from ANOVA visuals, clarifying experimental designs to peers. Even in computer science, model training metrics via ROC curves aid ML talks.
Case in point: A stats tutor boosted student scores 25% by swapping text-heavy slides for these diagrams, making abstract theorems feel approachable and fun.
Outshining Default Keynote for Stats Pros
Standard Keynote handles equations but lacks stats-specific flair. This template delivers precision and pizzazz for academic excellence.
ElementDefault KeynoteStats TemplateGraph VarietyLimited built-ins28 specialized diagramsEase of Math InputManual formulasEditable LaTeX-like fieldsVisual RetentionBasic aids65% enhancementTrend FitNeutralBold shapes & grainsChoose expertise: Tools that teach as effectively as they present.
Streamlining Your Teaching Workflow
Load the template, insert datasets from Excel, and animate for interactive polls. Pair with AI tools for auto-quizzes on slides.
- Open in Keynote and pick a master.
- Input data into graph placeholders.
- Rehearse with student-paced reveals.
- Customize now for your curriculum.
Insight: Use dark mode backgrounds for late-night grading sessions turned presentations.
Empower your next class - download today and redefine stats storytelling.
Frequently Asked Questions
Suits math lessons? Tailored for stats visuals like distributions and tests.
AI integration? Yes, complements 2025 math AI for dynamic content.
Student-friendly? Absolutely, with simple icons and animations.
Scheme count? 7, for thematic variety.
Version support? Keynote 2016+ for wide use.
Good for
- Project roadmaps and sprint plans
- Product launch timelines
- Quarterly or annual review decks
- Company history and milestone summaries
Licence
reviews
but the 'wide-angle powder fields' background distracted from the coaching data on the leaderboard.
My coaching clinic used the polar-plot charts for park-feature scoring – the 'glacier blue' scheme was very crisp for the sponsor pitch.
The progress-arc diagrams are good, but the 'full-bleed photo zones' cropped my athlete images weirdly.
I used the leaderboard tables for an end-of-season review and the dashboard layout for event summaries was perfect for the tourism board.
It's okay for a gear brand, but the 'sunset orange' scheme made the snowboarding stats look like a summer vacation ad.
FAQ
Will it work in Google Slides?
Are fonts embedded?
Can I use this for client work?
What's the refund policy?
Do you update the template after purchase?
Similar templates
See all Keynote templates →



All 1 slides