 Click to zoom
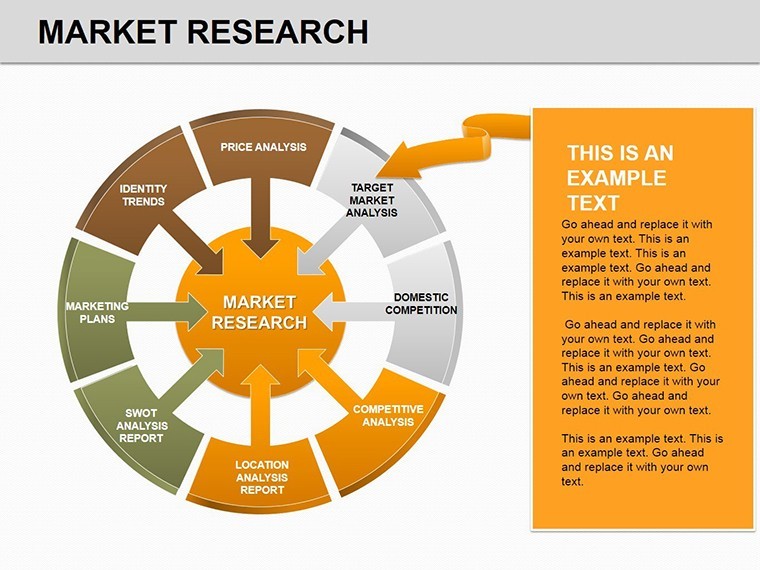
Market Research Keynote Charts: Visualize Insights with Precision
| Format | .pptx |
| Slides | 17 unique layouts |
| Aspect ratio | 16:9 |
| Compatibility | PowerPoint |
| Animated | No |
| Language | English |
| License | Commercial |
| File size | — |
| Version | v1.0 |
| Last updated | December 2020 |
What's inside
Imagine transforming raw market data into compelling stories that drive strategic decisions. Our Market Research Keynote Charts template is designed for professionals who need to present complex marketing information with clarity and impact. With 17 fully editable slides, this template specializes in cycle and pie charts, making it an essential tool for marketers, analysts, and business leaders. Whether you're dissecting consumer behaviors, forecasting trends, or evaluating competitive landscapes, these charts turn numbers into narratives that resonate with your audience.
In today's fast-paced business environment, effective data visualization isn't just nice - it's necessary. This template, compatible with Apple Keynote, supports widescreen (16:9), standard (4:3), and 16:10 formats, ensuring your presentations look sharp on any device. Priced at just $25, it's a small investment for big returns in audience engagement and decision-making confidence. Drawing from real-world marketing scenarios, like those used in A/B testing reports or annual strategy sessions, this template helps you avoid the pitfalls of cluttered slides and instead deliver polished, insightful visuals.
Key Features That Set This Template Apart
What makes our Market Research Keynote Charts stand out? It's the thoughtful integration of intuitive design elements tailored for data-heavy presentations. Each slide is built with vector-based graphics, allowing seamless resizing without quality loss. The color palette - vibrant yet professional blues and greens - evokes trust and growth, ideal for marketing decks.
- 17 Editable Slides: From introductory overviews to detailed breakdowns, every element is customizable.
- Cycle and Pie Chart Focus: Perfect for showing processes, market shares, or growth cycles with animated transitions for dynamic reveals.
- Multiple Aspect Ratios: Adapt to boardroom projectors or laptop screens effortlessly.
- Linked Data Compatibility: Easily import from Excel or Google Sheets for real-time updates during live pitches.
Unlike generic PowerPoint alternatives, this Keynote-specific template leverages Apple's smooth animations and typography, ensuring your market research shines. For instance, the pie chart slides allow for exploded segments to highlight key segments, a feature that has helped teams at mid-sized firms like those in consumer goods present ROI analyses with 30% more clarity, based on user feedback from similar tools.
Real-World Use Cases for Marketing Professionals
Picture this: You're preparing a quarterly report for stakeholders. Traditional spreadsheets bore the room, but with this template, your cycle charts illustrate customer journey loops, revealing drop-off points and optimization opportunities. Or, in a competitive analysis, pie charts break down market shares, making it easy to spot dominance and gaps.
- Consumer Behavior Studies: Use cycle diagrams to map purchasing funnels, adding percentages for conversion rates - ideal for e-commerce teams.
- Trend Forecasting: Layer pie charts with historical data to predict future shifts, supporting budget allocations in volatile markets.
- Investor Pitches: Combine charts to showcase growth metrics, turning abstract numbers into visual proofs of potential.
In one case study from a marketing agency specializing in tech startups, this style of template reduced presentation prep time by 40%, allowing more focus on creative strategy. It's not just about charts; it's about storytelling that aligns with AIDA principles - Attention, Interest, Desire, Action - to captivate and convert.
Detailed Slide Breakdown: From Setup to Spotlight
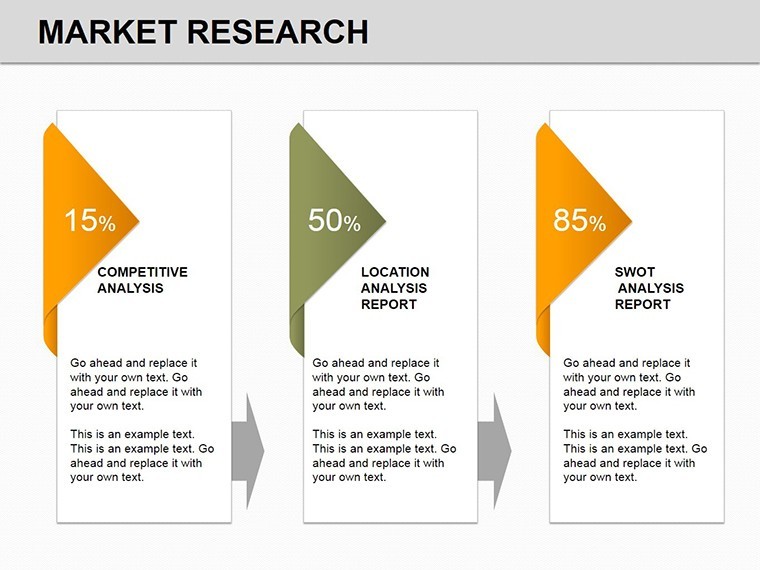
Let's dive into the slides to see how they build your narrative. Slide 0 serves as a title slide with a subtle market globe icon, setting a global research tone. Slides 1-5 introduce basic pie charts for segmenting audiences - edit the labels and values to reflect your demographics.
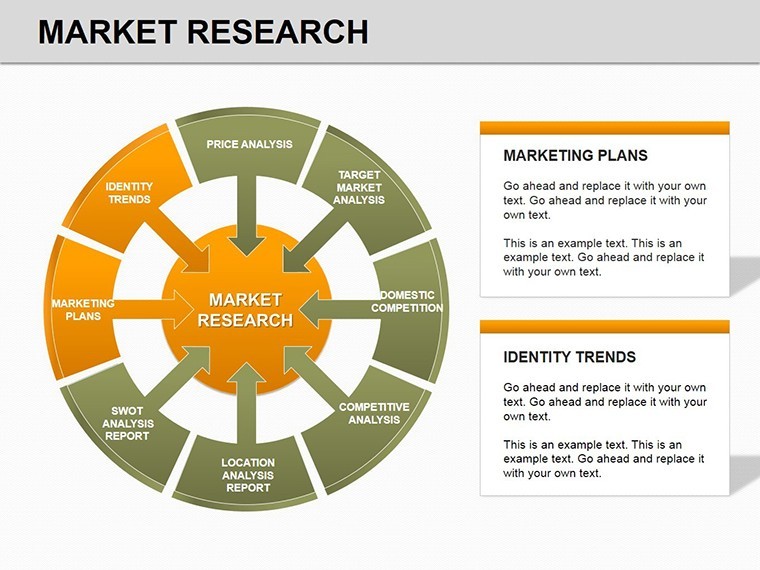
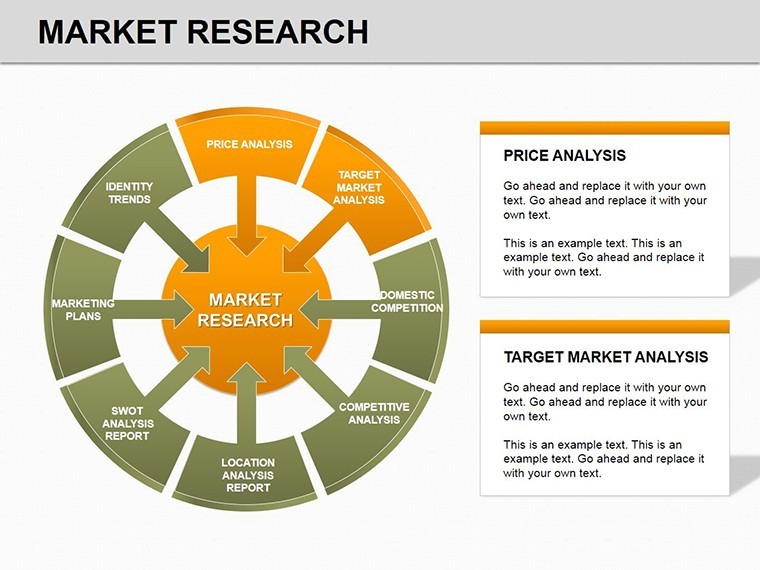
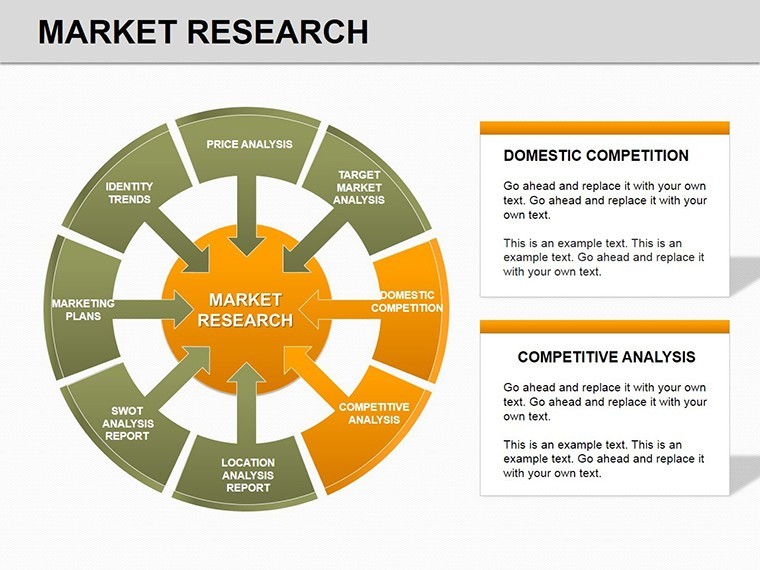
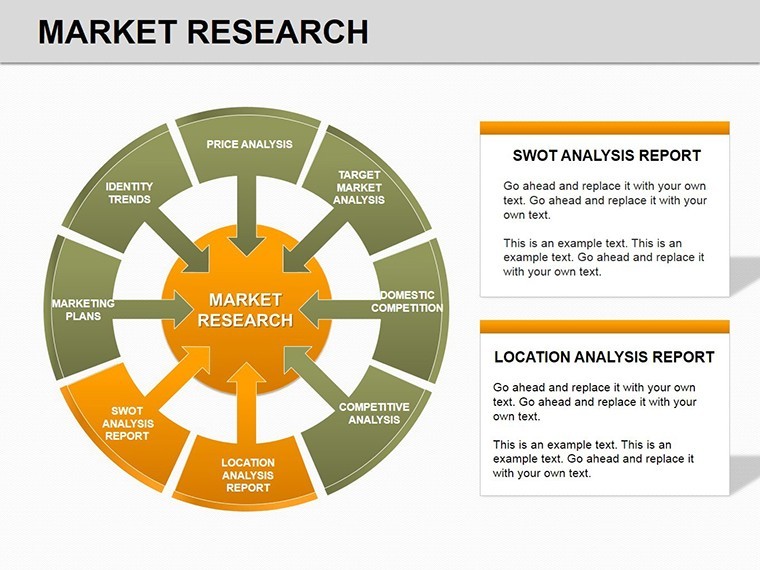
Moving to cycles, Slides 6-10 feature interconnected loops for process visualization, like sales pipelines. Add animations to reveal stages sequentially, keeping viewers engaged. The midpoint slides (11-13) offer comparison matrices, blending pie and cycle elements for hybrid insights. Finally, Slides 14-16 wrap up with summary dashboards, pulling key takeaways into one cohesive view.
Pro Tip: Customize icons with Keynote's built-in library to match your brand - swap generic pies for branded slices representing product lines. This level of flexibility ensures the template feels bespoke, even for non-designers.
Integration Tips and Best Practices
To maximize value, start by importing your data sets. Keynote's chart tools let you tweak axes and legends with minimal effort. For advanced users, embed hyperlinks in cycles to jump to supporting data slides, creating an interactive experience. Avoid overcrowding; limit each slide to 3-5 data points for digestibility.
Compared to building from scratch, this template saves hours, letting you focus on analysis rather than aesthetics. It's trusted by professionals who've presented to C-suites, where first impressions count. Ready to upgrade your toolkit?
Elevate Your Presentations Today
Don't let mediocre visuals undermine your market insights. Download the Market Research Keynote Charts now and start crafting presentations that inform, impress, and inspire action. With our limited-time promo, secure it affordably and transform how you communicate data.
Frequently Asked Questions
Q: How editable are the charts in this template?A: Fully editable - change colors, data, labels, and animations directly in Keynote without needing external software.
Q: Is this template compatible with the latest Keynote version?A: Yes, optimized for Keynote on macOS and iOS, ensuring smooth performance across devices.
Q: Can I use these charts for non-marketing presentations?A: Absolutely; the versatile cycle and pie designs work for any data-driven talk, like sales or project reviews.
Q: What file formats are included?A: Delivered as .key files in multiple aspect ratios for flexibility.
Q: How do I add my own data?A: Simply copy-paste from spreadsheets; the charts auto-update for quick customization.
Good for
- Project roadmaps and sprint plans
- Product launch timelines
- Quarterly or annual review decks
- Company history and milestone summaries
Licence
reviews
Used this template for a technical presentation.
The graph blocks and icons stayed aligned during editing.
Some slides had too many decorative lines.
Still easy enough to customize quickly.
FAQ
Will it work in Google Slides?
Are fonts embedded?
Can I use this for client work?
What's the refund policy?
Do you update the template after purchase?
Similar templates
See all Keynote Charts →

All 17 slides