 Click to zoom
Manufacturing Process and Production Cycle PowerPoint Charts: Optimize Your Workflow Narratives
| Format | .pptx |
| Slides | 15 unique layouts |
| Aspect ratio | 16:9 |
| Compatibility | PowerPoint |
| Animated | No |
| Language | English |
| License | Commercial |
| File size | — |
| Version | v1.0 |
| Last updated | August 2023 |
What's inside
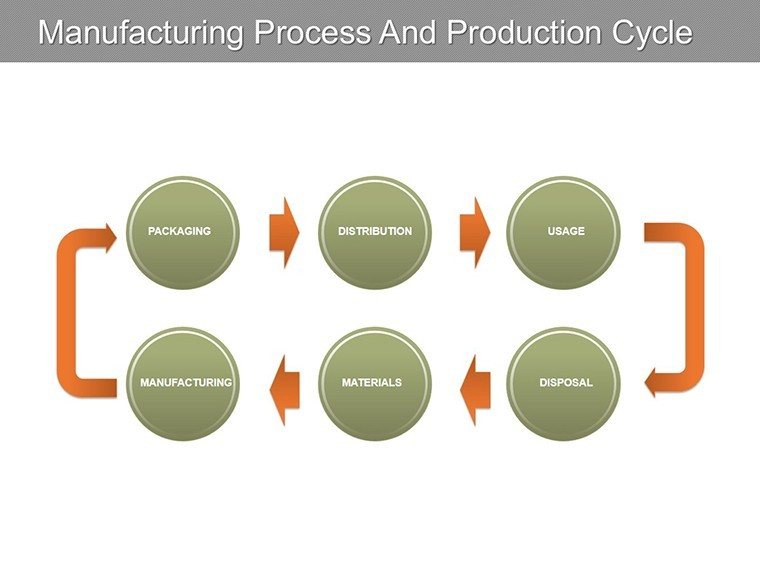
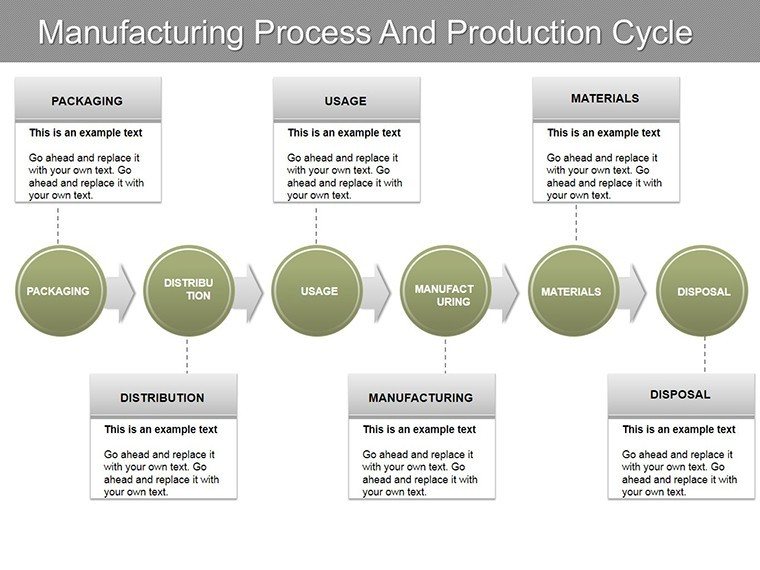
Envision mapping out intricate manufacturing journeys with visuals that simplify the complex, turning assembly lines into engaging tales of efficiency. This Manufacturing Process and Production Cycle PowerPoint Template is your ally in demystifying production stages, perfect for managers overseeing factory operations or consultants advising on lean strategies. Boasting 15 editable slides, full compatibility with PowerPoint and Google Slides, and a focus on pie charts, arrows, and process flows, it empowers you to highlight bottlenecks, celebrate milestones, and drive improvements. Forget convoluted diagrams; embrace clarity that resonates with teams and stakeholders alike, fostering better understanding and collaboration in high-stakes environments.
Unique Advantages of Our Manufacturing Template
What elevates this template is its tailored approach to industrial storytelling. Arrows guide the eye through sequential steps, while pie charts break down resource allocations with precision. Customize hues to reflect safety zones - green for smooth operations, red for alerts - or scale diagrams to fit global supply chains. Compared to generic PowerPoint tools, which lack sector-specific nuance, these charts incorporate manufacturing best practices, like those from ISO 9001 standards, ensuring compliance and professionalism. For example, use them to depict just-in-time inventory flows, reducing waste as per Toyota Production System principles, or analyze cycle times in automotive assembly, making data actionable and insightful.
Essential Features for Industrial Precision
Explore features built for the factory floor. Editable arrows allow for dynamic process mapping, with options to add milestones or decision points. Pie charts offer segmented views of production shares, easily updated via linked data tables. Benefits include accelerated training sessions, where new hires grasp workflows faster, and enhanced reporting for C-suite reviews. Aligned with authoritative sources like the American Society of Mechanical Engineers (ASME), the designs promote ergonomic visualization, minimizing cognitive load. Integrate into ERP system overviews or quality control audits, where the visual flow can illustrate defect reduction strategies, turning raw metrics into strategic assets.
Detailed Slide Overview: Building Blocks of Production
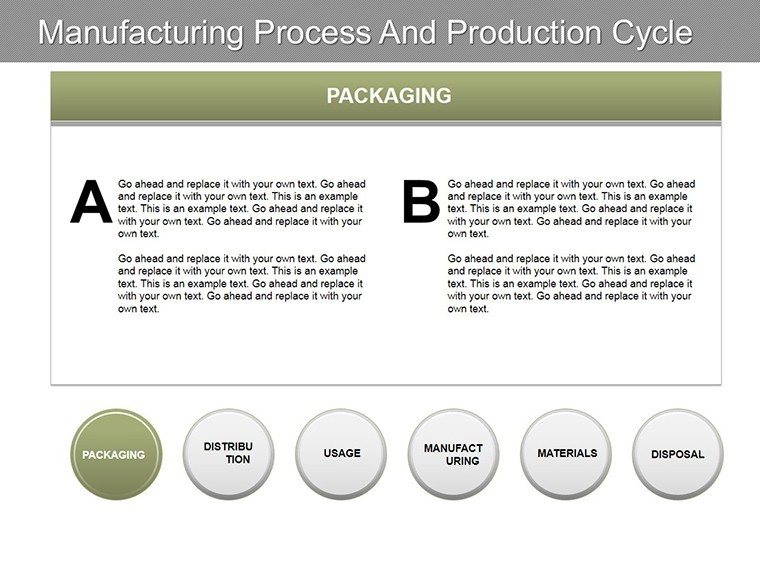
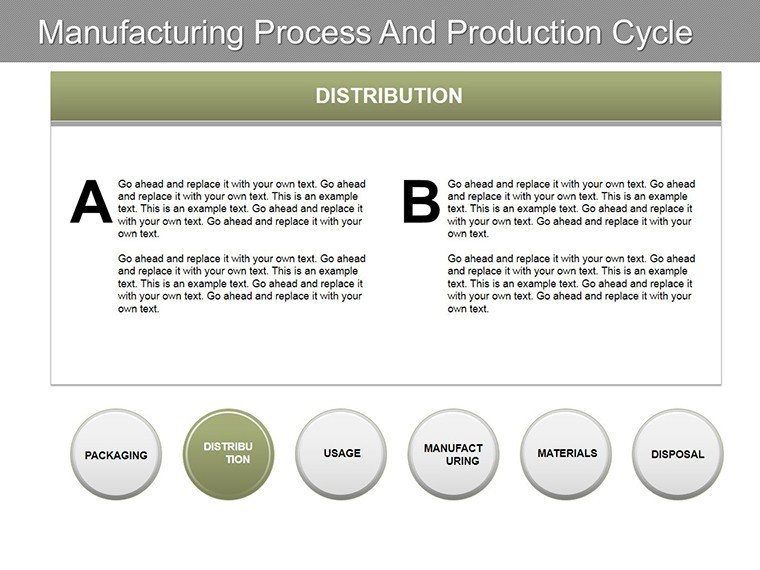
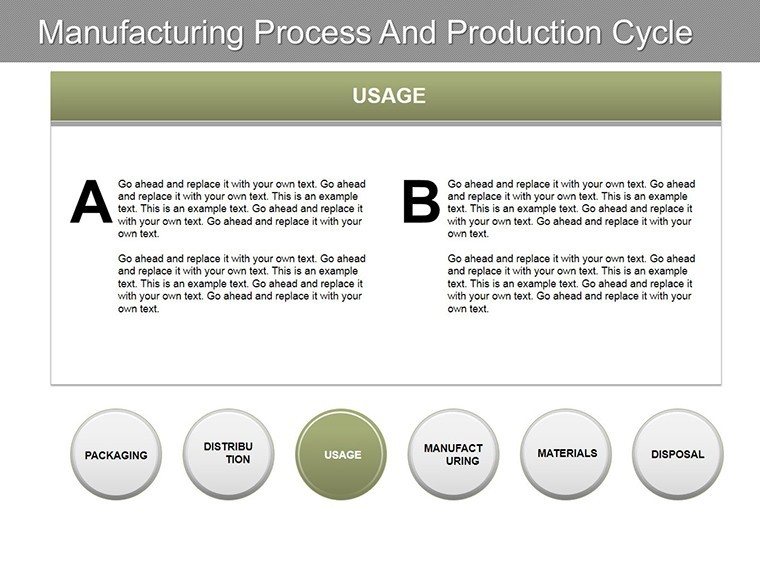
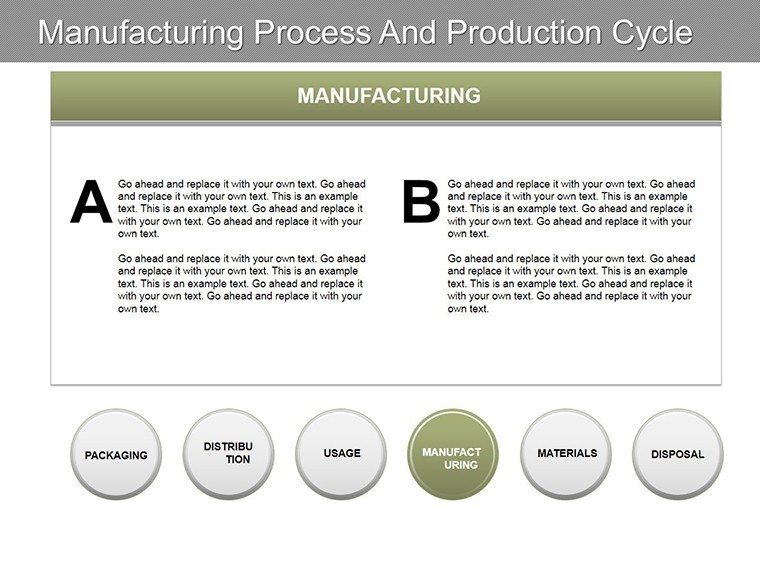
- Slide 1-4: Core Process Flows - Arrow-based sequences for basic cycles, great for introductory overviews of assembly lines.
- Slide 5-8: Pie Chart Analyses - Breakdowns of resource use, like material vs. labor costs in manufacturing batches.
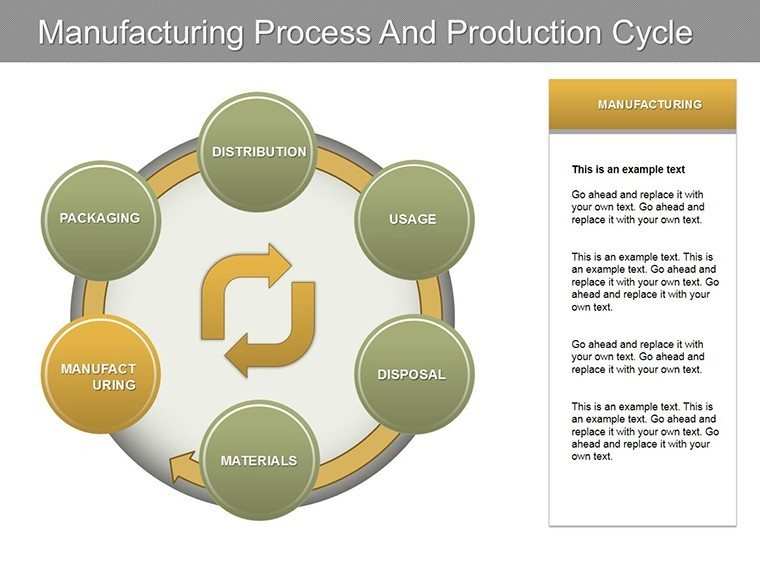
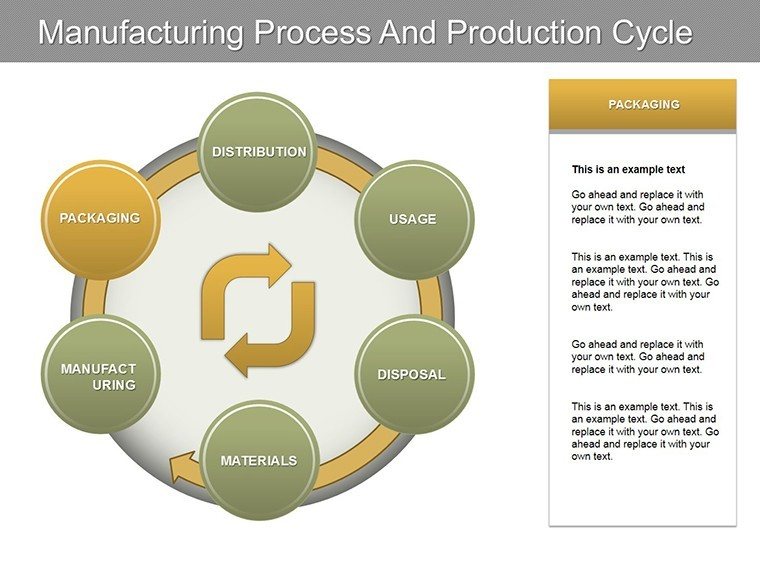
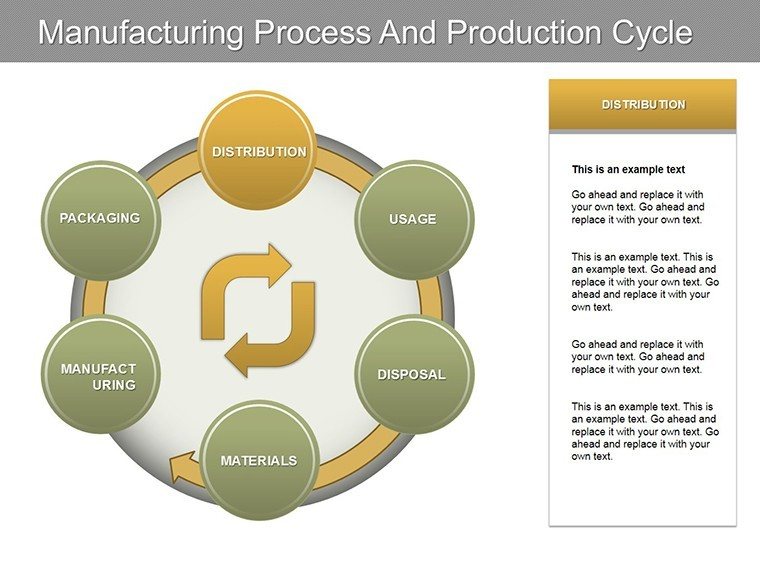
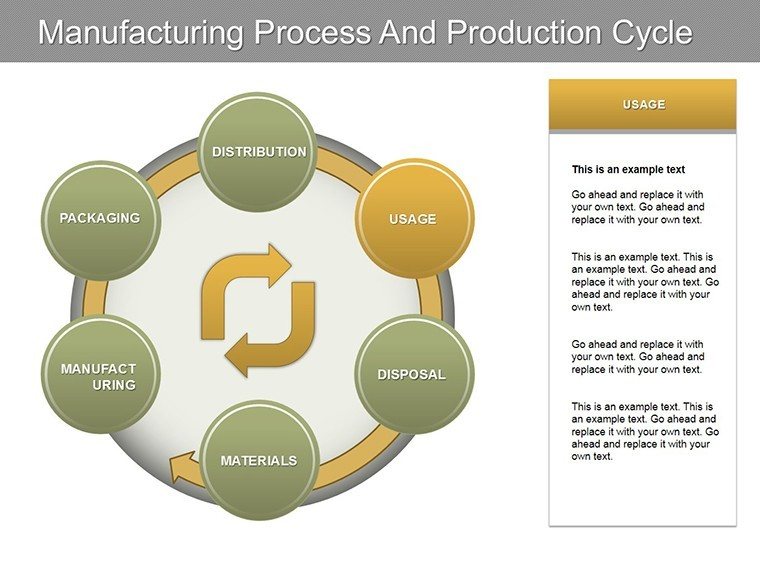
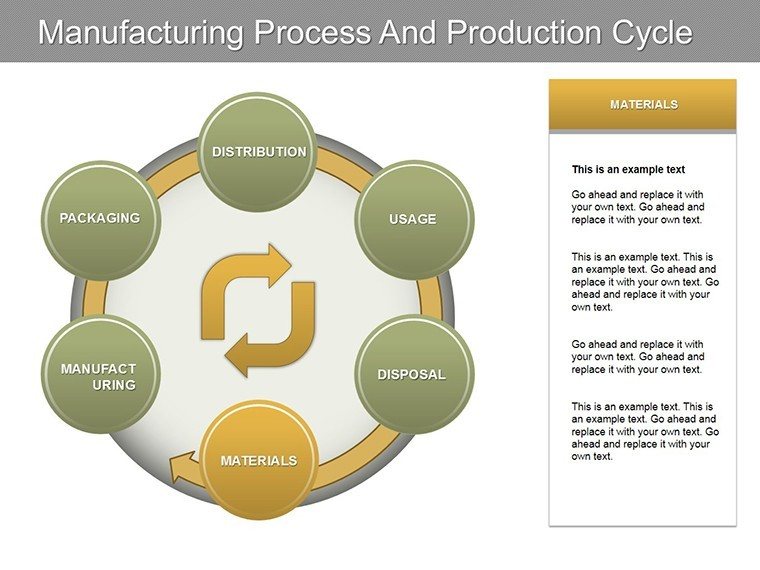
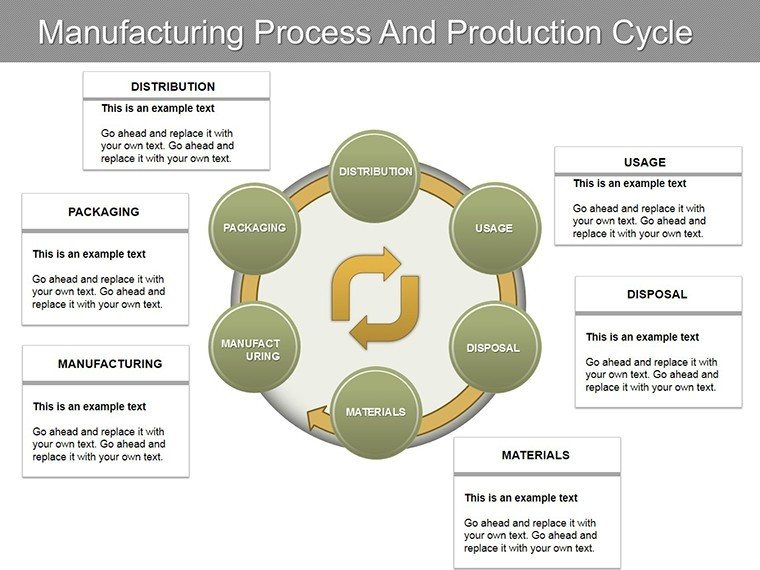
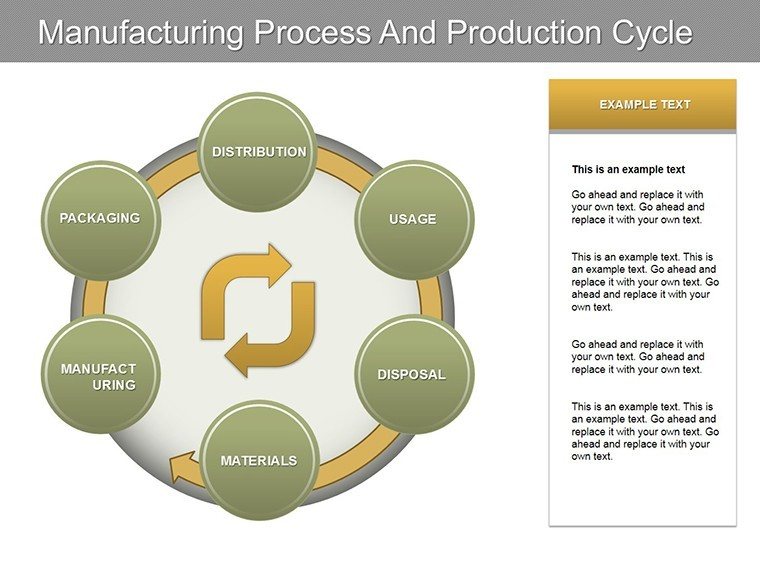
- Slide 9-12: Integrated Cycles - Combined elements for full production loops, including feedback arrows for continuous improvement.
- Slide 13-15: Advanced Variations - Customizable for specific industries, such as pharma compliance or electronics prototyping.
With icons representing machinery and timelines, these slides facilitate quick adaptations, ensuring your content stays relevant and engaging.
Practical Use Cases in Manufacturing Realms
Think of a plant supervisor presenting efficiency gains: arrow charts trace reduced downtime, backed by pie slices showing cost savings. In consulting, map client processes to identify redundancies, as in case studies from McKinsey on supply chain optimizations. Educators in vocational programs use them to teach lean principles, drawing from real examples like Boeing's production streamlining. This template brings such scenarios to life, building authority through practical, evidence-based visuals that align with industry reports from sources like the Manufacturing Institute.
Implementation Steps for Maximum Efficiency
- Launch the template in your preferred software.
- Input process data into customizable fields.
- Tweak arrows and pies to match your narrative.
- Add annotations for key insights.
- Test flow in slideshow mode.
- Share via cloud for team input.
This method dovetails with agile manufacturing approaches, speeding up iterations.
Expert Tips for Production-Focused Presentations
Enhance with storytelling - frame processes as journeys with challenges and triumphs. Use color coding consistently for quick comprehension. For pros, embed hyperlinks to detailed specs or videos of machinery in action. Per guidelines from the Institute of Industrial and Systems Engineers (IISE), prioritize flow over flash to maintain focus. In sectors like food processing, these tips ensure hygiene standards are visually reinforced, boosting overall presentation efficacy.
Transform your manufacturing dialogues today - grab this template and craft cycles that inspire action.
Frequently Asked Questions
How do I customize the process arrows?Easily edit shapes and directions using PowerPoint's drawing tools for tailored flows.Does it support Google Slides integration?Yes, upload and edit without losing functionality.Suitable for non-manufacturing fields?Certainly, adapt for any sequential process, like project management.Can I add more elements to pies?Yes, segment further or link to data for dynamic updates.Good for
- Project roadmaps and sprint plans
- Product launch timelines
- Quarterly or annual review decks
- Company history and milestone summaries
Licence
reviews
The timeline slides helped me explain project phases clearly.
I downloaded it mostly because the graphs were easy to read.
Pretty average template but useful when you’re in a rush.
The layout worked well during our Monday office meeting.
A few pages had too much empty space for my taste.
FAQ
Will it work in Google Slides?
Are fonts embedded?
Can I use this for client work?
What's the refund policy?
Do you update the template after purchase?
Similar templates
See all PowerPoint Charts →

All 15 slides