 Click to zoom
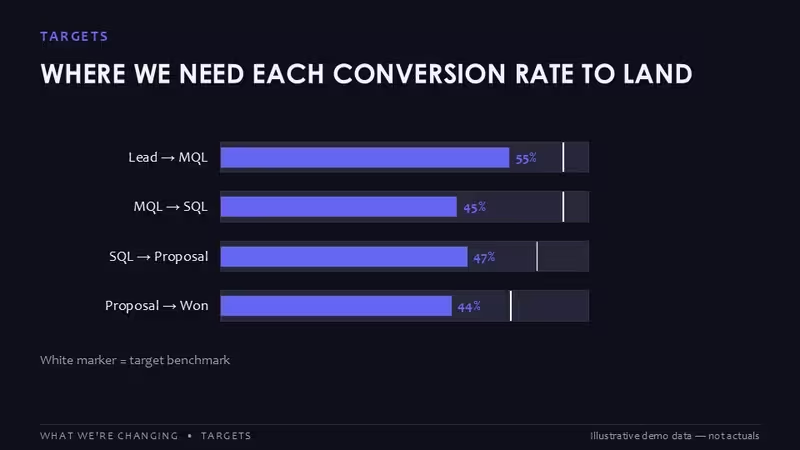
Lead and Deal Dynamics PowerPoint Charts - Presentation Template
| Format | .pptx |
| Slides | 1 unique layouts |
| Aspect ratio | 16:9 |
| Compatibility | PowerPoint |
| Animated | Yes |
| Language | English |
| License | Commercial |
| File size | — |
| Version | v1.0 |
| Last updated | July 2026 |
What's inside
Overview
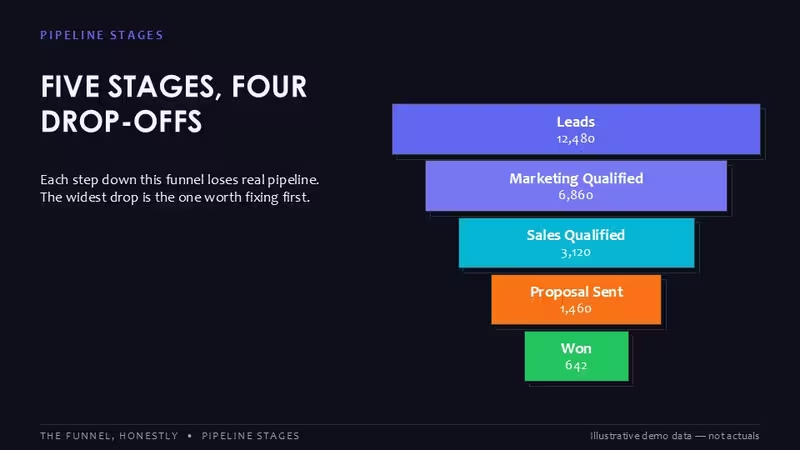
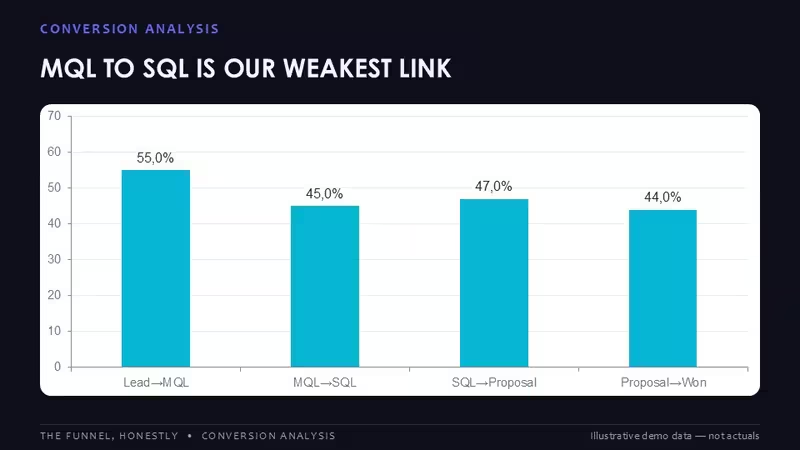
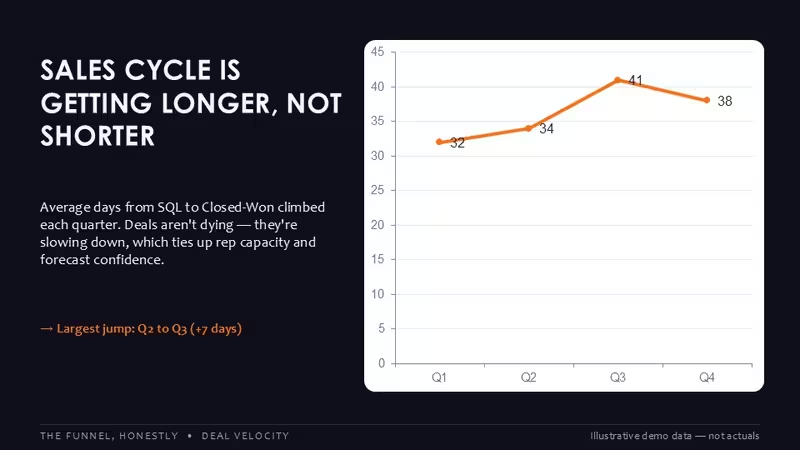
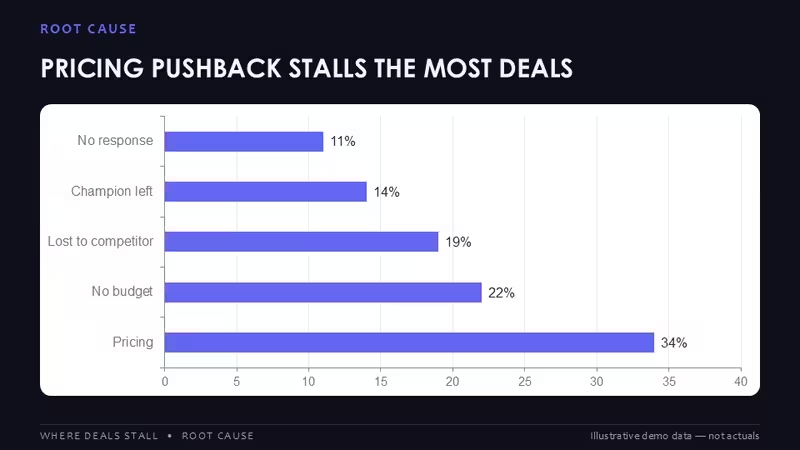
The Lead and Deal Dynamics PowerPoint Charts template is designed for presenting the progress of leads, opportunities, and completed deals through clear visual charts. Instead of displaying raw numbers in spreadsheets, the slides help organize sales activity into presentations that are easier to review during meetings, quarterly reporting, business planning, and performance analysis.
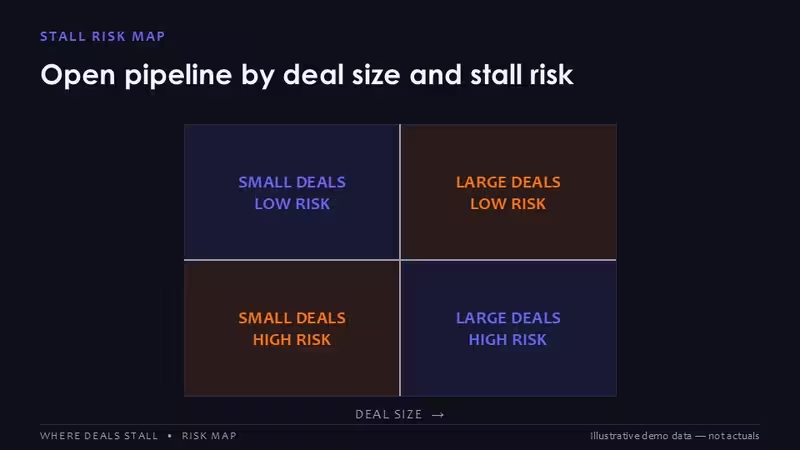
The layouts are suitable for sales managers, CRM analysts, marketing teams, consultants, and business development specialists who need to explain pipeline movement, conversion trends, or deal distribution. Each chart is arranged to keep comparisons readable even when datasets are updated frequently.
Editing the Charts
The presentation contains 27 editable PPTX slides that can be customized directly in Microsoft PowerPoint. Text placeholders, chart values, titles, and labels can be replaced with your own information while preserving the original slide structure. This allows reports to be updated regularly without rebuilding every diagram from scratch.
Because every slide follows a consistent design style, multiple charts can be combined into one presentation while maintaining a uniform appearance across weekly, monthly, or quarterly reports.
Typical Uses
- Lead generation and conversion reporting.
- Sales pipeline and opportunity tracking.
- Deal performance presentations.
- CRM and business review meetings.
- Marketing and revenue reporting dashboards.
Technical Advantages
- 27 editable presentation slides.
- PPTX format for Microsoft PowerPoint.
- Charts can be updated with new business data.
- Consistent layouts across the complete presentation.
- Suitable for business reporting and sales analytics presentations.
Frequently Asked Questions
Can the charts be edited in PowerPoint?
Yes. The slides are provided in PPTX format, allowing chart values, text, titles, and labels to be updated directly in Microsoft PowerPoint.
Who is this template intended for?
It is suitable for sales teams, business analysts, consultants, marketing departments, and managers preparing reports on lead generation, deal progress, and sales performance.
Can I use it for quarterly or monthly reporting?
Yes. The chart layouts are organized for recurring business reporting, making it easy to replace existing data while keeping presentations visually consistent.
Good for
- Project roadmaps and sprint plans
- Product launch timelines
- Quarterly or annual review decks
- Company history and milestone summaries
Licence
reviews
No reviews yet. Be the first!
FAQ
Will it work in Google Slides?
Are fonts embedded?
Can I use this for client work?
What's the refund policy?
Do you update the template after purchase?
Similar templates
See all PowerPoint Charts →

All 20 slides