 Click to zoom
Ishikawa Fishbone Keynote Charts - Editable KEY | ImagineLayout
| Format | .pptx |
| Slides | 48 unique layouts |
| Aspect ratio | 16:9 |
| Compatibility | PowerPoint |
| Animated | No |
| Language | English |
| License | Commercial |
| File size | — |
| Version | v1.0 |
| Last updated | April 2026 |
What's inside
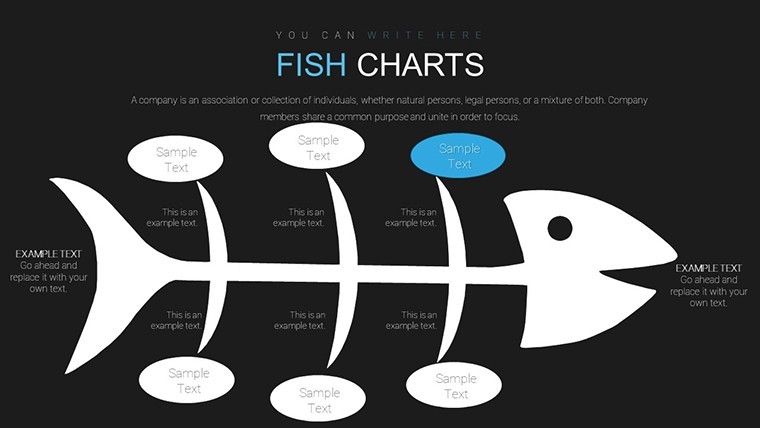
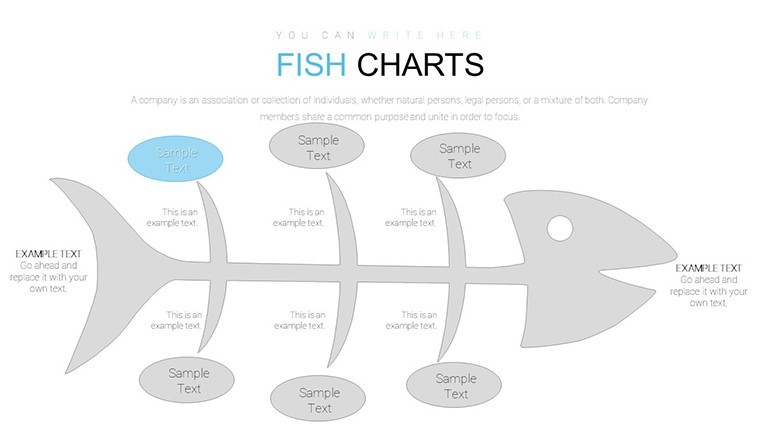
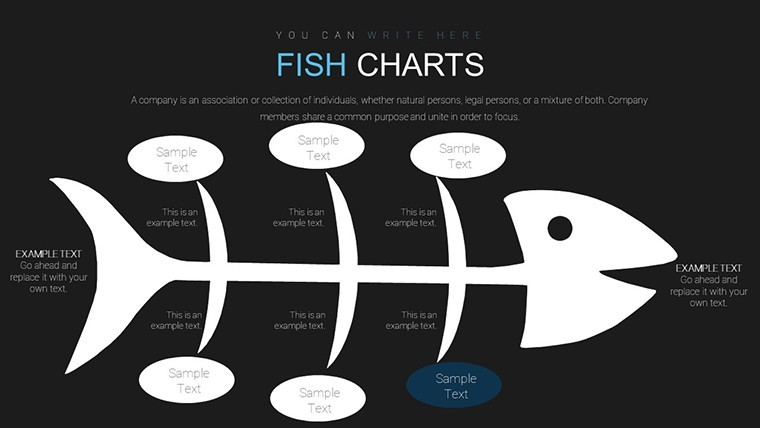
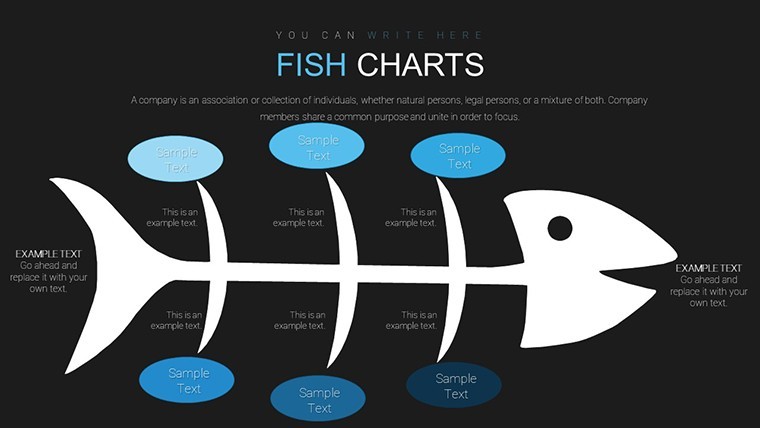
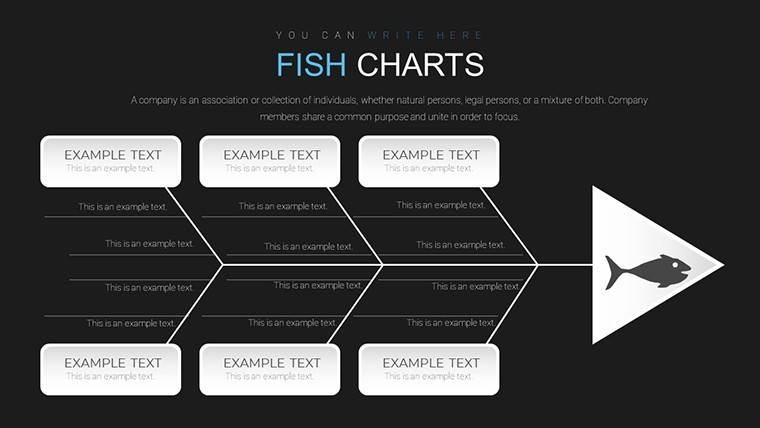
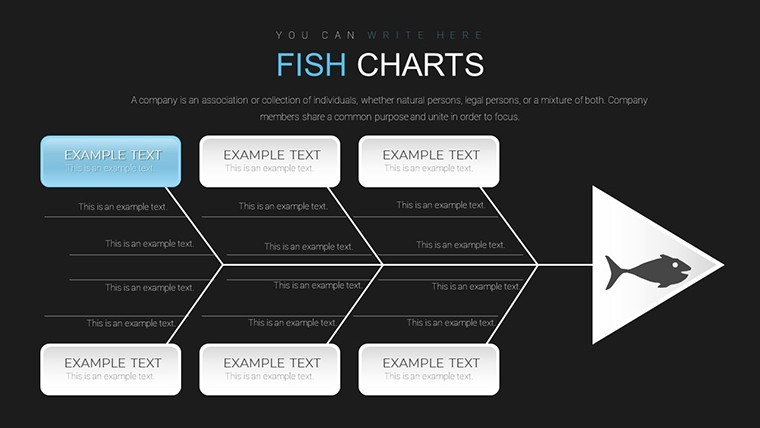
Root Cause Analysis with Fishbone Charts
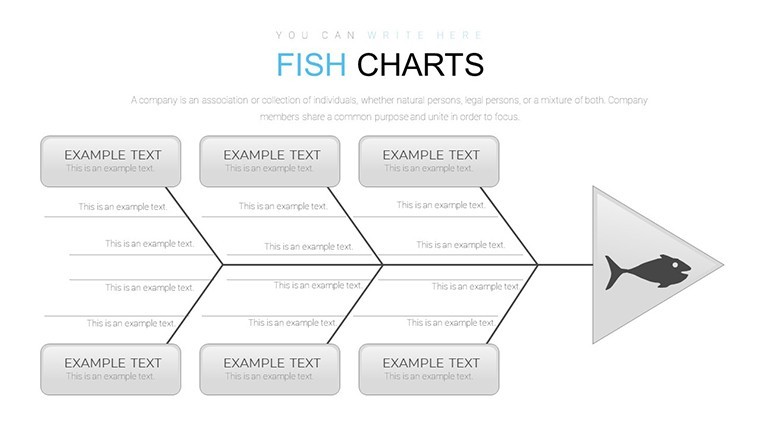
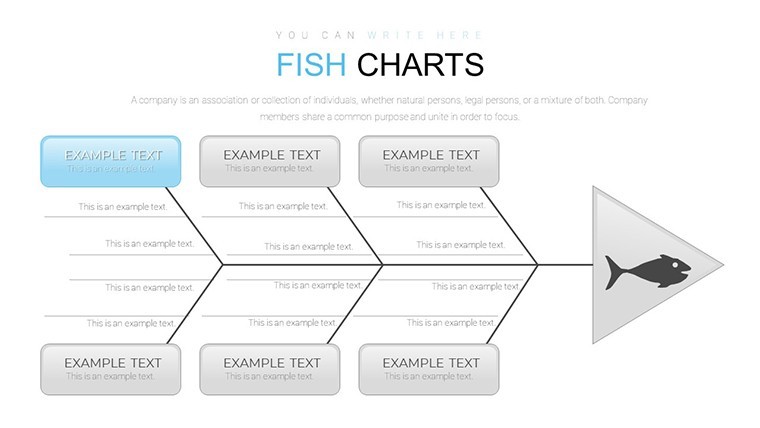
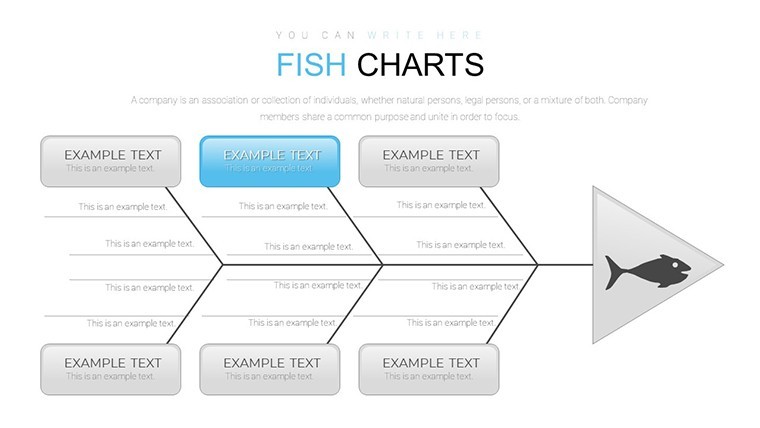
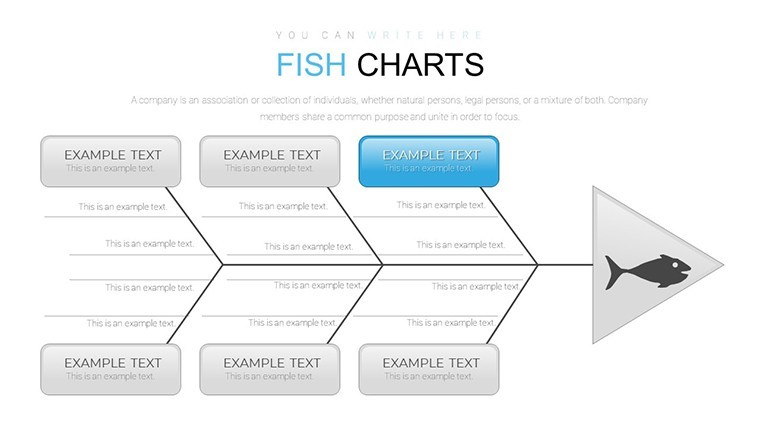
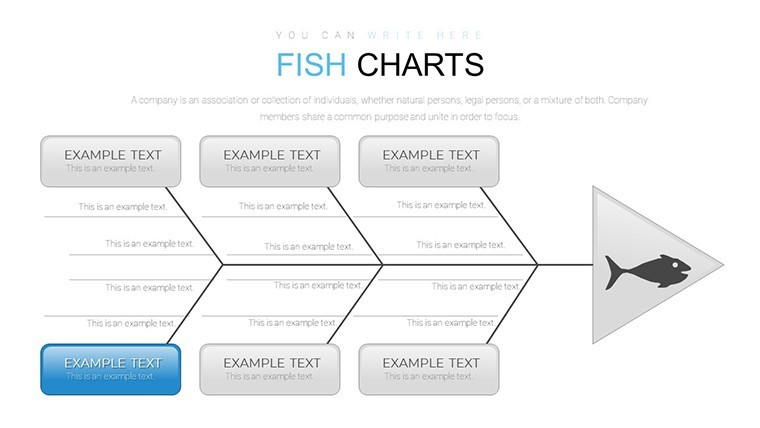
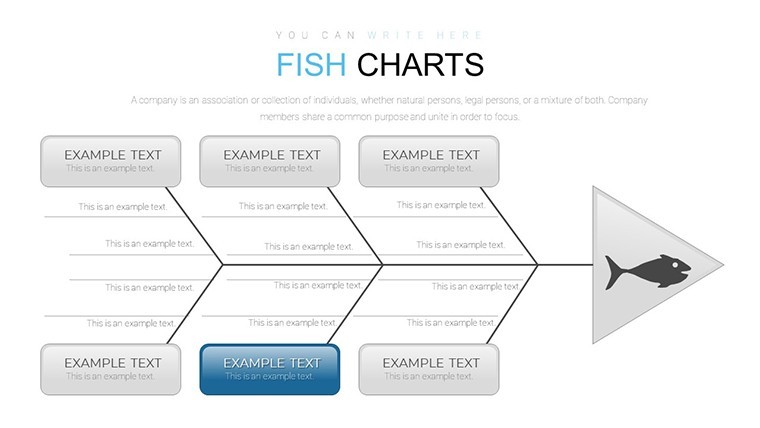
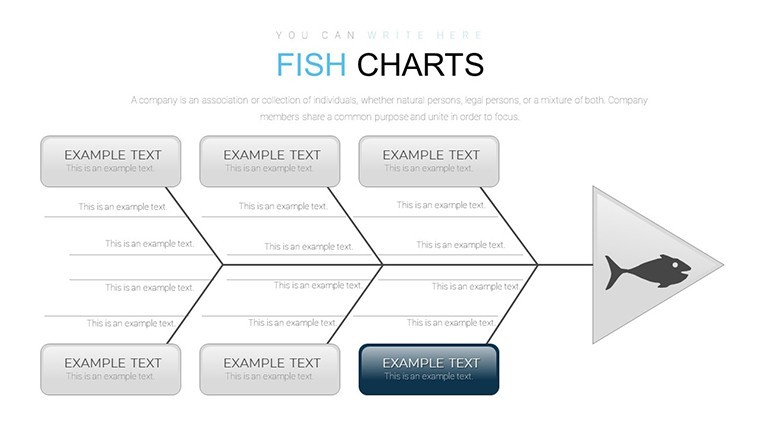
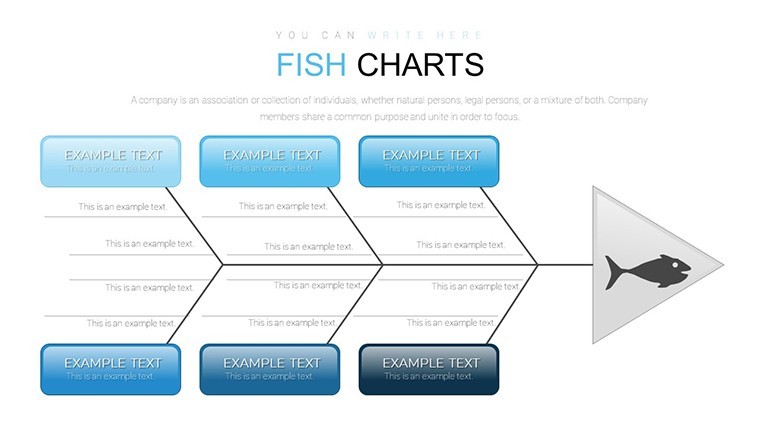
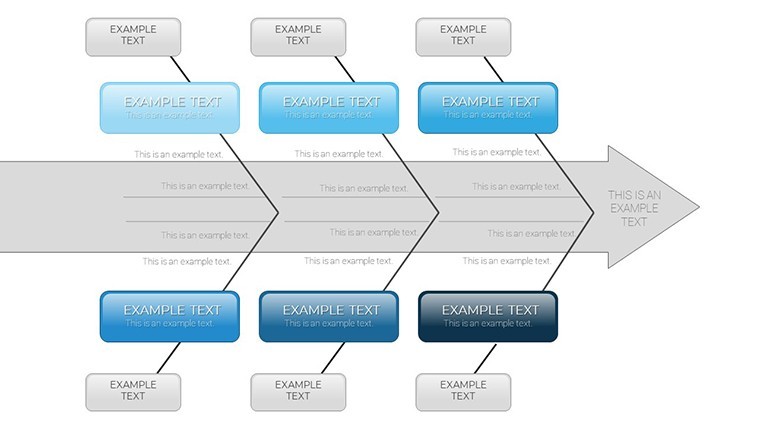
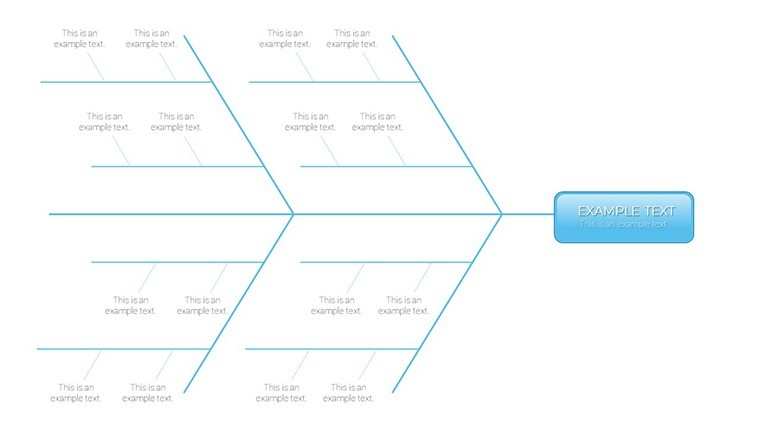
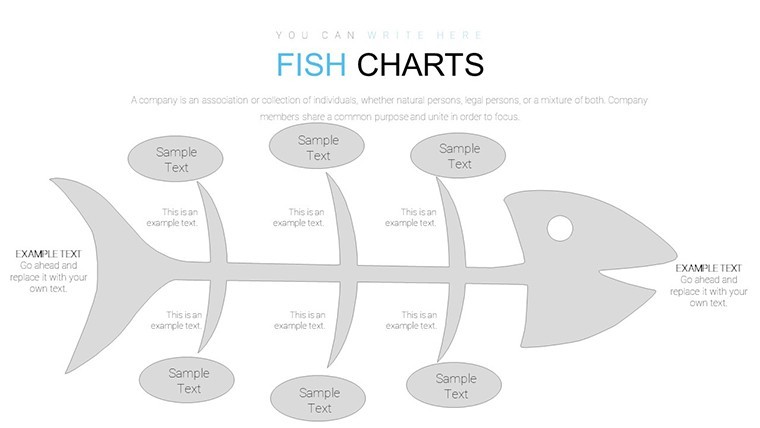
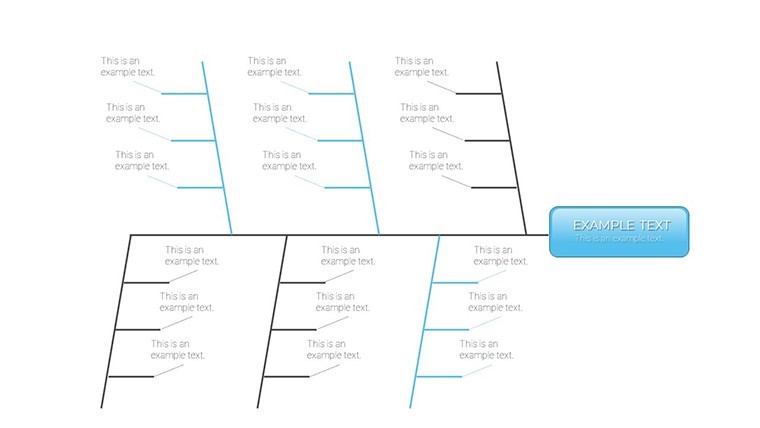
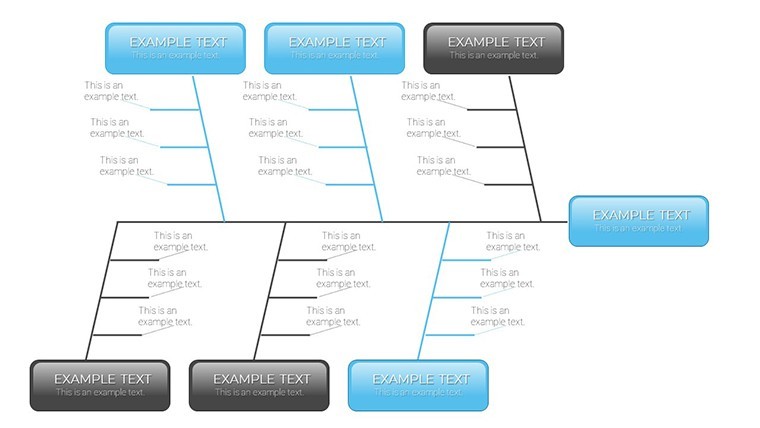
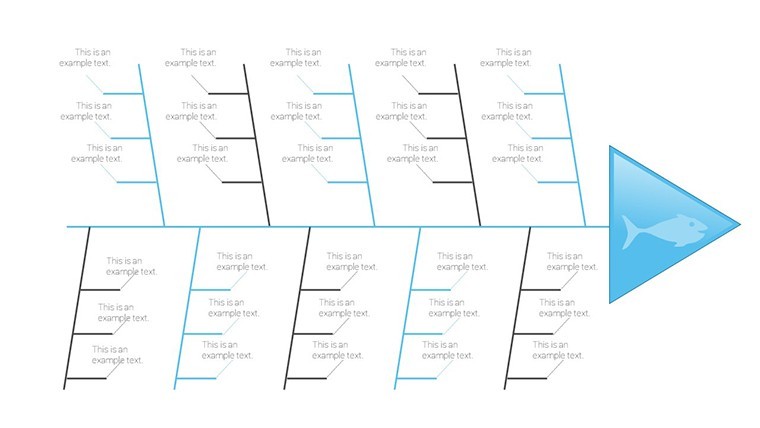
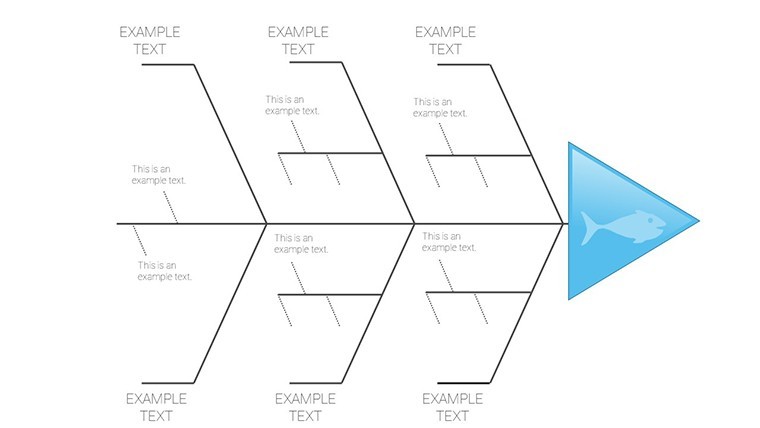
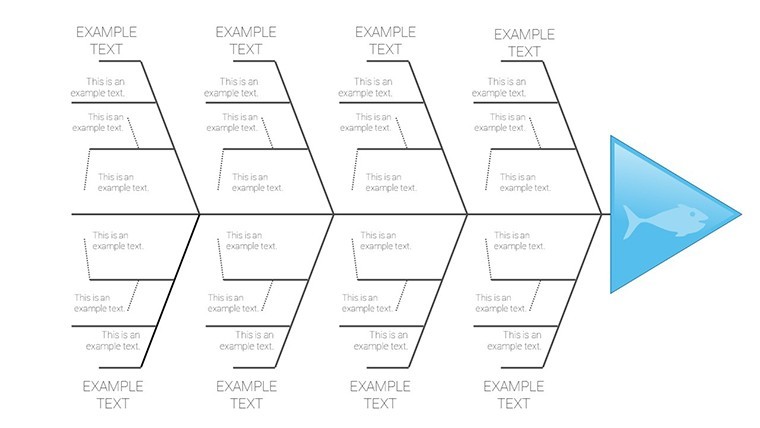
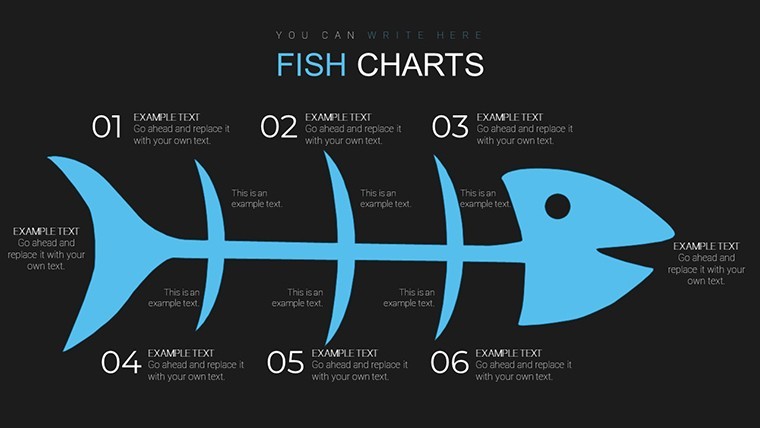
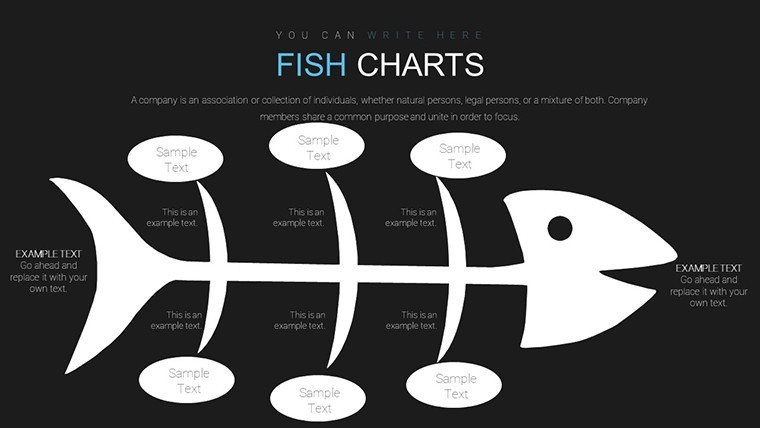
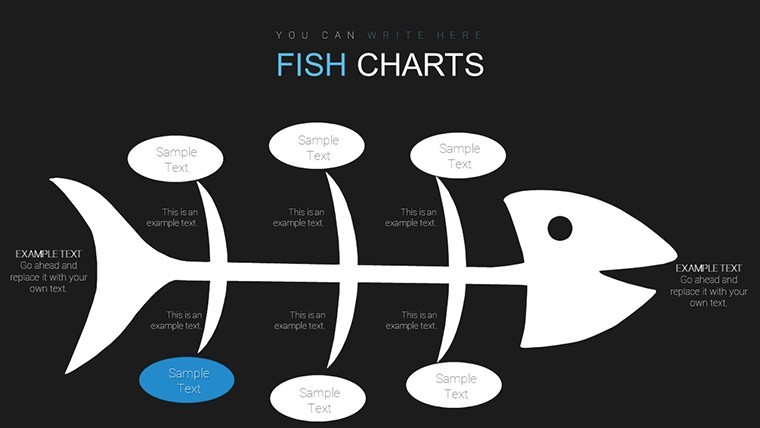
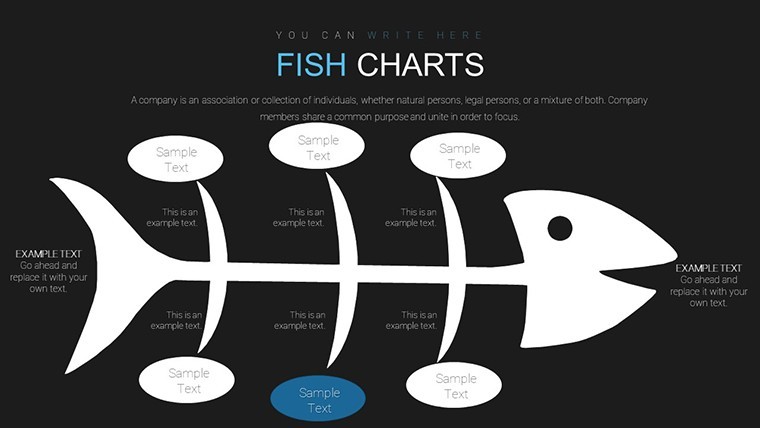
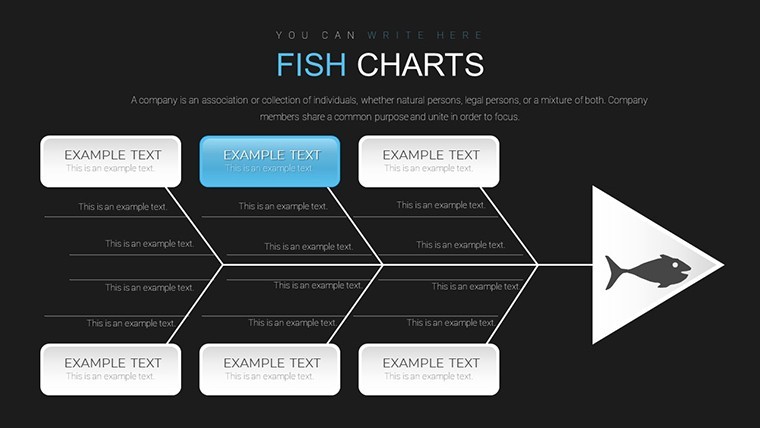
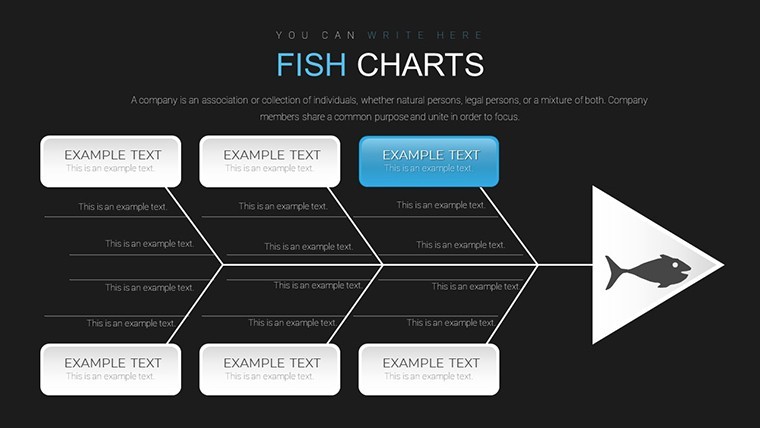
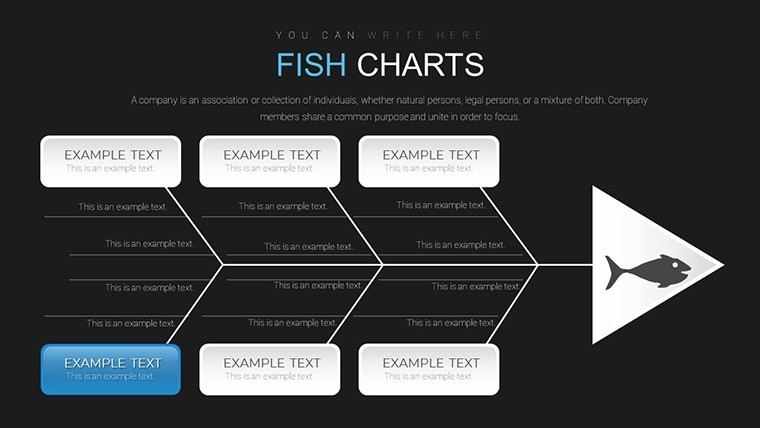
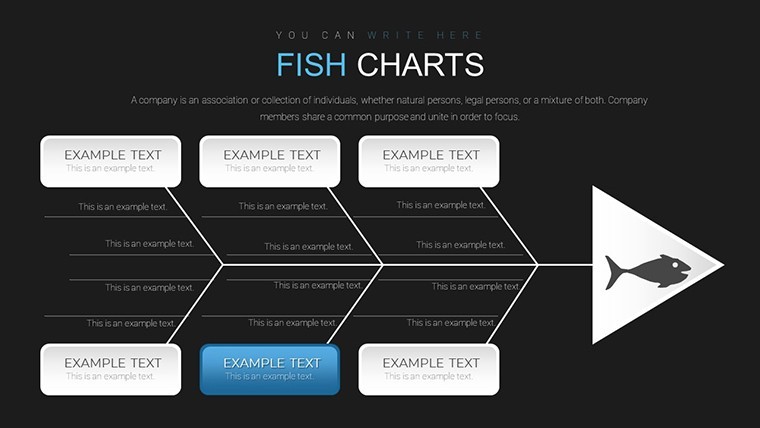
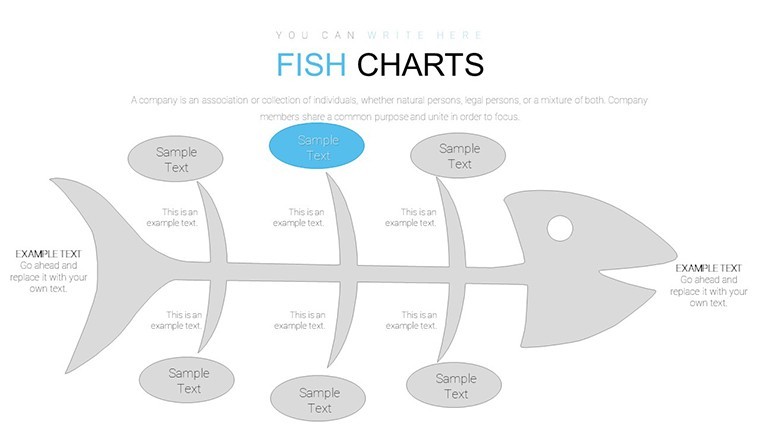
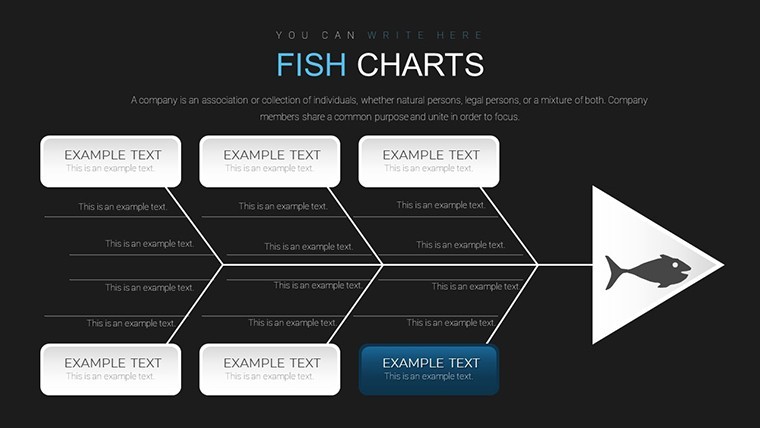
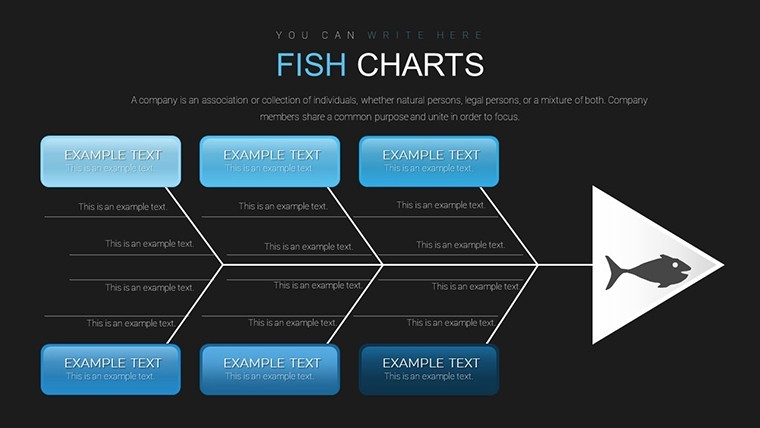
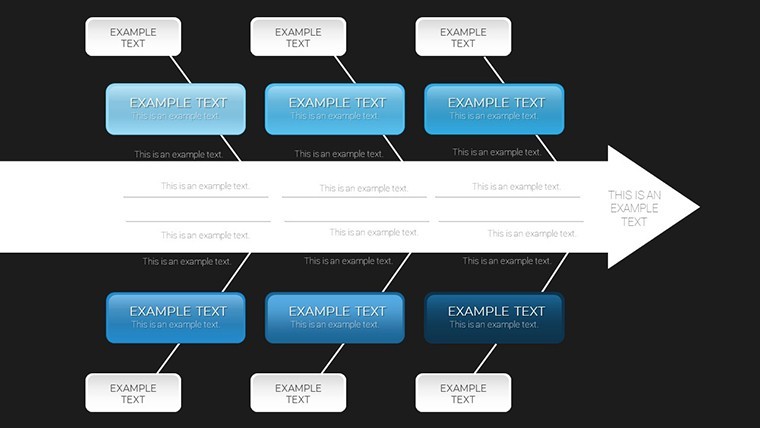
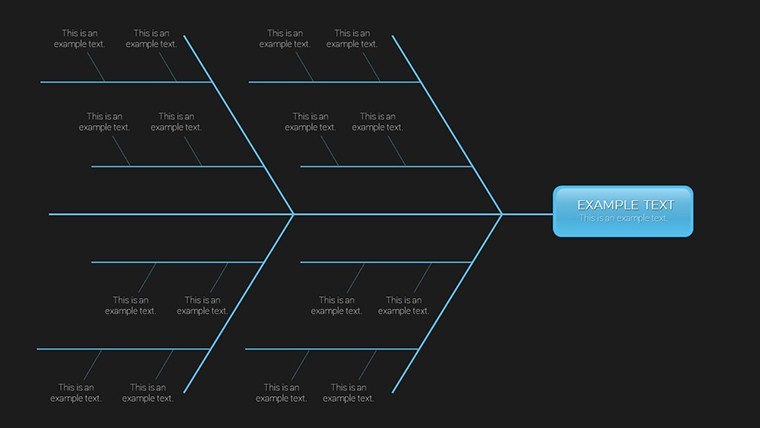
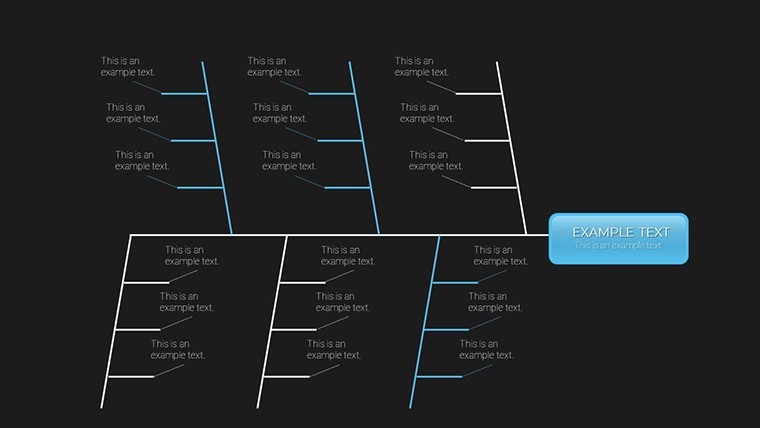
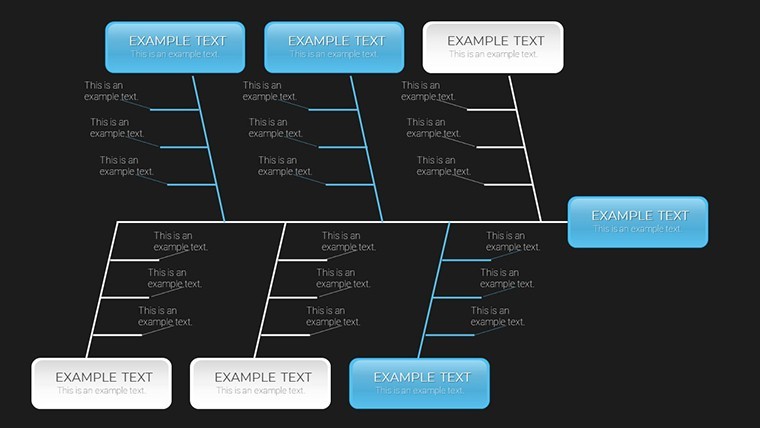
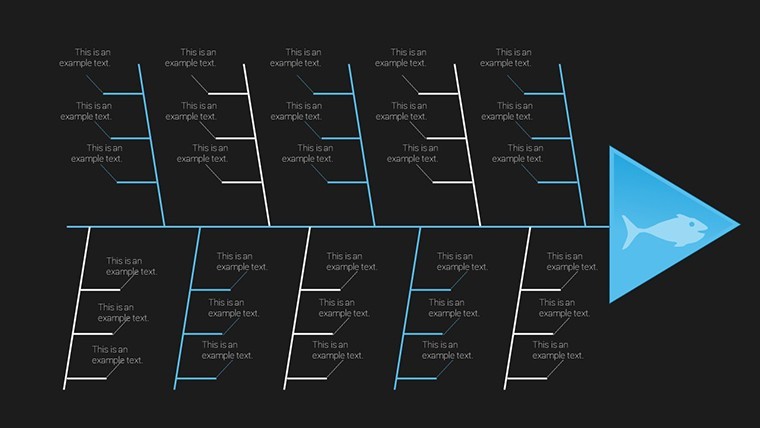
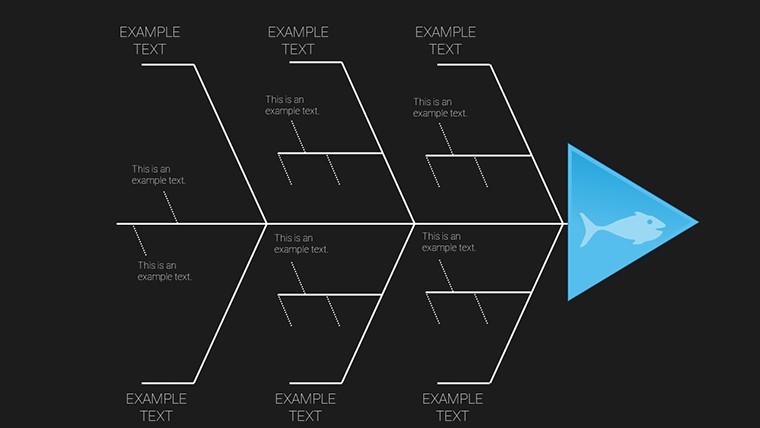
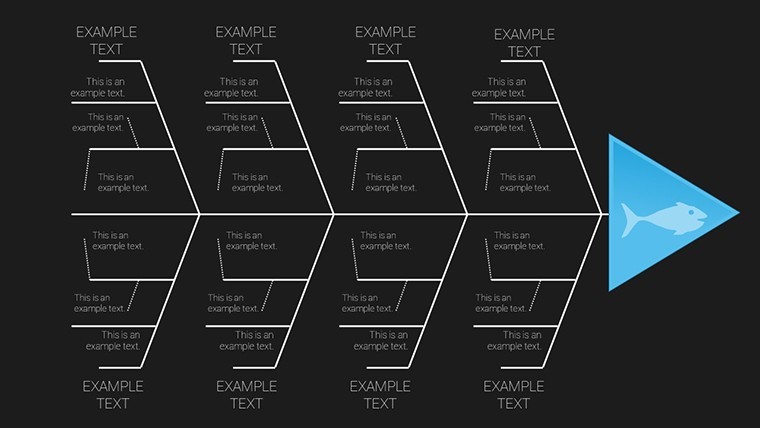
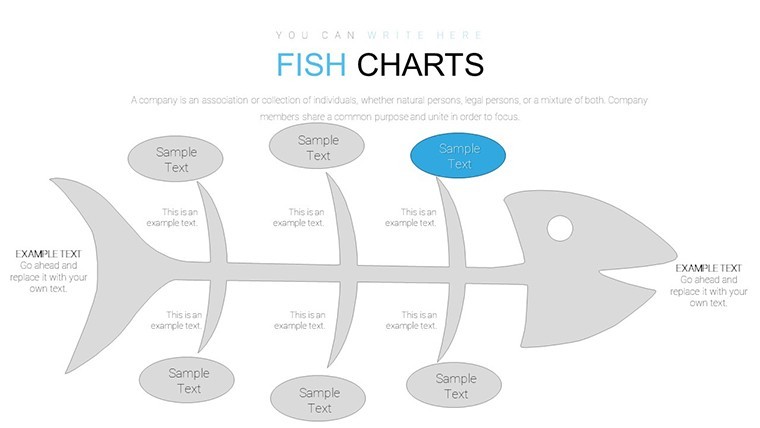
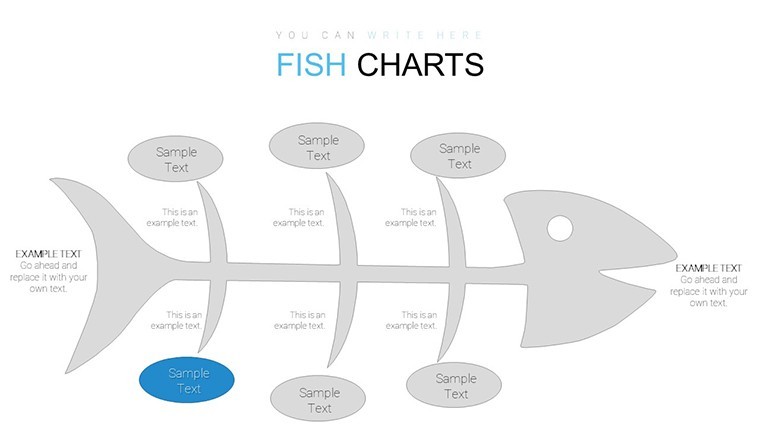
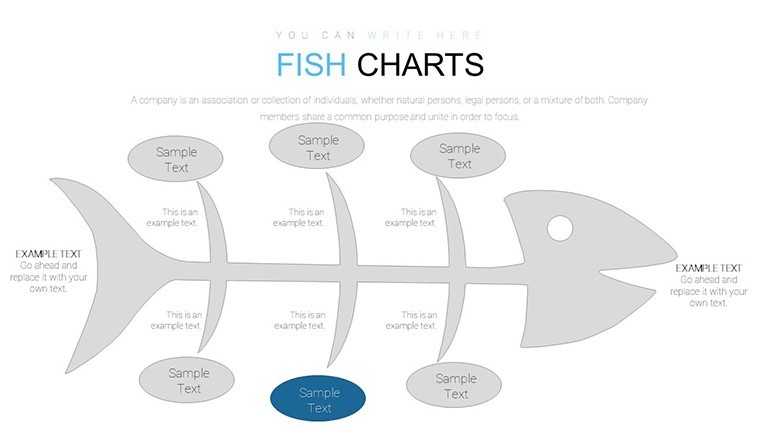
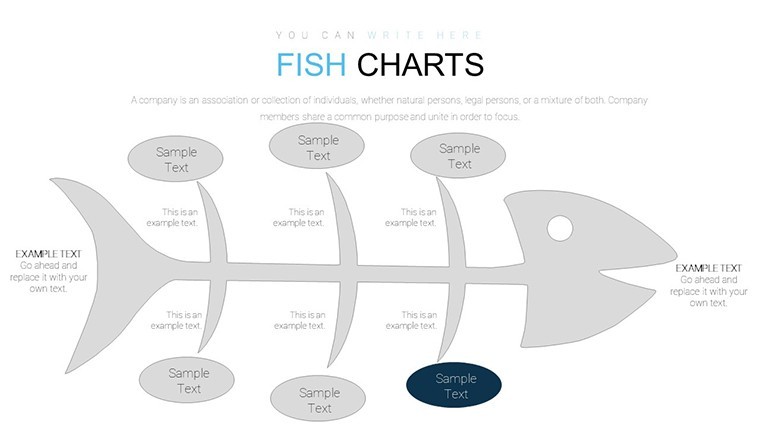
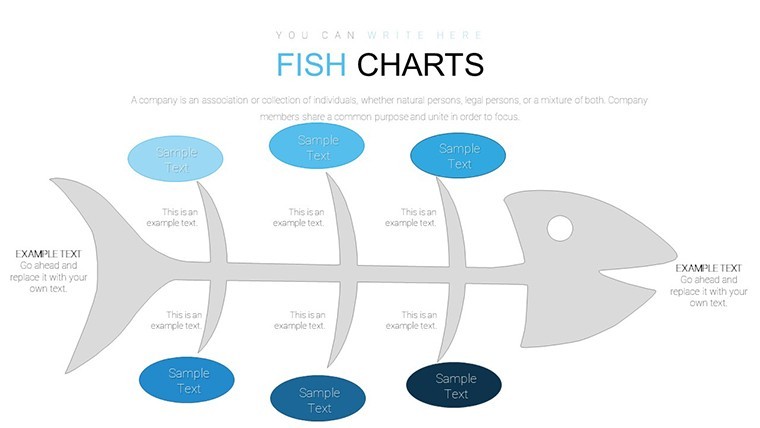
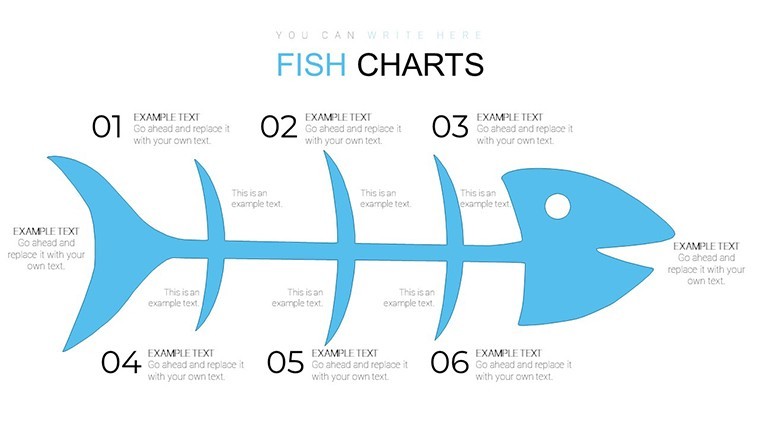
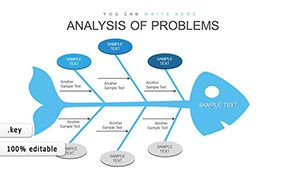
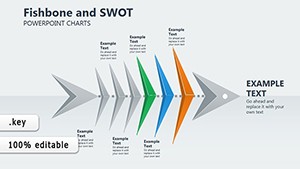
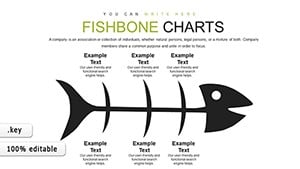
Open the .key file and you get 48 fishbone diagrams for root cause breakdown right away.
Quality leads use this when they need to present delay causes to operations teams. The branching fishbone layout replaces manual work entirely so you drop in categories and it works. Typically you only replace text and adjust colors.
This Keynote diagram template supports relationship mapping that helps the viewer pinpoint exact causes. It organizes inputs into standard categories and the decision becomes which fix to implement first.
The page does not list color schemes or free version contents but the paid version provides the full 48 editable slides in .key format compatible with current installations. Color changes happen via slide master in seconds. Best used for structured problem data not ideal for open creative slides.
Use this when you need to show workflow issues without arranging shapes manually. The predefined branches keep everything aligned so you don`t end up adjusting spacing slide by slide.
FeatureDetailsSlides / diagrams48 editable Ishikawa fishbone diagramsFile format.keySoftware versionCurrent Keynote installations (standard KEY format)Color schemesRecolorable via slide masterEditable elementsBranches resize and recolor independentlyAspect ratio16:9Free vs PaidPaid delivers full 48 editable slidesMasters / BackgroundsMaster slides for global updatesWhen you need to analyze project delays for the operations team the fishbone structures organize complex content and reduce the problem of vague blame. This helps identify bottlenecks in a process.
Is this compatible with Keynote 9 and later on macOS?The template works in Keynote 9 and later. It requires macOS 10.15 or newer in most cases. You open the file directly without additional plugins or conversion steps.
How do I change colors via slide master?To change colors select the slide master in Keynote. Update the theme colors there and they apply to all diagrams automatically. Then save and the entire set updates in seconds without touching each slide.
Can I use this template for client work?Yes you can use the template for client work under the standard license. Do not resell the original file as your own product. Modify it for presentations and deliver to clients as part of your service.
What is the difference between free and paid versions?The paid version includes all 48 editable slides with full customization. The page does not specify free version contents. In most cases the paid download is the complete package you need for professional use.
What are the refund conditions?Refunds are available within 14 days if the template does not meet your needs. Contact support with your order details. Note that once downloaded the file cannot be returned for security reasons but the policy is buyer friendly.
Everything is already structured.
Download and start editing immediately
See also Fishbone Diagram Keynote Template or Cause and Effect Fishbone Diagrams Keynote Charts Template.
Good for
- Project roadmaps and sprint plans
- Product launch timelines
- Quarterly or annual review decks
- Company history and milestone summaries
Licence
reviews
The infographic charts helped make my report less boring.
I needed something fast and this template worked.
Some pages felt repetitive honestly.
The graph layouts were still useful though.
Easy enough for beginners to customize.
FAQ
Will it work in Google Slides?
Are fonts embedded?
Can I use this for client work?
What's the refund policy?
Do you update the template after purchase?
Similar templates
See all Keynote Charts →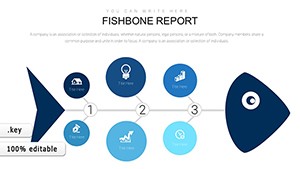
All 48 slides