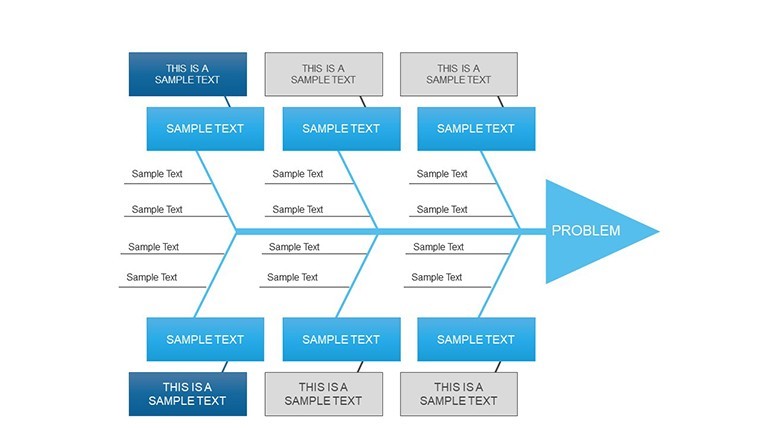
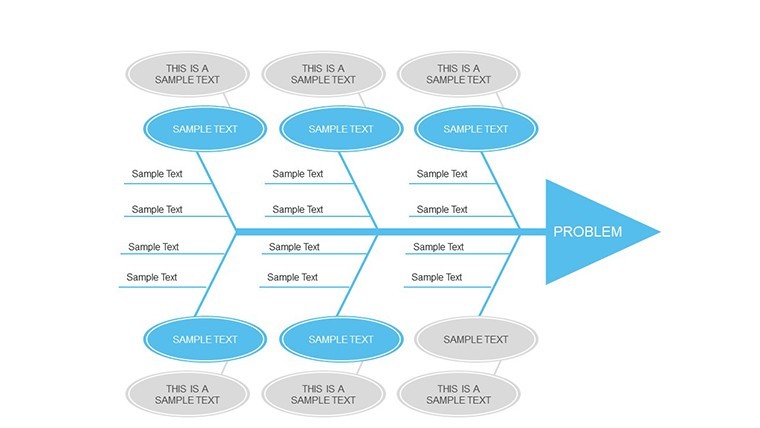
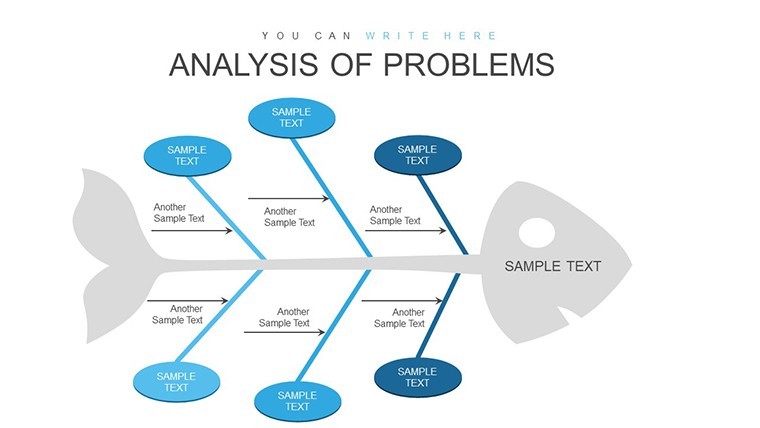
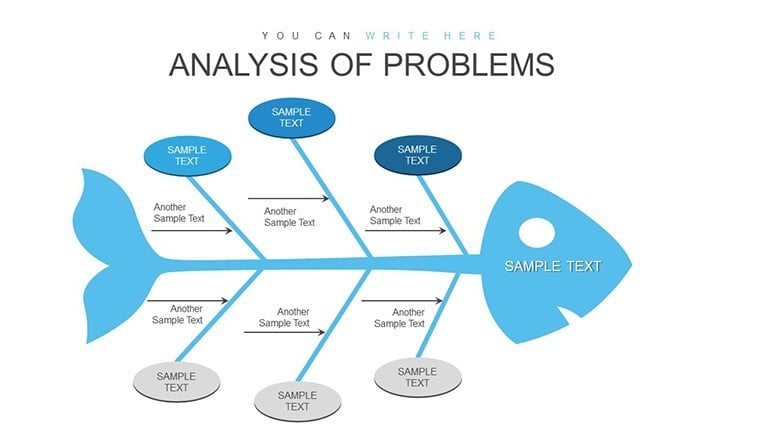
 Click to zoom
Ishikawa Fishbone Analysis: Master Problem Solving with Keynote Charts
| Format | .pptx |
| Slides | 28 unique layouts |
| Aspect ratio | 16:9 |
| Compatibility | PowerPoint |
| Animated | No |
| Language | English |
| License | Commercial |
| File size | — |
| Version | v1.0 |
| Last updated | May 2024 |
What's inside
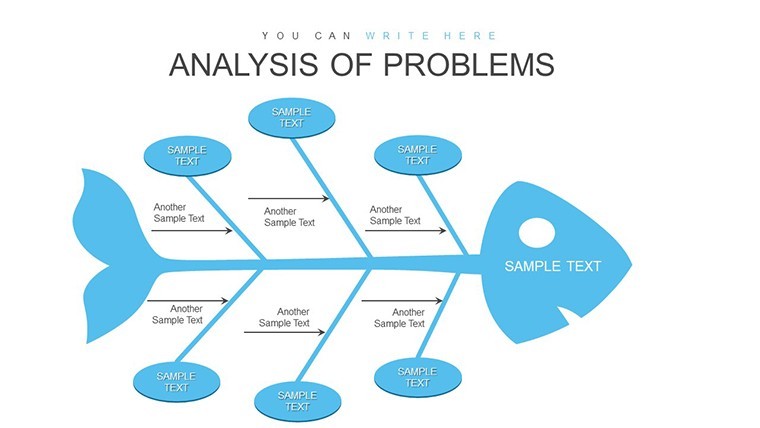
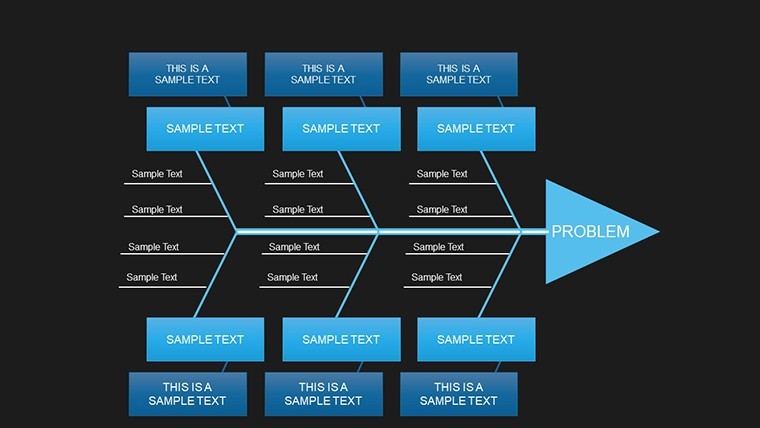
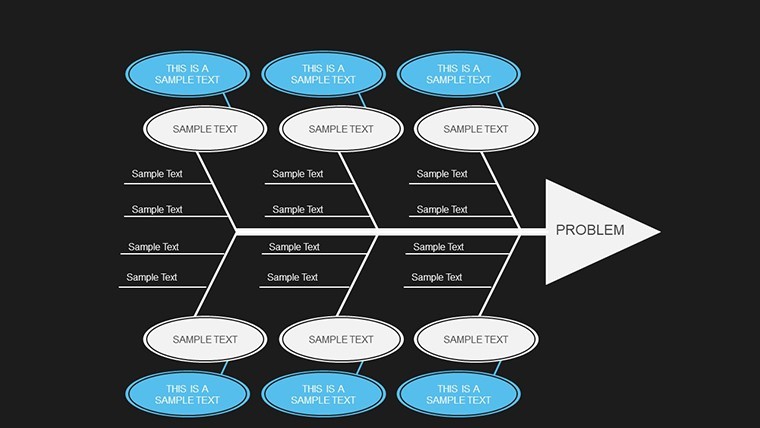
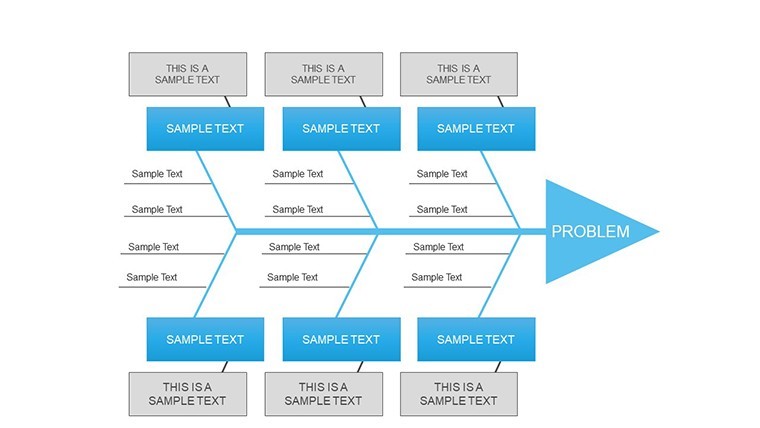
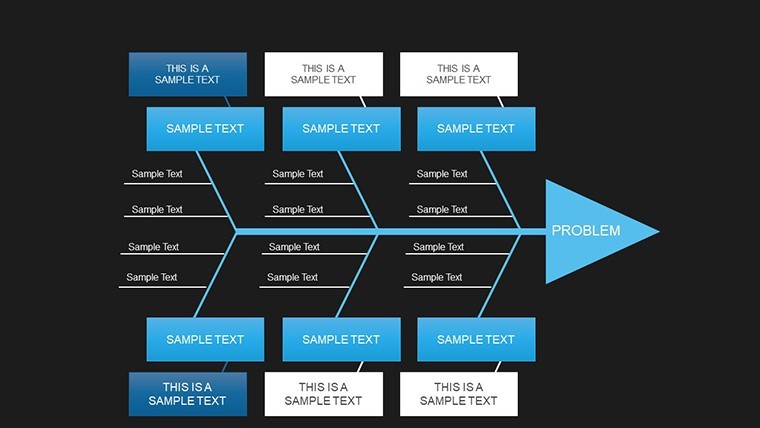
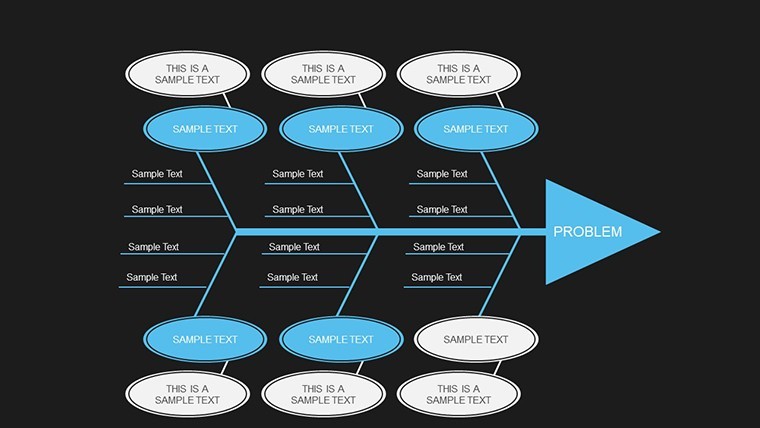
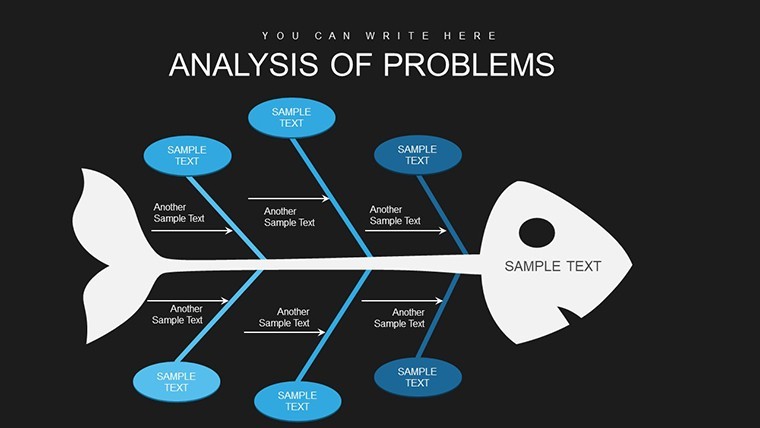
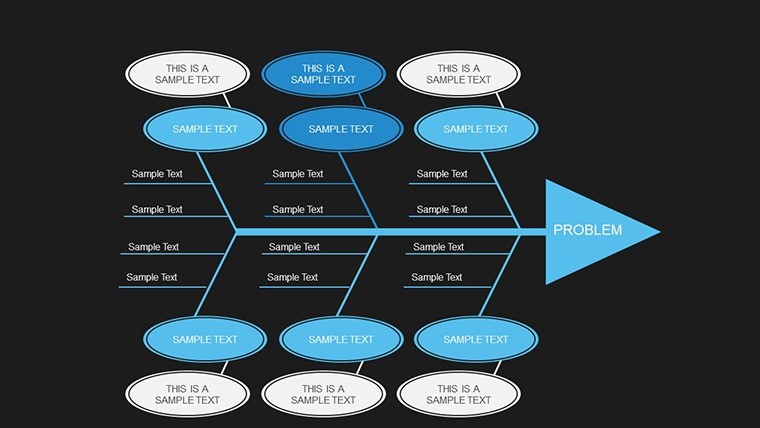
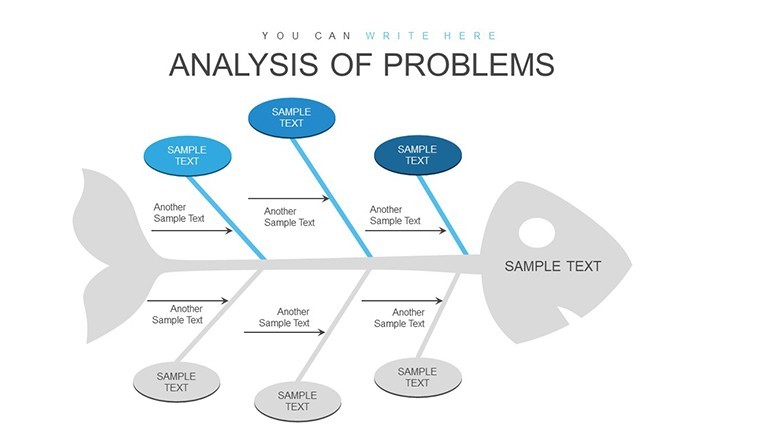
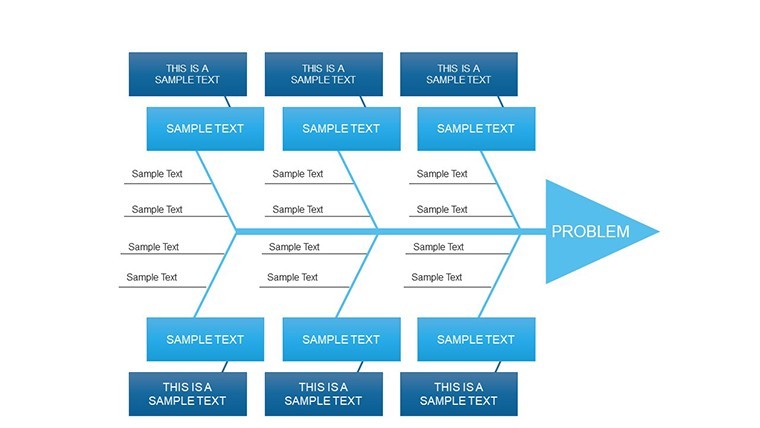
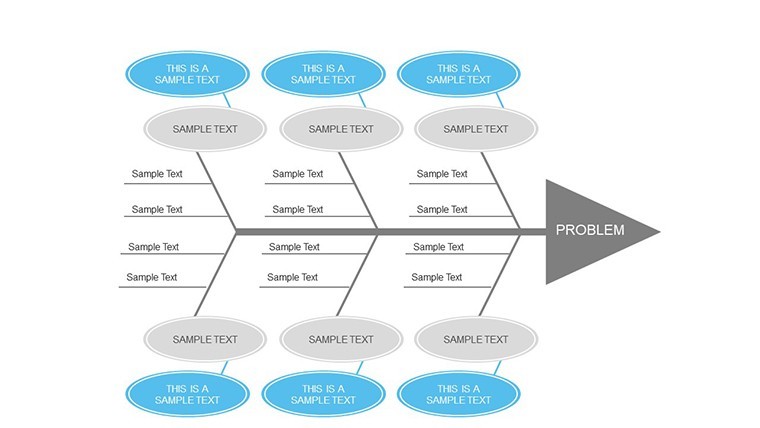
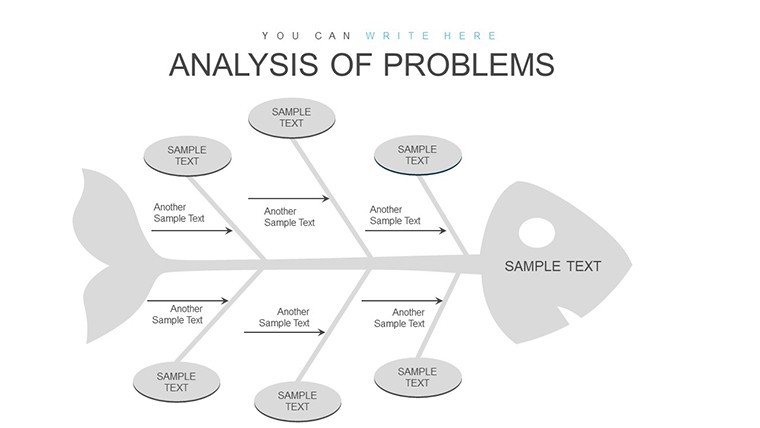
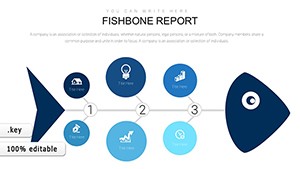
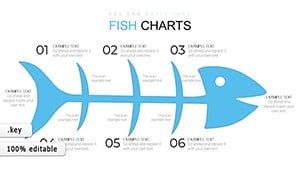
When issues arise in your operations, pinpointing the true culprits can feel like navigating a maze. Enter the Ishikawa Fishbone Diagram - a proven methodology pioneered by Kaoru Ishikawa for quality management. Our dedicated Keynote template, boasting 28 meticulously designed slides, brings this tool to life for modern professionals. Ideal for project managers, quality experts, and educators, it transforms chaotic problem analysis into structured, visual storytelling. Imagine dissecting manufacturing defects or service bottlenecks with branches for manpower, methods, materials, and more, all editable to fit your scenario. This isn't just a template; it's a catalyst for continuous improvement, drawing from lean principles endorsed by organizations like the American Society for Quality (ASQ). By visualizing cause-and-effect relationships, you'll uncover hidden factors, prevent recurrences, and boost team collaboration. Whether in healthcare diagnosing patient care gaps or in tech troubleshooting software bugs, these charts empower you to communicate findings compellingly, turning data into decisions that drive success.
The Essence of Fishbone Diagrams in Effective Troubleshooting
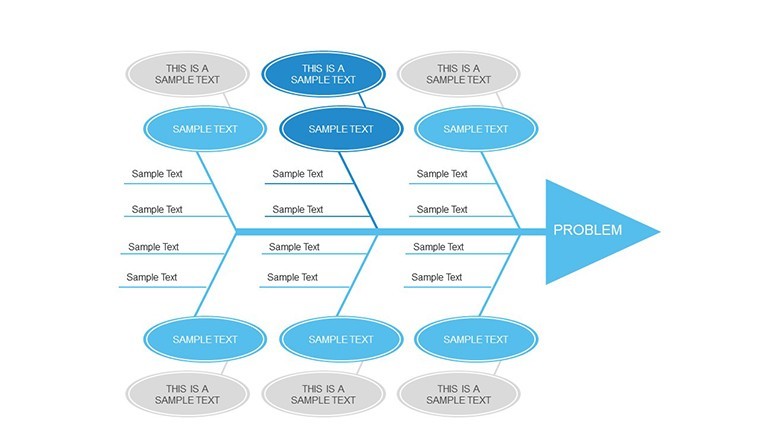
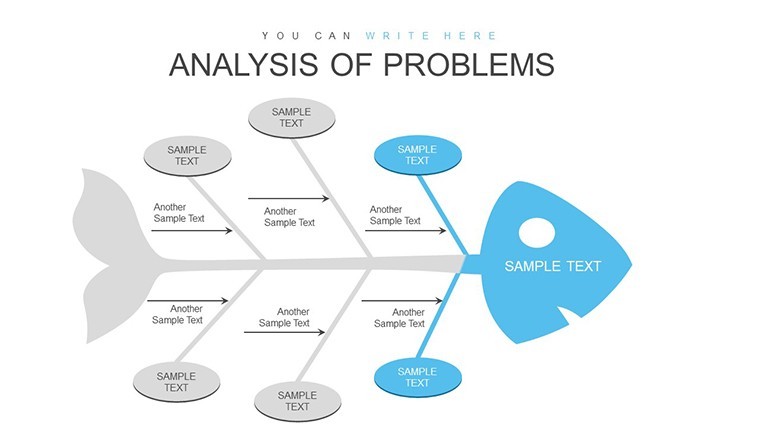
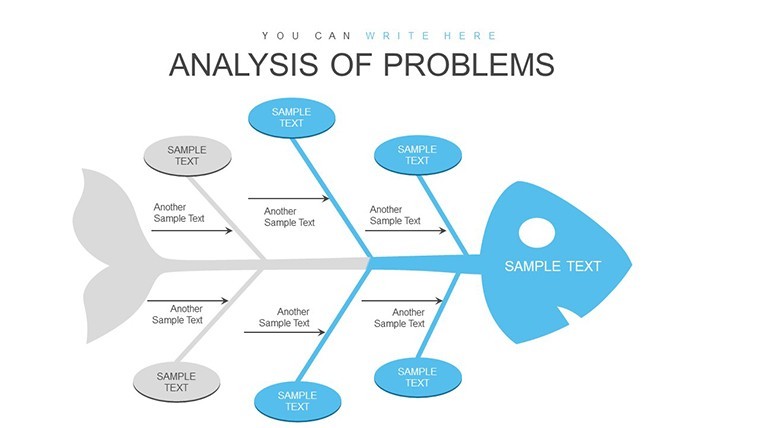
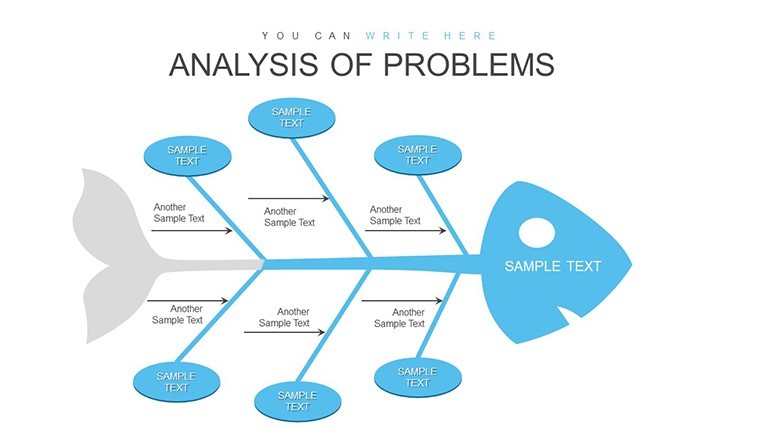
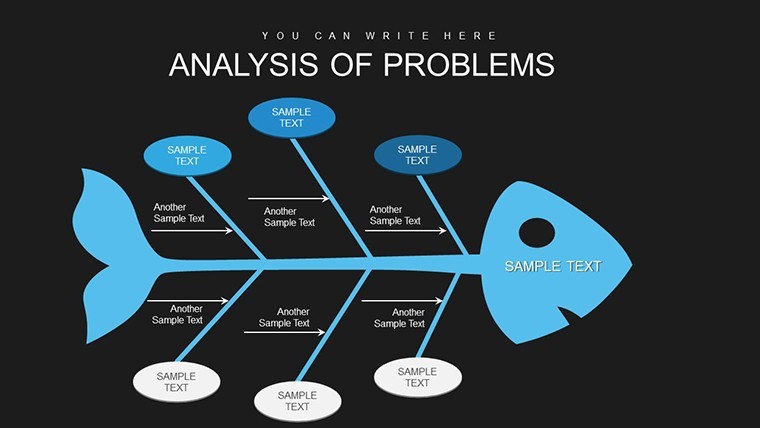
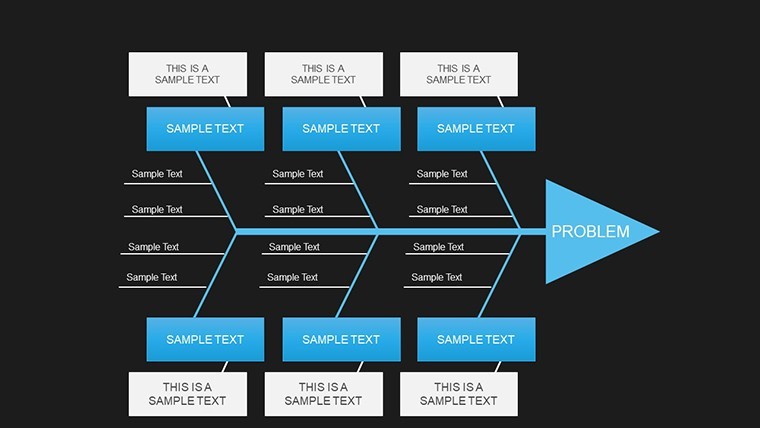
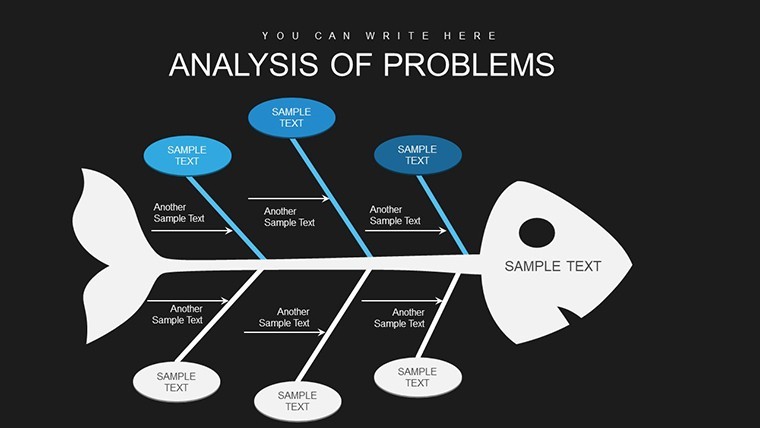
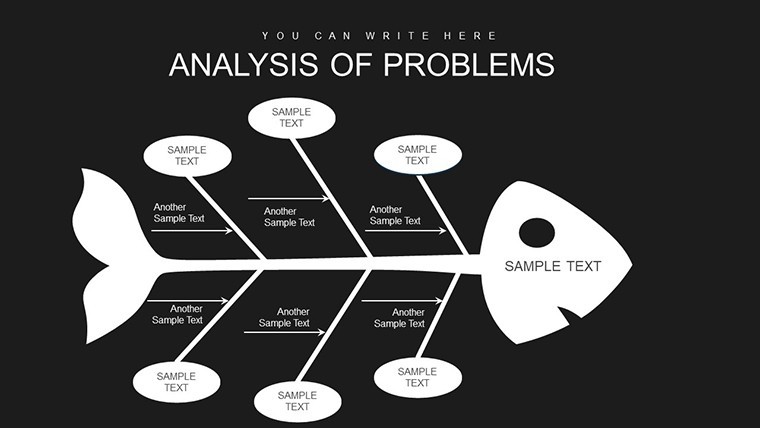
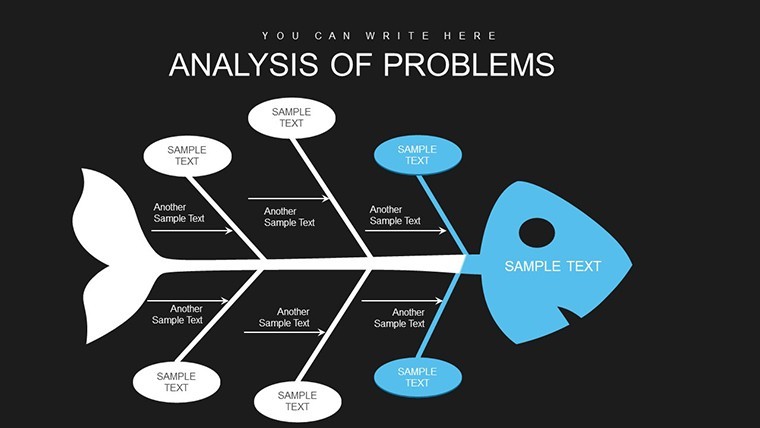
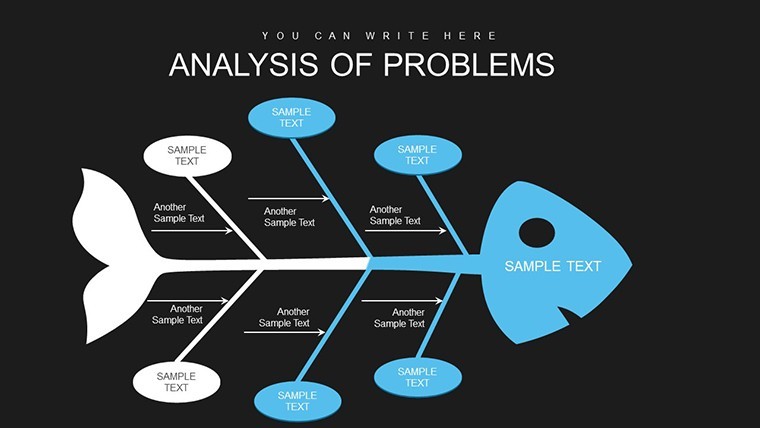
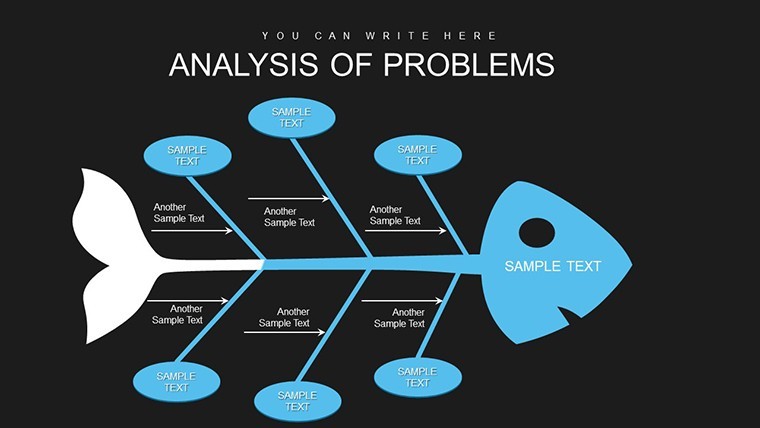
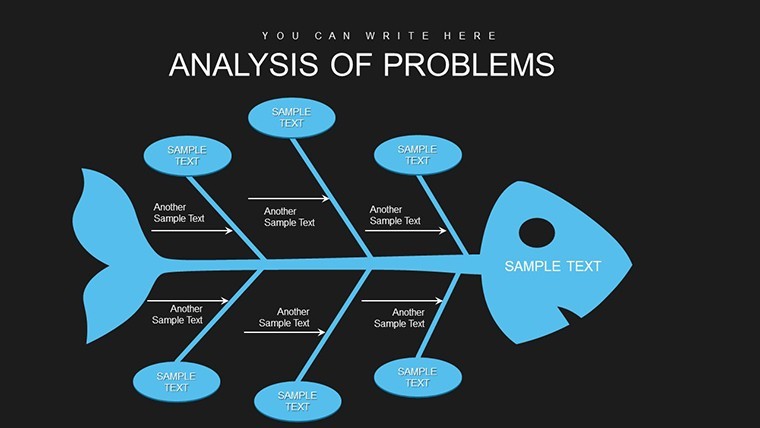
At its heart, the fishbone diagram mimics a skeleton, with the 'head' as the problem and 'bones' branching into categories of potential causes. This template elevates that concept with sleek, modern designs that engage audiences instantly. Benefits include accelerated root cause identification, which, per ASQ studies, can reduce downtime by 30% in industrial settings. Customize categories to suit your industry - swap in 'environment' for sustainability projects or 'measurement' for data-driven roles. The visual appeal lies in clean lines and scalable elements, ensuring your presentation shines in boardrooms or virtual meetings. For educators, it's a boon for teaching critical thinking, as students map out essay structures or historical events' influences.
Standout Features for Seamless Customization
- 28 Versatile Slides: From basic four-branch templates to advanced multi-level diagrams for intricate analyses.
- Full Editability: Modify text, arrows, colors, and layouts in Keynote without hassle, supporting drag-and-drop simplicity.
- Professional Icons: Integrated symbols for categories like people, processes, and machines to enhance clarity.
- Animation Options: Reveal causes progressively to build narrative tension during presentations.
- Brand Alignment Tools: Easy integration of logos and color schemes for a cohesive look.
These features ensure the template adapts to your workflow, whether you're solo brainstorming or facilitating group sessions.
Practical Use Cases Across Industries
In manufacturing, deploy this for defect analysis - branch out causes like faulty machinery or supplier issues, leading to targeted fixes. Business consultants might use it for process optimization, mapping inefficiencies in supply chains with real data from tools like ERP systems. Educators can adapt it for classroom activities, such as analyzing literary conflicts in Shakespeare plays. A case study from Toyota's lean manufacturing highlights how fishbone diagrams slashed production errors by identifying human factors early. Integrate into your routine by starting with problem statements, brainstorming in teams, then refining in Keynote for polished outputs. This approach not only solves immediate issues but cultivates a proactive culture, aligning with ISO 9001 standards for quality management.
Workflow Integration: A Step-by-Step Blueprint
- Define the Problem: Articulate the issue clearly in the diagram's head.
- Categorize Causes: Use pre-set branches or add custom ones based on the 6Ms (Man, Machine, Material, Method, Measurement, Mother Nature).
- Brainstorm Details: Populate sub-branches with specific factors, drawing from team inputs.
- Analyze and Prioritize: Highlight critical causes with bold colors or annotations.
- Develop Solutions: Add action plan slides to transition from analysis to implementation.
- Present and Iterate: Share via Keynote's export features, gather feedback, and update.
This structured method, inspired by Six Sigma practices, ensures thoroughness and repeatability.
Superior to Standard Tools: Why This Template Excels
While Keynote's shape tools allow basic diagrams, this template offers ready-made sophistication, avoiding alignment woes and design inconsistencies. Unlike free alternatives, it includes expert-curated variations backed by quality management insights from pros like Deming. Users praise its time-saving aspects, often cutting prep by half. With terms like "cause-effect mapping" and "root cause visualization," it optimizes for searches on problem-solving aids. Its trustworthiness stems from alignment with established methodologies, ensuring reliable outcomes in high-pressure environments.
Empower your problem-solving prowess - secure this Ishikawa Fishbone Keynote template now and turn obstacles into opportunities for growth.
Frequently Asked Questions
What makes the fishbone diagram effective for root cause analysis?
It systematically categorizes potential causes, promoting comprehensive exploration and team collaboration.
Can I modify the category branches?
Yes, fully editable to add, remove, or rename branches tailored to your specific problem.
Is this template suitable for non-business uses?
Absolutely, from educational lessons to personal goal setting, its flexibility shines.
How do animations enhance presentations?
They allow sequential reveals, building suspense and focusing attention on key causes.
Does it support data import?
Keynote integrates with spreadsheets, so you can pull in data for evidence-based branches.
What if I'm new to Keynote?
The intuitive design and included placeholders make it beginner-friendly with quick learning curves.
Good for
- Project roadmaps and sprint plans
- Product launch timelines
- Quarterly or annual review decks
- Company history and milestone summaries
Licence
reviews
I only downloaded this for the graphs and they worked fine in Keynote.
The layouts made my office report look cleaner.
Some charts needed font adjustments after editing.
Still saved me a lot of time.
Good enough for weekly presentations.
FAQ
Will it work in Google Slides?
Are fonts embedded?
Can I use this for client work?
What's the refund policy?
Do you update the template after purchase?
Similar templates
See all Keynote Charts →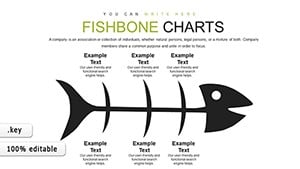
All 28 slides