 Click to zoom
International Currency Exchange PowerPoint Charts: Master Global Finance Visuals
| Format | .pptx |
| Slides | 58 unique layouts |
| Aspect ratio | 16:9 |
| Compatibility | PowerPoint |
| Animated | No |
| Language | English |
| License | Commercial |
| File size | — |
| Version | v1.0 |
| Last updated | July 2023 |
What's inside
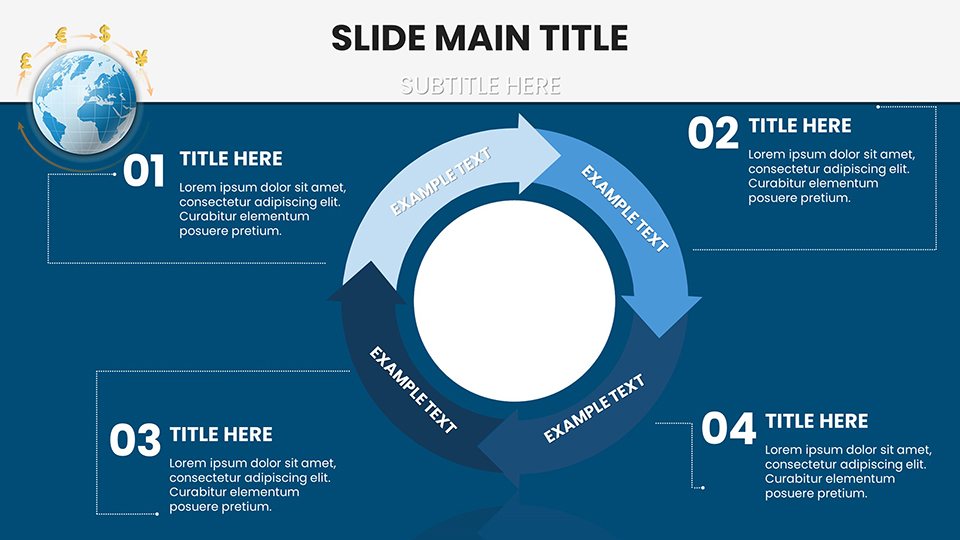
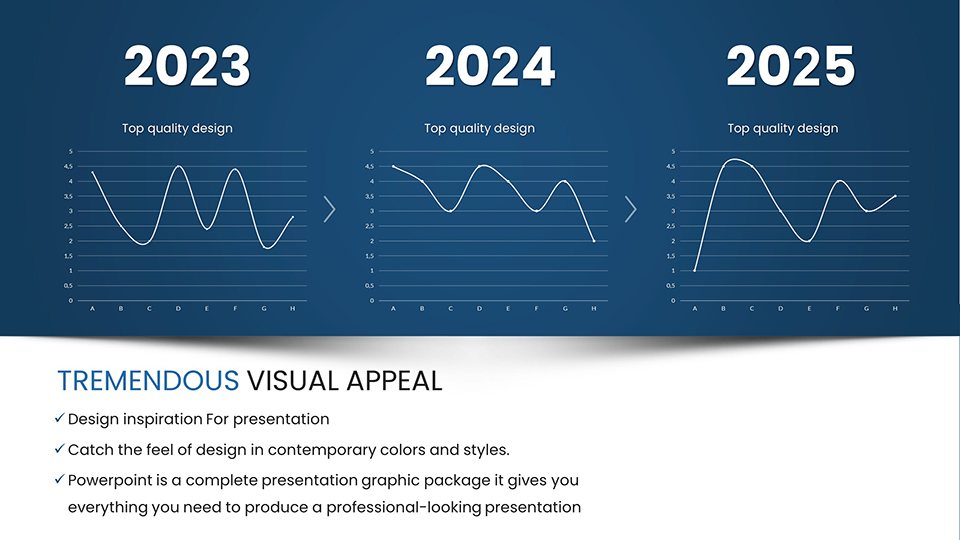
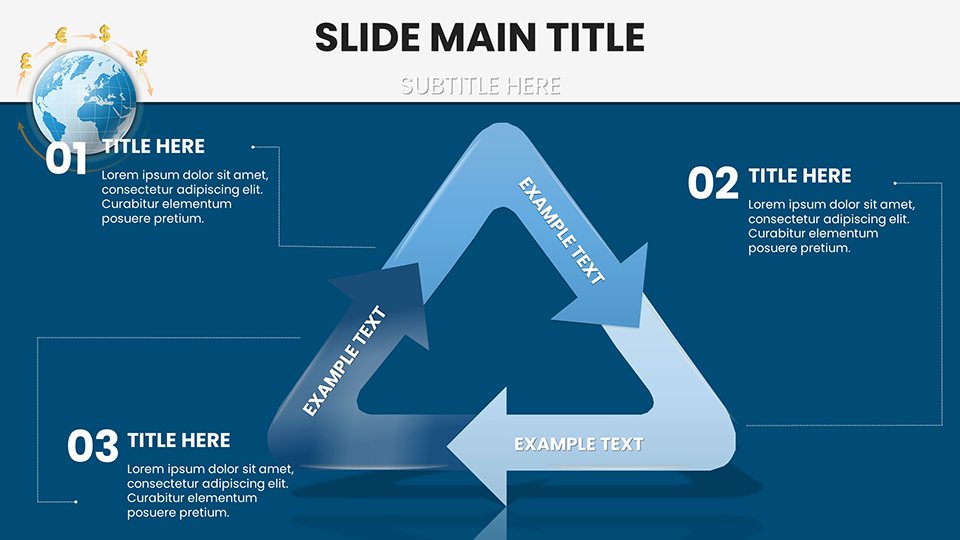
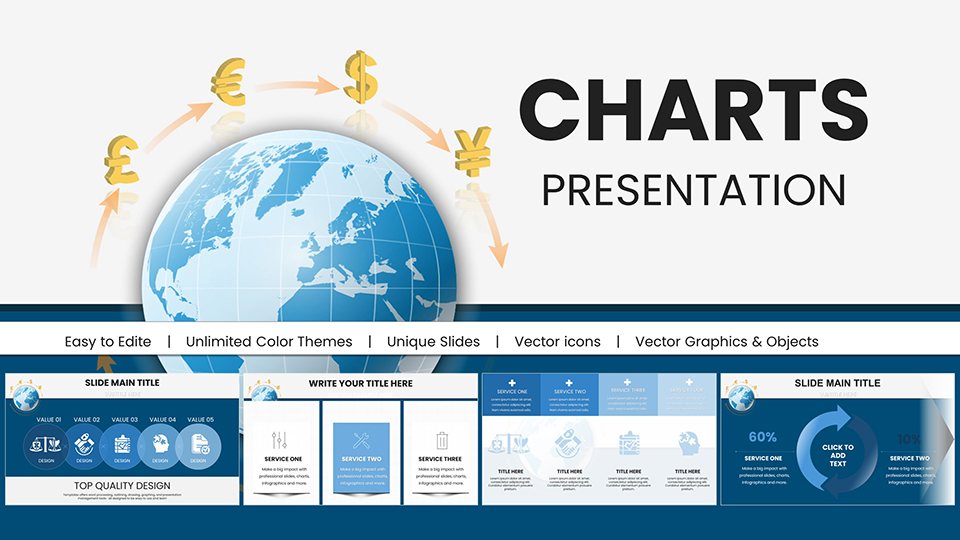
Navigating the intricate web of international finance requires more than just numbers - it demands visuals that clarify volatility, trends, and opportunities at a glance. Our International Currency Exchange PowerPoint charts template delivers exactly that, with 58 meticulously designed editable slides focused on currency dynamics, exchange rates, and economic indicators. Tailored for finance professionals charting forex strategies, businesses expanding internationally, or educators teaching global economics, this template transforms dense data into digestible stories. Picture illustrating the impact of geopolitical events on EUR/USD pairs or forecasting emerging market currencies with precision - all within a sleek, professional framework that aligns with standards from bodies like the International Monetary Fund (IMF).
This isn't your average slide deck; it's infused with matrix-style analyses and analytical tools that draw from real-world scenarios, such as those in Bloomberg reports on currency fluctuations. Fully compatible with PowerPoint and easily adaptable to Google Slides, it supports seamless edits across devices. Customize to reflect your firm's branding, whether it's incorporating your logo into header graphs or tweaking color schemes to denote risk levels - red for depreciations, green for appreciations. By bridging the gap between raw economic data and actionable insights, this template helps you avoid the pitfalls of overcrowded slides, ensuring your audience, from board members to students, grasps the nuances of global trade without confusion.
Essential Features for Finance-Focused Presentations
At the core of this template are features engineered for depth and usability, making it a staple for any financial toolkit.
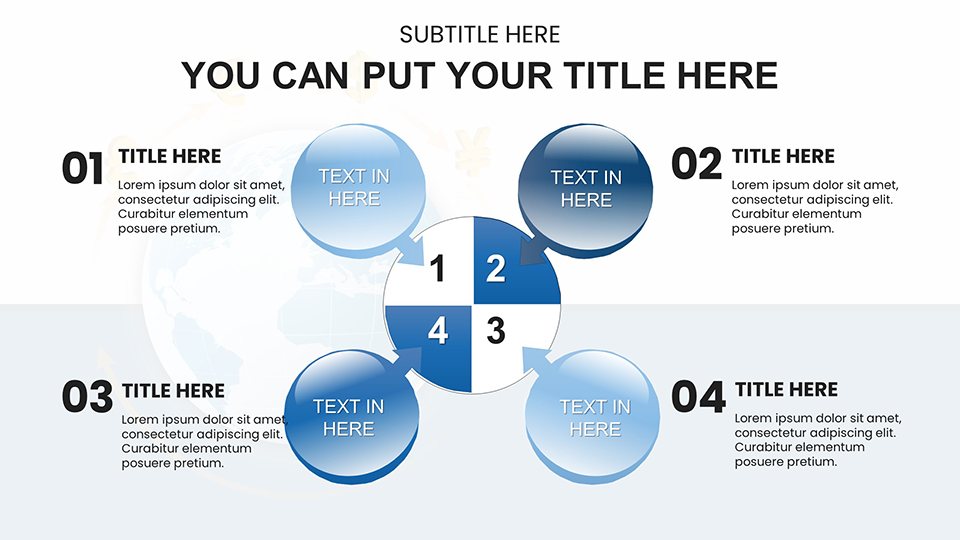
- Matrix Layouts: Advanced grids for multi-currency comparisons, like cross-rate tables showing correlations between major pairs such as GBP/JPY and AUD/USD.
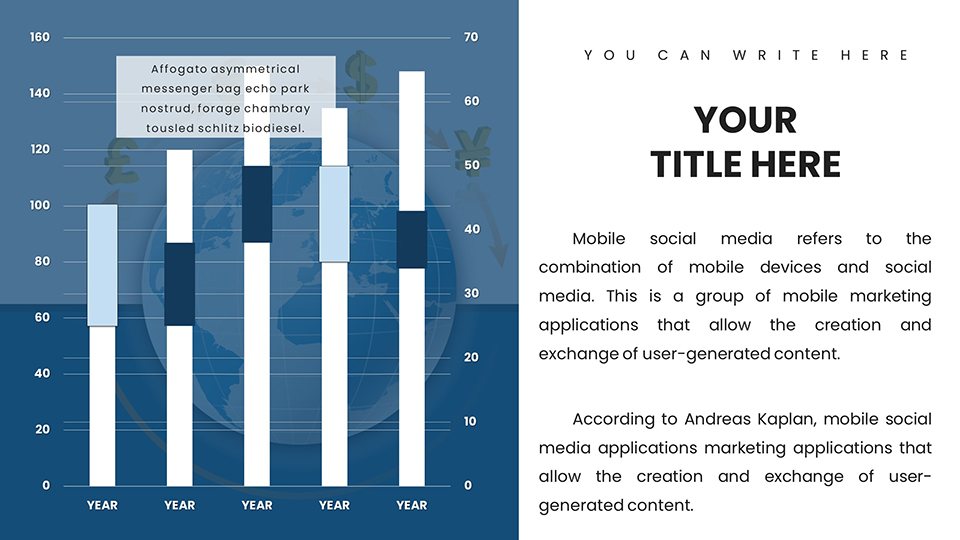
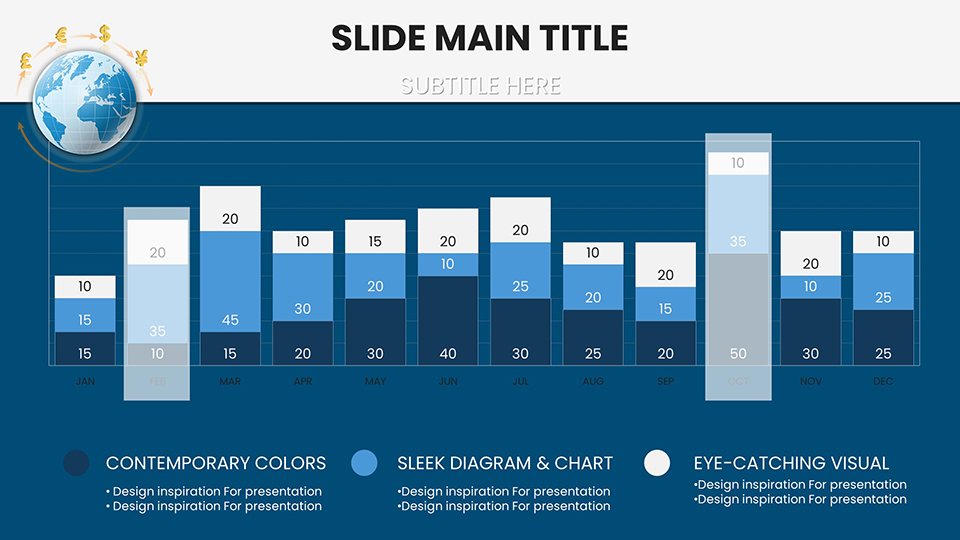
- Analytical Charts: From candlestick simulations for historical exchange data to scatter plots revealing inflation impacts, all with built-in formulas for quick recalculations.
- Customization Depth: Alter axes, legends, and data series effortlessly; integrate live feeds if presenting online for real-time updates.
- Thematic Elements: Currency symbols and world map overlays that enhance global context, editable to highlight specific regions like the Eurozone.
- High-Resolution Graphics: Vector-based for sharp projections, ensuring clarity in high-stakes environments like investor calls.
These elements adhere to authoritative design guidelines, similar to those used in CFA Institute materials, promoting clarity in financial communication.
Unlocking Benefits in Currency Analysis
The advantages extend far beyond aesthetics, addressing pain points like time-consuming chart creation in volatile markets. For instance, a hedge fund analyst could use these slides to model currency risk scenarios, reducing preparation time and enhancing forecast accuracy.
Businesses gain an edge in strategic planning, visualizing export/import cost implications amid currency swings, potentially safeguarding profits. Educators find value in interactive elements that facilitate classroom discussions on topics like Bretton Woods agreements, fostering deeper understanding. With in mind, the template incorporates best practices from seasoned economists, ensuring presentations are not only visually compelling but substantively robust - think integrating data from reliable sources like the World Bank for trustworthy projections.
Practical Step-by-Step Applications
Here's how to apply this template in everyday scenarios:
- Forex Market Report: Begin with a dashboard slide aggregating major indices, then drill down with line charts tracking daily fluctuations, customized with annotations for key events like Fed announcements.
- Global Business Strategy: Use heat maps to display currency strength across continents, aiding decisions on overseas investments.
- Economic Forecasting: Employ funnel charts to show transaction flows, from initial trade to hedged outcomes, with editable variables for scenario planning.
- Educational Lectures: Radar charts compare currency stability factors, encouraging student interaction through modifiable parameters.
- Risk Management Presentation: Portfolio matrices outline diversification strategies, with bubble sizes representing exposure levels.
Each application leverages the template's analytical prowess, weaving in LSI concepts like "exchange rate volatility" for natural relevance.
Superior to Standard PowerPoint Tools
Unlike basic charts that lack depth, this template offers specialized matrices that handle multivariate data effortlessly, saving hours compared to manual builds. It integrates smoothly with tools like Excel for data linking, and its designs promote better retention, as per studies on visual learning in finance.
Pro Tips from Finance Design Experts
Maximize impact by layering data progressively in animations to build suspense in trend reveals. Use neutral palettes for objectivity, and cite sources inline for added authority - echoing practices in peer-reviewed economic journals.
Secure Your Financial Edge Now
Don't let currency complexities cloud your message - download this template today and present with the confidence of a market leader. Instant access means you're ready for tomorrow's trades.
Frequently Asked Questions
How customizable are the matrix charts?Fully, including data inputs, colors, and layouts for tailored financial insights.Does it support real-time data integration?Yes, via Excel links or manual updates for dynamic presentations.What format is the download?.pptx, compatible with PowerPoint and Google Slides.Suitable for non-finance users?Absolutely, with intuitive designs for educators and beginners.Are animations included?Pre-built for smooth transitions in data reveals.Good for
- Project roadmaps and sprint plans
- Product launch timelines
- Quarterly or annual review decks
- Company history and milestone summaries
Licence
reviews
The International Currency Exchange template has sleek matrix layouts for comparing GBP/JPY and AUD/USD pairs with clear red/green color coding for depreciations. As a finance analyst, the candlestick charts and world map overlays saved me hours on forex reports. Professional and editable.
Needed quick visuals for a global economics lecture. The 58 slides include scatter plots for inflation impacts and thematic currency symbols. Looks IMF-inspired but the animations felt a bit slow on my older laptop. Still very useful.
Downloaded for a board presentation on emerging markets. The heatmap-style cross-rate tables and editable axes made data pop. Clean corporate design with high-res vectors. Exactly what I needed under deadline pressure.
The currency pair dashboards are detailed with real Bloomberg-like scenarios. Practical for hedge fund work, though some matrix grids took time to tweak for my branding. Solid finance tool overall.
As a student prepping an international trade project, the funnel charts for transaction flows and annotations for Fed events were spot-on. Vibrant yet professional colors helped my slides stand out.
Great for visualizing EUR/USD volatility. The template's analytical depth with live feed support is impressive, but I wish there were more preset color themes for different risk levels.
FAQ
Will it work in Google Slides?
Are fonts embedded?
Can I use this for client work?
What's the refund policy?
Do you update the template after purchase?
Similar templates
See all PowerPoint Charts →
All 58 slides