 Click to zoom
Innovative Solutions Keynote Charts: Visualizing Tech Reliability for Enterprises
| Format | .pptx |
| Slides | 14 unique layouts |
| Aspect ratio | 16:9 |
| Compatibility | PowerPoint |
| Animated | No |
| Language | English |
| License | Commercial |
| File size | — |
| Version | v1.0 |
| Last updated | September 2021 |
What's inside
In today's data-driven enterprise landscape, presenting innovative solutions isn't just about facts - it's about weaving a story of reliability and efficiency that resonates with decision-makers. Enter our Innovative Solutions Keynote Charts template: 14 editable slides that spotlight technical setups for data service nodes, drawing from proven technologies applied in major corporations. Ideal for IT managers, consultants, and innovators, these charts help you demonstrate how cutting-edge products enhance system stability, much like implementations at companies such as Google or IBM, where similar visuals clarified complex architectures in shareholder meetings.
With a focus on cycle and pie charts, this template simplifies intricate processes, allowing quick data modifications to fit your narrative. It's more than a tool; it's a bridge to better understanding, saving you from the tedium of custom design and letting you concentrate on insights. Compatible with Keynote, it ensures seamless edits, aligning with standards from bodies like the Institute of Electrical and Electronics Engineers (IEEE) for technical presentations.
Core Features Enhancing Technical Presentations
This template stands out with its enterprise-grade designs, optimized for clarity in high-stakes environments. Cycle charts loop through processes, while pie segments break down components, all with high customizability.
- Advanced Editability: Tweak data, hues, and layouts to match your tech stack.
- Process-Oriented Graphics: Cycles for workflows, pies for distributions, with icons for nodes and connections.
- Reliability Boost: Visuals proven to increase comprehension, as per studies from Gartner on data visualization.
- Resolution Excellence: Sharp for projectors or screens, maintaining detail in large venues.
Benefits extend to real efficiency gains: A Deloitte report on digital transformation noted that effective charting of solutions like these accelerated adoption by 30% in enterprises.
Slide-by-Slide Exploration
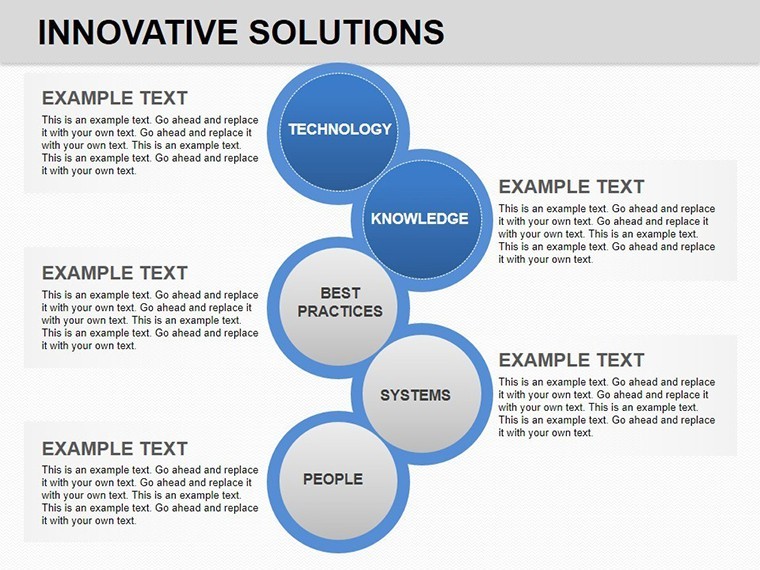
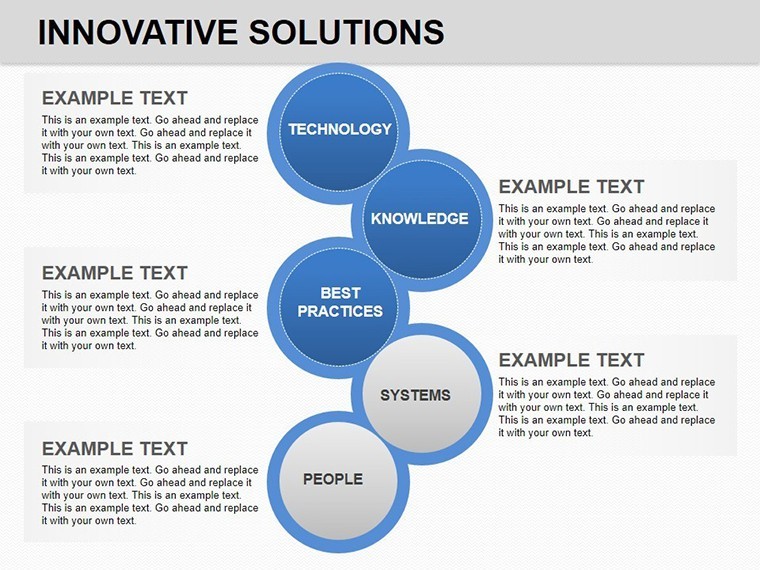
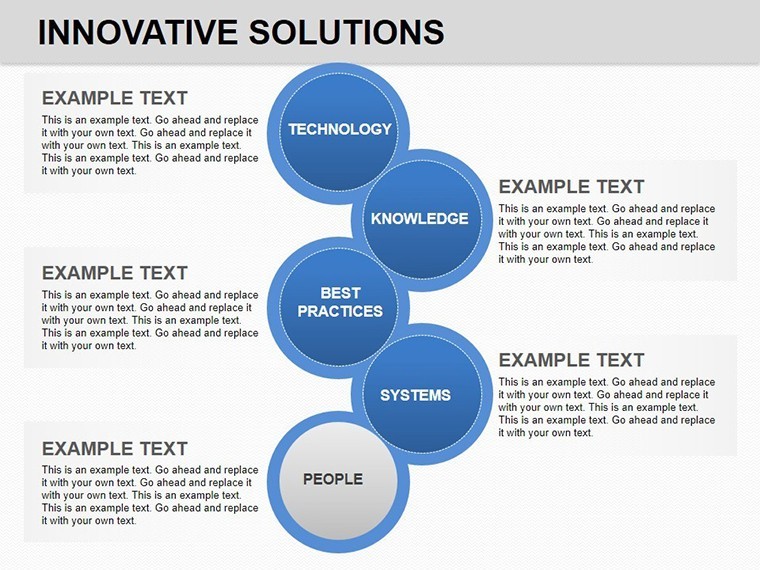
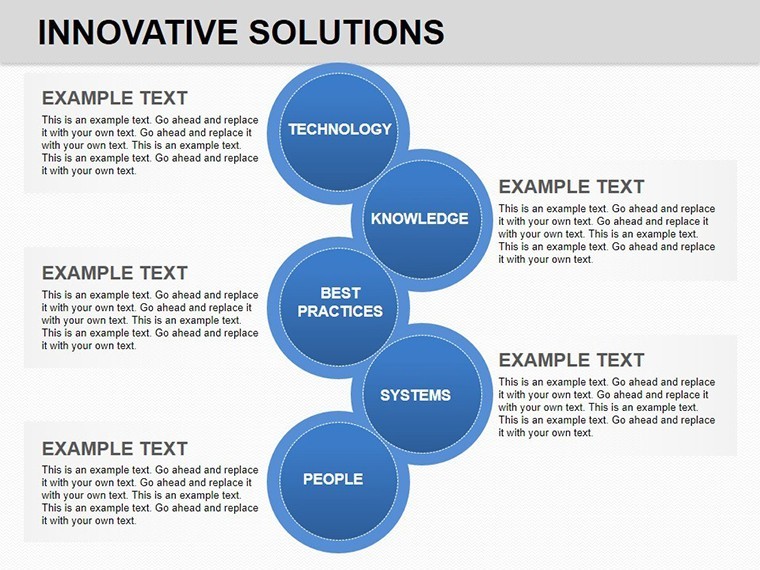
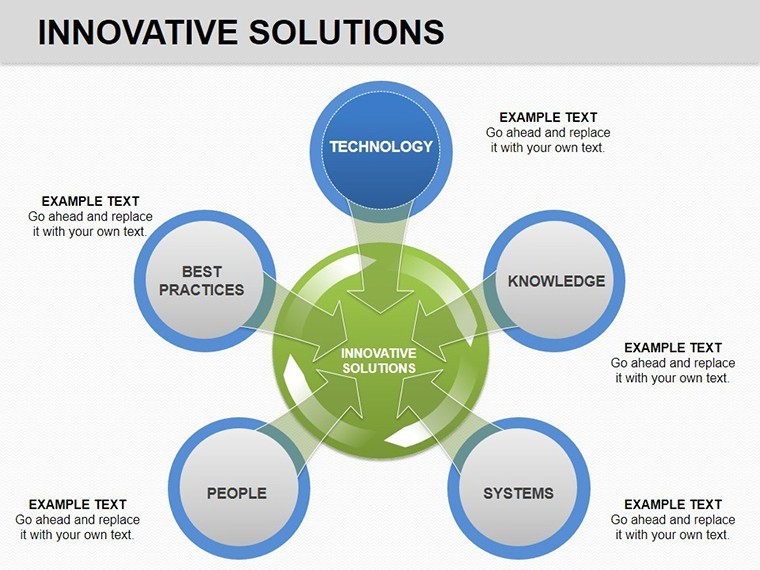
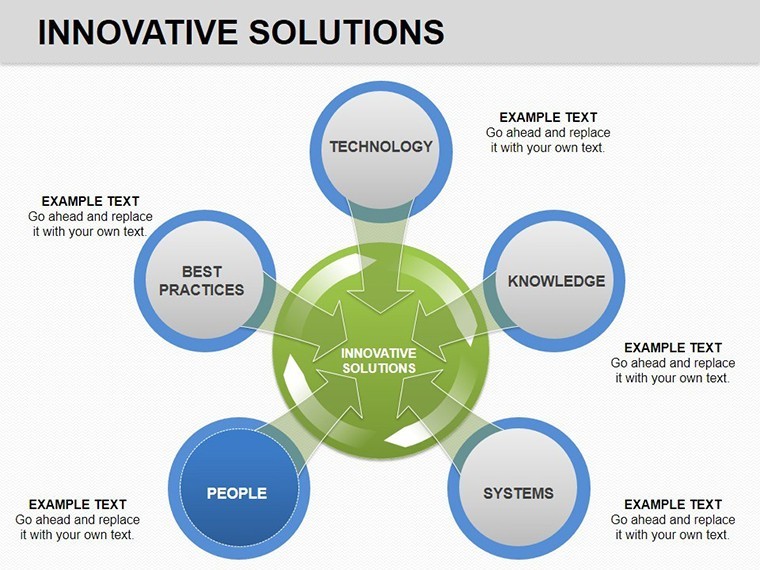
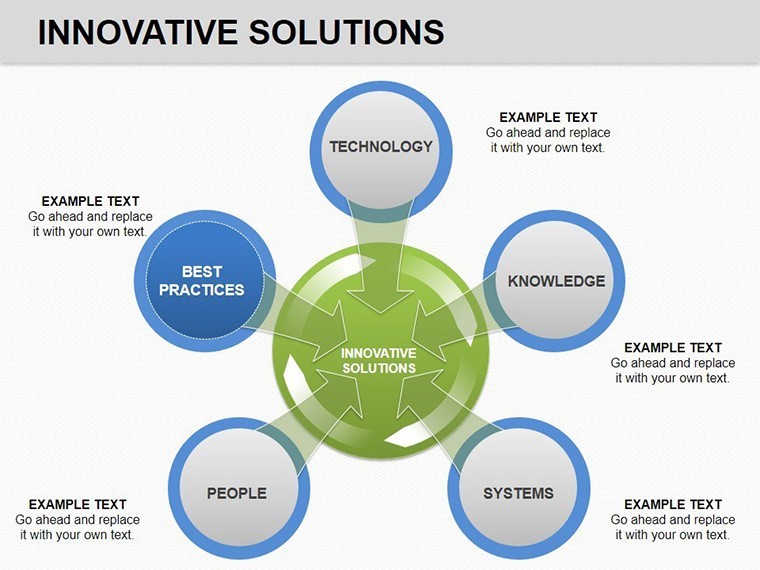
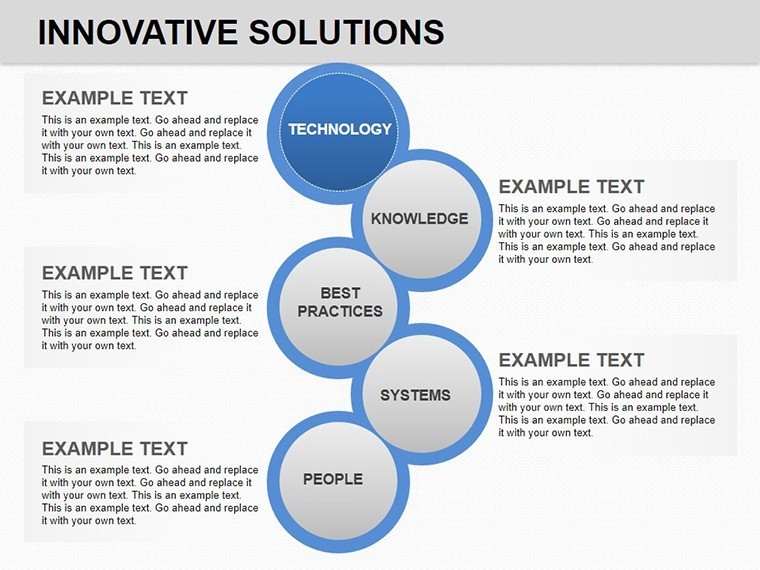
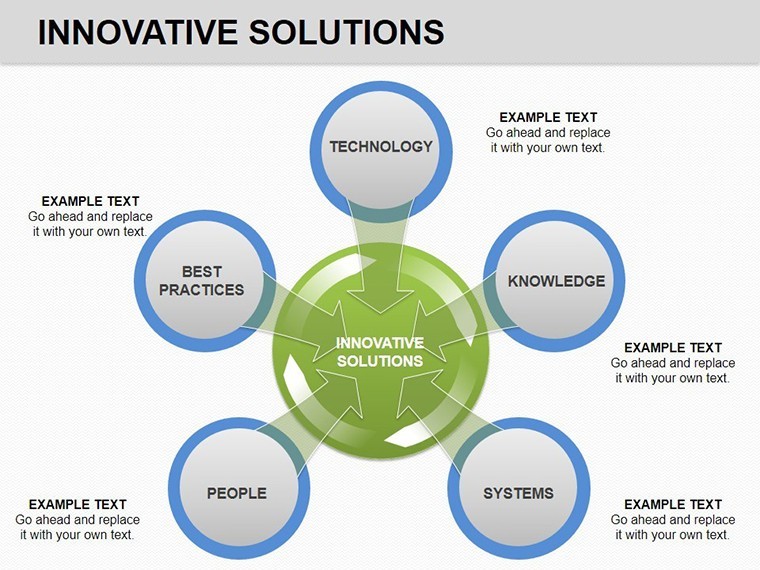
Slide 1 introduces a master cycle chart for overall solution architecture. Slides 2-5 detail pie breakdowns of resource allocation in data nodes. Slides 6-9 combine cycles with pies for hybrid views, like error handling loops.
Slides 10-14 focus on case-specific applications, with expandable sections for metrics. Each supports annotations for technical specs, making them ideal for audits or proposals.
Enterprise Applications and Case Studies
Apply these in cloud migration pitches, showing node reliability improvements. Real-world: Oracle's use of similar visuals in their tech briefs enhanced client trust.
For cybersecurity, visualize threat response cycles, aligning with NIST frameworks.
- Tech Demo Workflow: Load data into Slide 4, animate cycles, present with confidence.
- Board Report: Use Slide 11 for pie-based KPI distributions.
- Innovation Workshop: Customize Slide 8 for brainstorming sessions.
Tailoring Tips for Tech Pros
Integrate APIs for live data, use subtle animations. Compared to raw Keynote, this offers pre-optimized tech themes.
Secure Your Edge in Innovation
Trust this template for authoritative presentations. Innovate with ease - purchase your Innovative Solutions Charts today.
Frequently Asked Questions
How do these charts improve reliability visuals?
By using cycles and pies to clearly depict node interactions and distributions.
Compatible with which Keynote versions?
Works with Keynote 9 and above.
Suitable for small businesses?
Yes, scalable for any size enterprise.
File format details?
.key for direct Keynote use.
Export options?
Easily to PDF or images.
Data input method?
Manual edit or import from CSV.
Good for
- Project roadmaps and sprint plans
- Product launch timelines
- Quarterly or annual review decks
- Company history and milestone summaries
Licence
reviews
Used it for a last minute KPI report.
The line charts looked sharp during the meeting.
Pretty simple template but that’s what I needed.
Some colors felt a little flat.
Overall it did the job without much editing.
FAQ
Will it work in Google Slides?
Are fonts embedded?
Can I use this for client work?
What's the refund policy?
Do you update the template after purchase?
Similar templates
See all Keynote Charts →
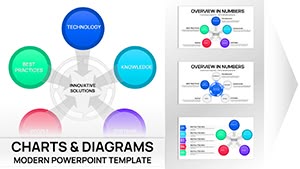


All 14 slides