 Click to zoom
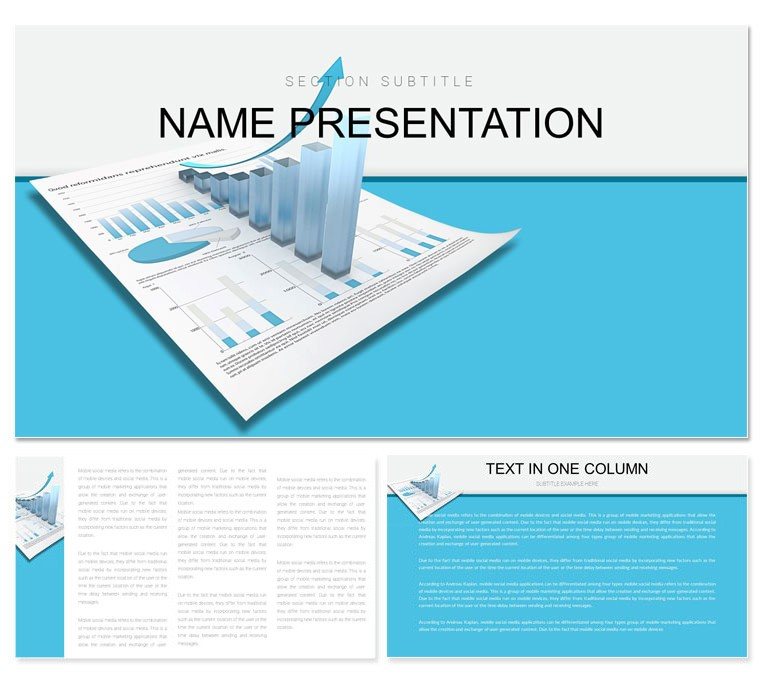
Graphic Analysis Keynote Themes and Template
| Format | .pptx |
| Slides | 3 unique layouts |
| Aspect ratio | 16:9 |
| Compatibility | PowerPoint |
| Animated | No |
| Language | English |
| License | Commercial |
| File size | — |
| Version | v1.0 |
| Last updated | March 2022 |
What's inside
Data doesn't speak for itself - until you give it the right voice. The Graphic Analysis Keynote template empowers business planners, commerce analysts, and solution architects to decode datasets through 28 modern diagrams. With three masters, backgrounds, and seven schemes, this editable powerhouse fits finance, accounting, and beyond, turning spreadsheets into strategic showstoppers.
Picture dissecting sales funnels: layered bar stacks reveal drop-offs, or scatter plots cluster customer segments for targeted tactics. It's built for those moments when clarity cuts through noise, compatible across iWork for seamless collaboration.
Dissecting Data with Precision Tools
Diagrams cater to depth - from bubble charts sizing opportunities by impact to tree maps hierarchizing categories. Edit axes for custom scales, infuse with brand hues, or overlay trends for temporal layers.
High-quality inscriptions and images elevate professionalism, while layouts balance density with whitespace for digestible insights.
From Raw Data to Polished Deck: A Guide
- Gather Inputs: Link slides to data sources for auto-population.
- Choose Visuals: Match diagram types to questions - lines for trends, areas for compositions.
- Refine Details: Animate data points to emerge contextually.
- Annotate Key Findings: Add tooltips or highlights for emphasis.
- Validate Narrative: Cross-check with summary slides for cohesion.
This ritual transforms analysis into advocacy, aligning visuals with objectives.
Applications in Business and Beyond
Commerce teams use radar charts for competitor benchmarking, echoing how consultancies plot market positions. In planning, waterfall diagrams trace variance causes, pinpointing levers.
For solutions pitches, matrix grids weigh pros-cons, guiding decisions visually.
- Sales Forecasting: Projection curves with confidence bands.
- Budget Breakdowns: Treemaps for allocation views.
- Risk Assessment: Heat grids for probability impacts.
Integrate with Tableau exports for enriched hybrids.
Modern Design Meets Analytical Rigor
Unusual combinations of form and function - sleek sans-serifs pair with geometric icons, ensuring accessibility. Full editability spans photos to palettes, outpacing basic builds in speed.
Animations like sequential clusters build complexity gradually, mirroring analytical progression.
Color Schemes for Thematic Depth
Seven options from cool analytics blues to warm strategy oranges, each harmonizing elements intuitively.
Enhancing Analytical Workflows
Template quarterly reports from prior skeletons, iterating insights. Share for peer review, merging feedback fluidly.
Illuminate your data - acquire the Graphic Analysis Keynote template for $22 and reveal hidden stories.
Frequently Asked Questions
What diagram types are featured?
28 including bars, lines, scatters, and maps for comprehensive analysis.
Easy photo integration?
Yes, drag-and-drop placeholders with auto-crop.
Suitable for accounting?
Ideal, with ledgers and balance visuals.
Animation controls?
Granular, from speeds to sequences.
Mac and iPad support?
Full across iWork ecosystem.
Good for
- Project roadmaps and sprint plans
- Product launch timelines
- Quarterly or annual review decks
- Company history and milestone summaries
Licence
reviews
Used it for a school economics presentation and the graphs looked fine on the projector.
I liked the darker background because my screenshots stood out better.
A couple layouts felt repetitive but it worked okay once I moved things around.
Downloaded this mostly for the comparison charts and they were actually easy to edit.
The whole thing feels more practical than fancy which I honestly prefer.
FAQ
Will it work in Google Slides?
Are fonts embedded?
Can I use this for client work?
What's the refund policy?
Do you update the template after purchase?
Similar templates
See all Keynote templates →

All 1 slides