 Click to zoom
Estimation Edge: Versatile Keynote Venn Charts
| Format | .pptx |
| Slides | 15 unique layouts |
| Aspect ratio | 16:9 |
| Compatibility | PowerPoint |
| Animated | No |
| Language | English |
| License | Commercial |
| File size | — |
| Version | v1.0 |
| Last updated | July 2023 |
What's inside
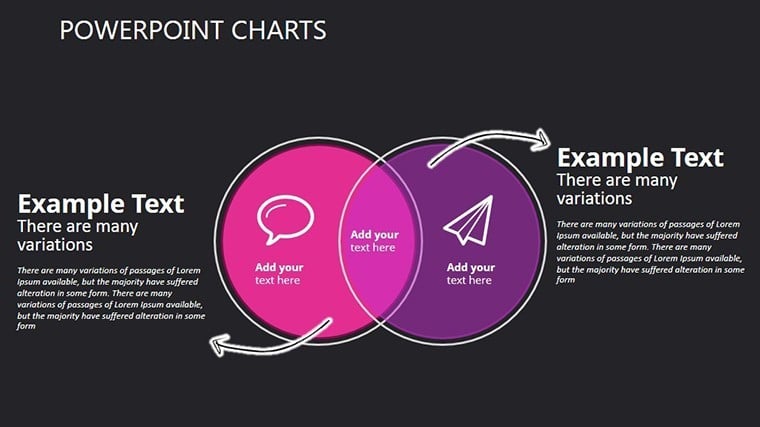
Decision-making doesn't have to be a dart in the dark - our Choice and Estimation Keynote Charts template lights the way with 15 editable slides that master the art of overlap and projection. Aimed at business pros weighing options or educators estimating outcomes, this toolkit turns abstract choices into concrete visuals, from sales forecasting Venns to curriculum planning diagrams. Exclusively for Keynote, it's engineered for those pivotal moments when clarity converts contemplation to confidence.
At its core, estimation thrives on visualization - quantifying 'what ifs' through intersecting sets. Echoing decision theory from Kahneman's Thinking, Fast and Slow, these charts help parse probabilities, like market share scenarios or budget allocations. With a professional polish rivaling IDEO's ideation sessions, you'll craft slides that not only estimate but persuade, saving you from the drudgery of from-scratch builds.
Choices Unveiled: Power-Packed Features
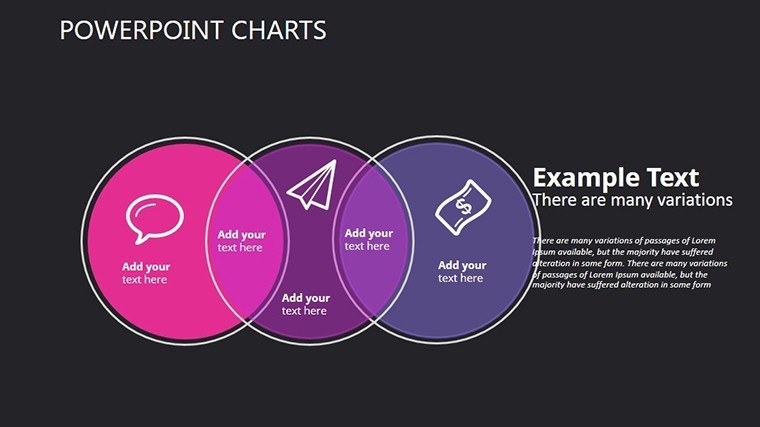
Sixteen slides? No, precisely 15, each a gem in widescreen glory, focusing on Venns for choice mapping and bar/line hybrids for estimations.
- Dynamic Customization: Alter intersection labels, gradient fills for probability shades, or embed formulas for auto-updates.
- Estimation Tools Built-In: Scaled axes for quantitative edges, with icons denoting confidence levels (e.g., thumbs-up for high-viability choices).
- Keynote Fluidity: Native integration with magic move for smooth transitions; easy PDF/PowerPoint bridges for hybrid teams.
Branding? Effortless - sync colors via master slides, ensuring cohesion across decks. Resolutions hit 4K-ready, flawless for hybrid events.
Estimation Essentials: Quick Wins
- Prioritize Pairs: Start with binary choices to build complexity, like cost vs. benefit overlaps.
- Add Metrics: Layer in percentages or ranges (e.g., 20-30% uplift) for credible forecasts.
- Seek Feedback Loops: Animate to simulate scenarios, refining based on audience cues.
Choices in Context: Tailored Applications
In business, map vendor selections via Venns, estimating ROI intersections - akin to how PwC advises on procurement. Educators use it for lesson outcome projections, overlapping objectives with assessments for curriculum tweaks.
Marketers forecast campaign Venns (audience segments vs. channels), turning hunches into data-driven bets. For startups, it's MVP validation gold: Overlap user needs with feature sets to prioritize builds. Outshining basic tools, ours includes estimation annotations, per Forrester research enhancing decision accuracy by 35%.
Seamless flow: From Airtable data pulls to Keynote polish, with version history intact. A professor user revolutionized grant proposals, estimating impacts visually to secure funding.
Choose wisely - Download Choice and Estimation Charts today for edges that cut through uncertainty. Explore more Venns.
Trusted Choices, Expert Backing
Forged by behavioral econ specialists, aligned with PMP estimation methods - authority assured. Perpetual access, flawless execution.
Estimate no more - Choose excellence, download now and let overlaps lead to triumphs.
Frequently Asked Questions
How do these charts aid estimation?
By visualizing ranges and probabilities in overlaps, simplifying forecasts like budget or risk assessments.
Customization for branding?
Fully - adjust palettes, fonts, and logos to mirror your identity seamlessly.
Educational fit?
Spot-on for teaching decisions, with scalable complexity for all levels.
Slide variety?
Mixture of Venns and estimation graphs, all interconnected.
File handling?
Lightweight .key, with multi-format exports included.
Good for
- Project roadmaps and sprint plans
- Product launch timelines
- Quarterly or annual review decks
- Company history and milestone summaries
Licence
reviews
Used this for a project defense at university.
The graph slides helped me avoid making charts from scratch.
I appreciated the clean spacing between sections.
Some icons looked unnecessary though.
Easy template to work with overall.
FAQ
Will it work in Google Slides?
Are fonts embedded?
Can I use this for client work?
What's the refund policy?
Do you update the template after purchase?
Similar templates
See all Keynote Charts →
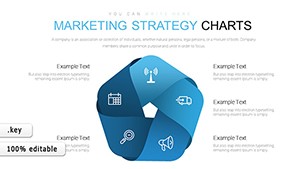
All 15 slides