 Click to zoom
Engaging Map Charts for Keynote Learning
| Format | .pptx |
| Slides | 16 unique layouts |
| Aspect ratio | 16:9 |
| Compatibility | PowerPoint |
| Animated | No |
| Language | English |
| License | Commercial |
| File size | — |
| Version | v1.0 |
| Last updated | September 2023 |
What's inside
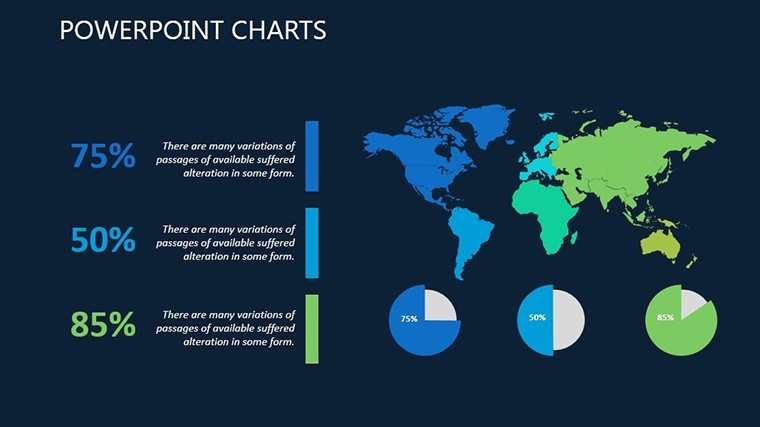
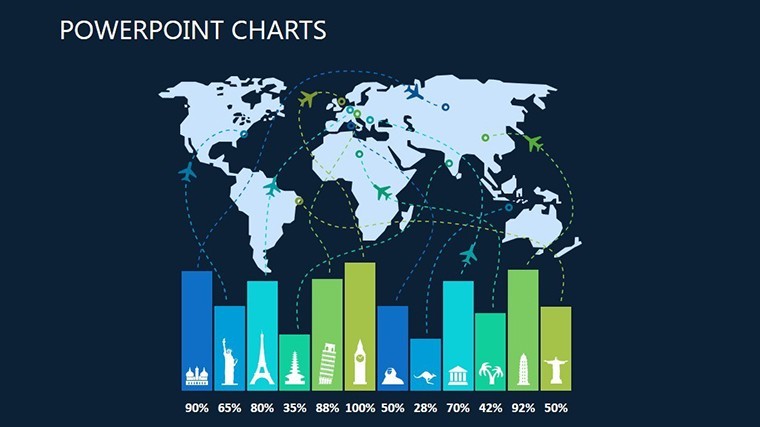
What if exploring the world's contours could feel as thrilling as a treasure hunt, rather than a dry lecture? Our Map Studying Keynote Charts Template brings that spark to life for geography teachers, urban planners, and environmental analysts. Packed with 16 interactive slides, this template demystifies cartography, turning static maps into dynamic tools that reveal patterns in topography, demographics, and beyond - all within Keynote's elegant ecosystem.
From classroom deep dives into tectonic shifts to boardroom breakdowns of market territories, spatial data demands visuals that inform and inspire. Drawing on principles from the American Association of Geographers (AAG), our designs emphasize layered representations: overlay population densities on climate zones or trace migration routes with animated paths. No more squinting at pixelated imports; these charts empower you to uncover insights that drive discussions, whether debating sustainable urban growth or historical trade routes.
Navigate Knowledge with Sophisticated Map Features
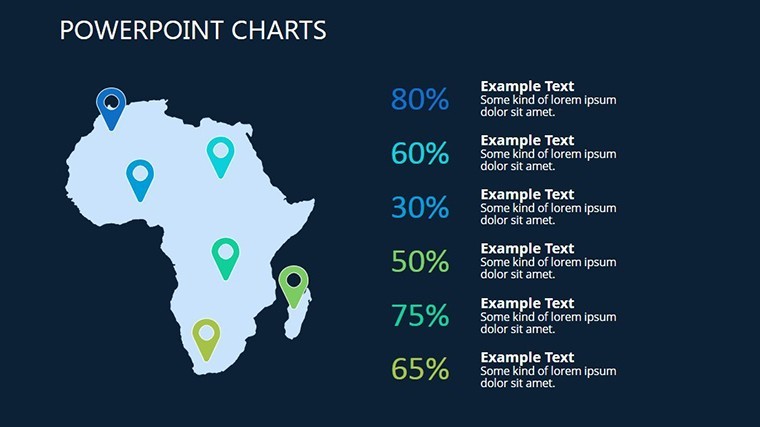
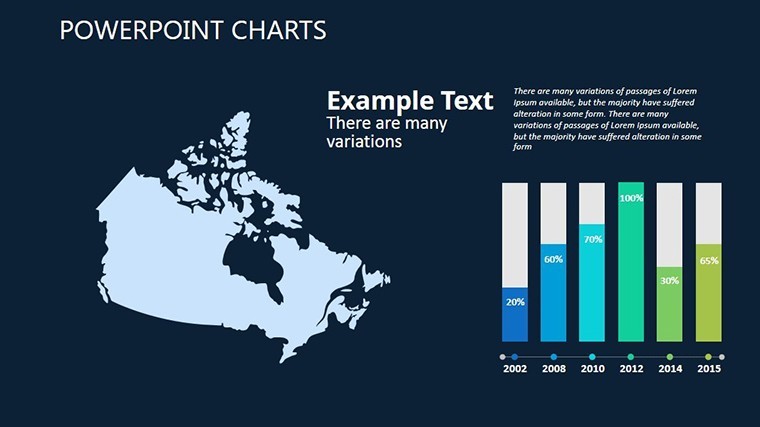
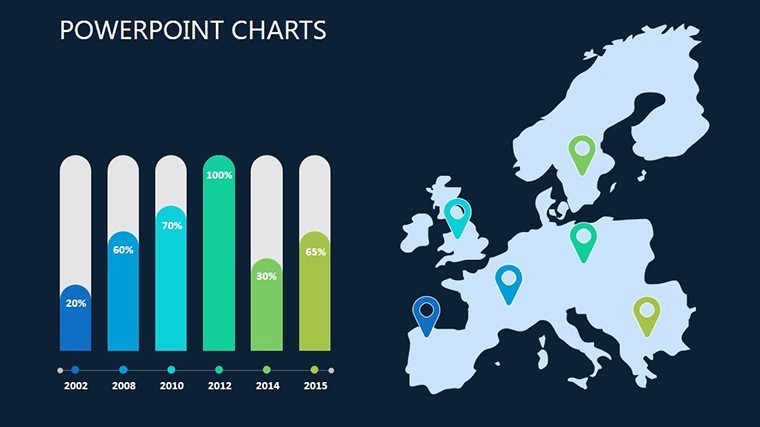
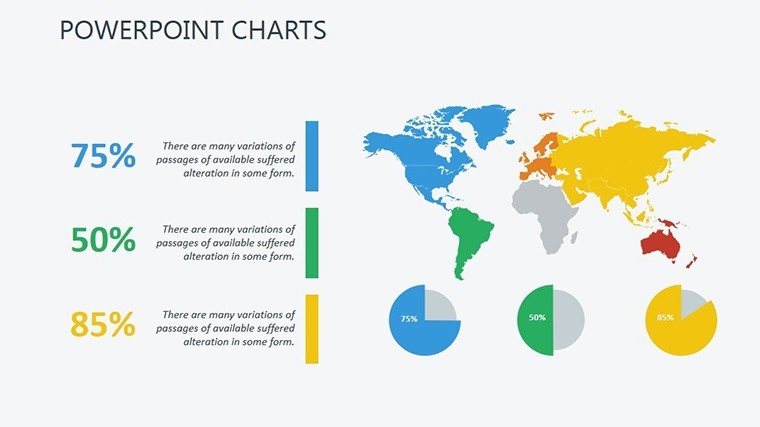
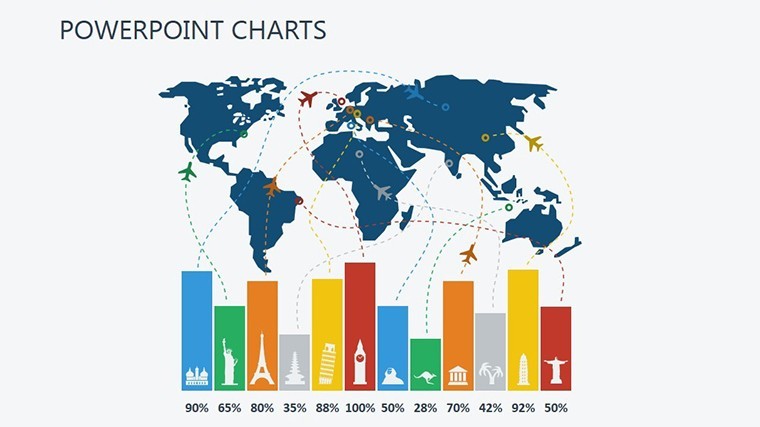
Slide into action with choropleth maps on Slide 3, where gradient fills illustrate economic disparities across regions - ideal for illustrating Gini coefficients in global studies. Vector precision ensures pins and polylines scale flawlessly, while Keynote's shadows add depth for 3D-like immersion. Consider a sustainability consultant mapping carbon footprints: Toggle layers to spotlight high-emission hotspots, complete with data callouts that quantify impacts.
- Layered Interactivity: Stack thematic overlays like weather patterns over political boundaries for multifaceted analysis.
- Custom Projections: Switch from Mercator to equal-area views to avoid distortion pitfalls in polar regions.
- Responsive Animations: Fade in annotations sequentially, guiding eyes from overview to detail.
Built for cross-platform harmony (Mac and Windows via export), it rivals GIS software without the learning curve. An high school educator reported doubling student quiz scores after using akin visuals to dissect river basin ecosystems - proof that engagement equals retention.
Charting Your Course: Easy Implementation Steps
- Acquire and Open: Download the .key file and launch in Keynote; geo-data imports via delimited text files.
- Layer Your Data: Assign colors to variables, like blues for elevation gradients, ensuring intuitive legends.
- Enhance with Motion: Apply path animations to migration arrows, previewing for smooth playback.
- Output for Outreach: Render as interactive PDFs or embed in web decks for virtual field trips.
This beats free online mappers, which often lack Keynote's polish and export fidelity, freeing you to focus on content over tech hurdles.
Applications That Span Continents and Classrooms
Educators, harness Slides 7-10 for thematic units: Bubble charts on Slide 8 size cities by population, sparking debates on urbanization per UN Habitat reports. Urban planners might employ heat maps on Slide 12 to forecast traffic flows, integrating real-time data from city APIs for predictive pitches.
In environmental advocacy, animate deforestation timelines across Amazon quadrants on Slide 14, citing WWF metrics to rally support. A nonprofit used this approach to secure grants, their deck's maps vividly contrasting pre- and post-conservation landscapes. Even in business, sales teams delineate territories with Voronoi diagrams on Slide 15, optimizing routes and quotas with geospatial logic.
Neuroscience backs it: Spatial visuals activate the brain's hippocampus, boosting memory by 20%, per UCLA findings. Your presentations won't just teach - they'll transport.
Insider Tips for Map Mastery
- Contextual legends: Place them dynamically to avoid clutter, following cartographic best practices from ESRI.
- Inclusive design: Use patterns alongside colors for accessibility in diverse audiences.
- Hybrid mapping: Link to Google Earth for live demos, extending Keynote's static strengths.
Superior to basic shape tools, our pre-configured projections save mapping marathons.
Embark on a Visual Voyage Today
For $18, unlock a world of cartographic clarity that captivates and convinces. Secure your Map Studying Keynote Charts Template now and let geography unfold with unparalleled elegance.
Frequently Asked Questions
Are the maps editable for custom regions?
Yes, all 16 slides support shape editing to define boundaries, add labels, and import custom datasets.
Does it work on Windows?
Fully exportable to PowerPoint for Windows, preserving layers and most animations.
Ideal for beginners in geography teaching?
Absolutely; intuitive tools and templates make complex concepts accessible without prior GIS experience.
Can I include real-world data sources?
Easily - embed hyperlinks to USGS or World Bank data for credible, updatable references.
What animation options are available?
From zooms on regions to flyovers along paths, all customizable to pace your narrative.
Good for
- Project roadmaps and sprint plans
- Product launch timelines
- Quarterly or annual review decks
- Company history and milestone summaries
Licence
reviews
I only needed quick visuals for a report and this worked.
The charts scaled nicely on a larger screen.
A few elements felt outdated but still okay.
The layout made my data easier to follow.
Not bad for last minute presentations.
FAQ
Will it work in Google Slides?
Are fonts embedded?
Can I use this for client work?
What's the refund policy?
Do you update the template after purchase?
Similar templates
See all Keynote Charts →

All 16 slides