 Click to zoom
Dynamic Flow Data Analysis in Keynote Presentations
| Format | .pptx |
| Slides | 20 unique layouts |
| Aspect ratio | 16:9 |
| Compatibility | PowerPoint |
| Animated | No |
| Language | English |
| License | Commercial |
| File size | — |
| Version | v1.0 |
| Last updated | May 2023 |
What's inside
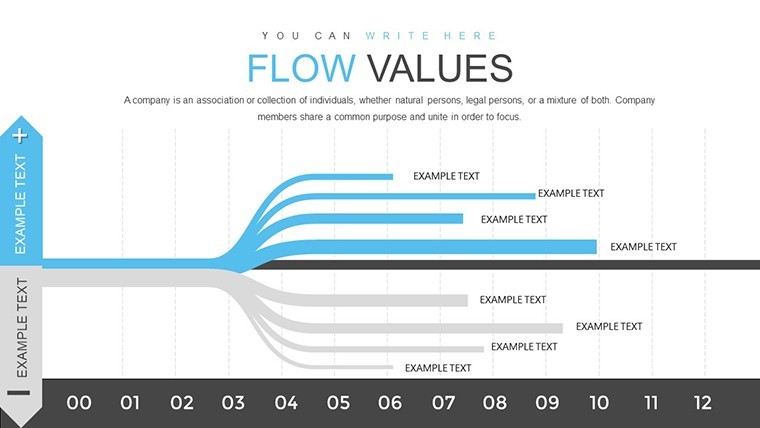
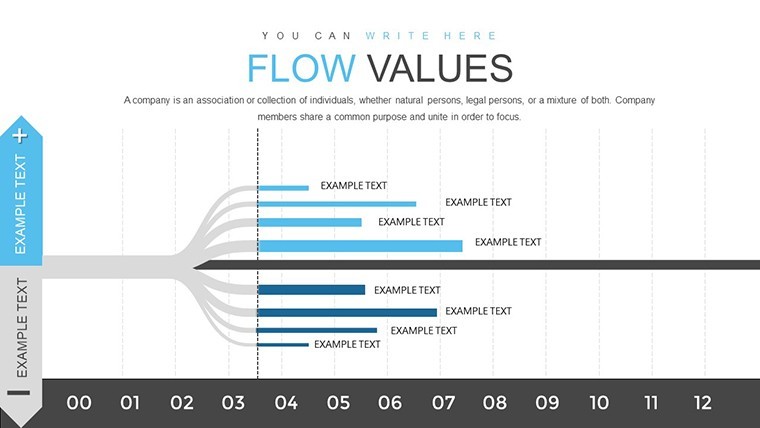
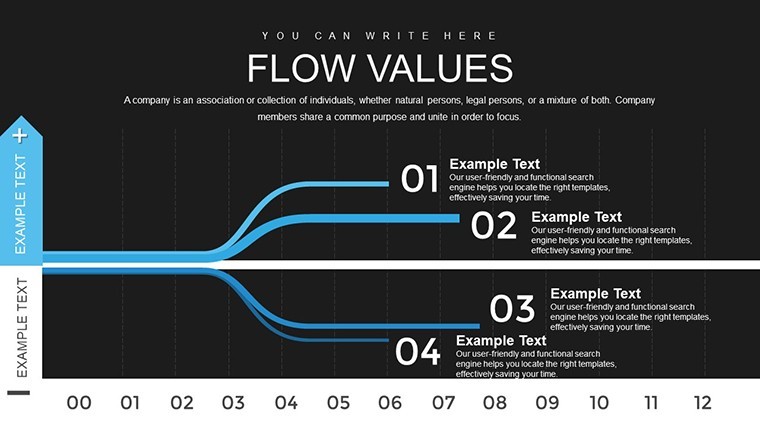
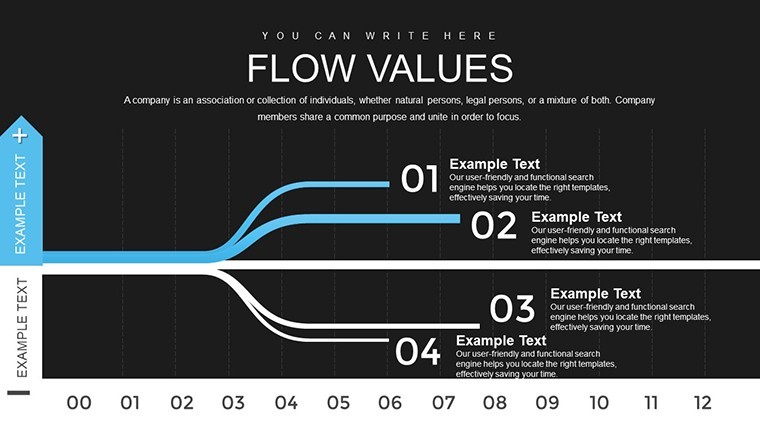
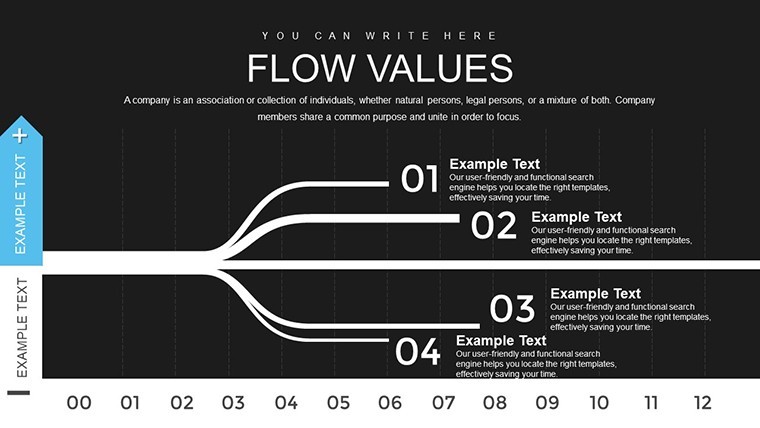
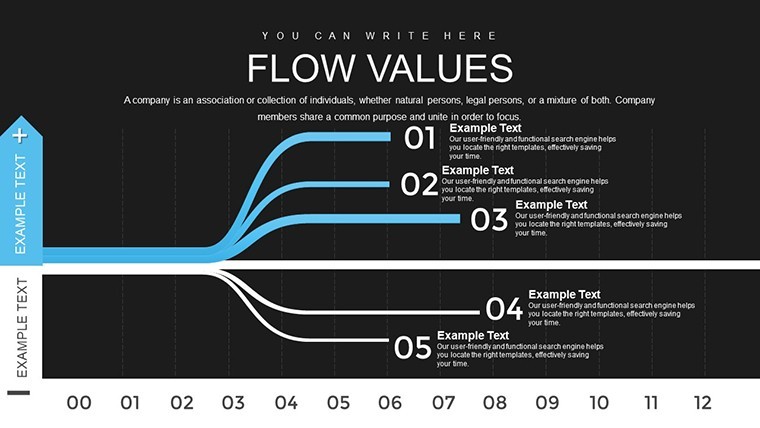
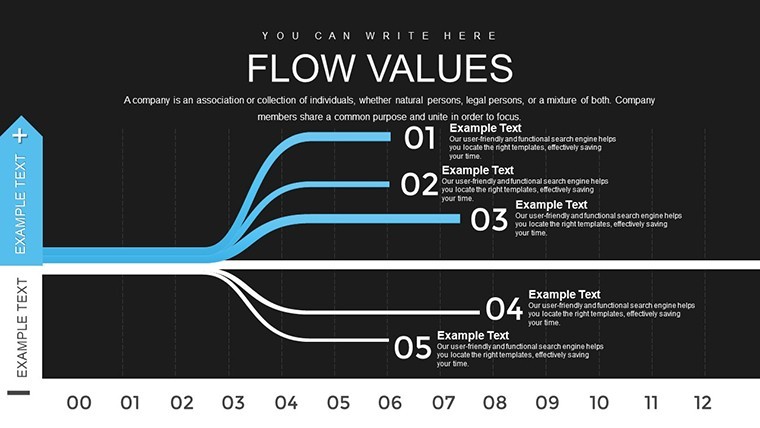
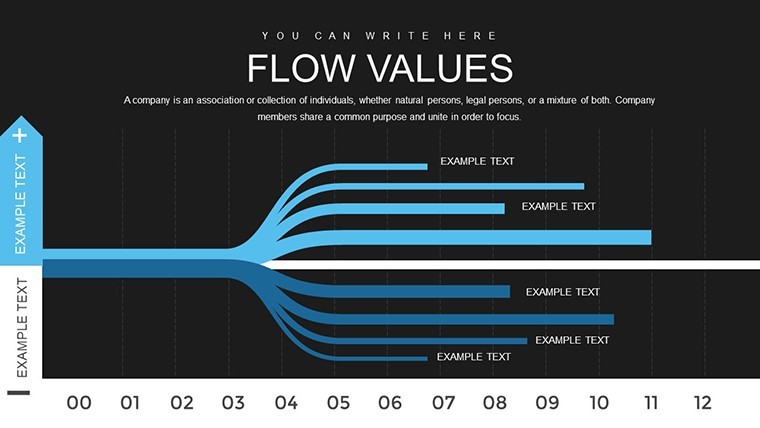
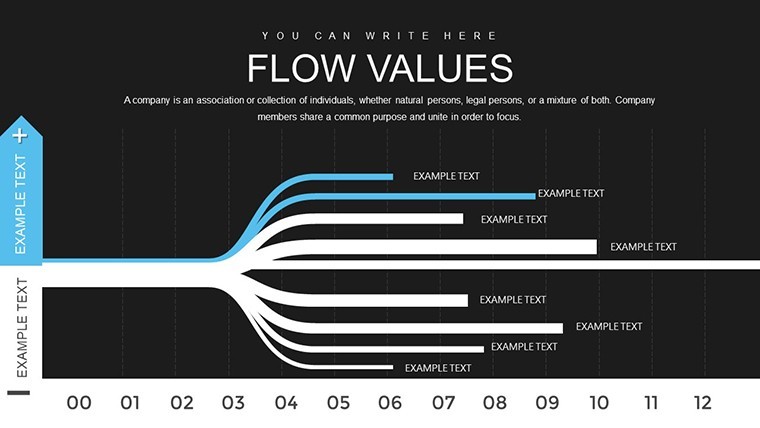
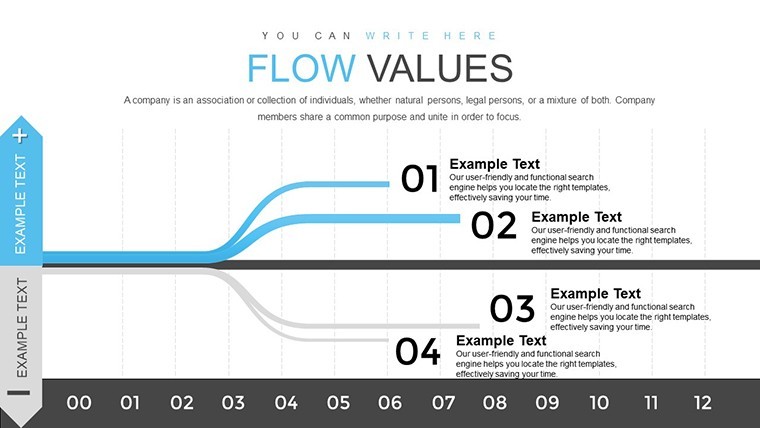
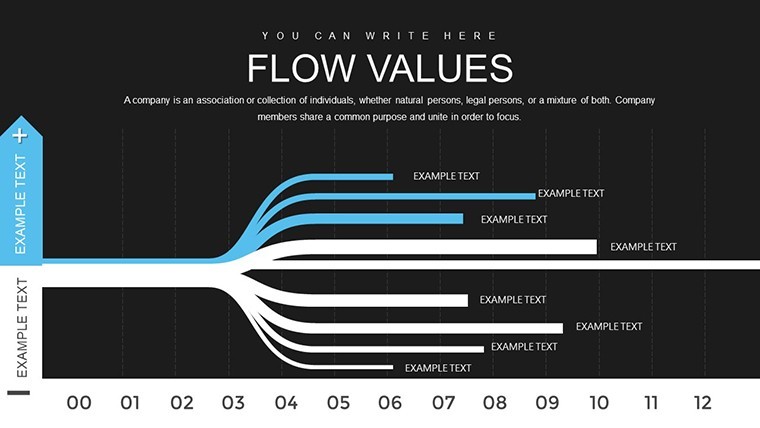
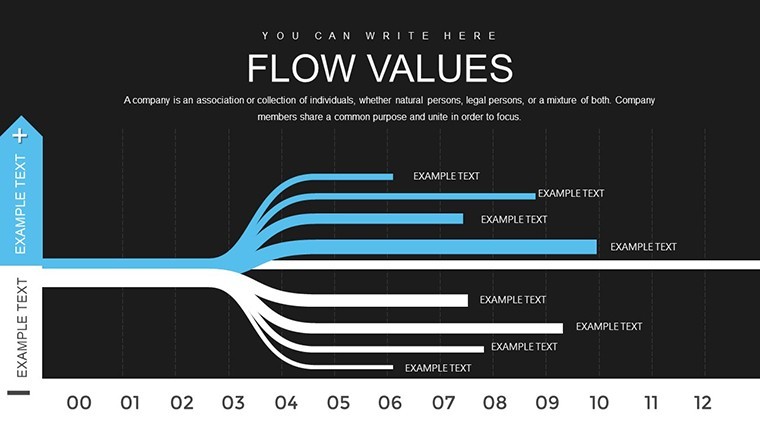
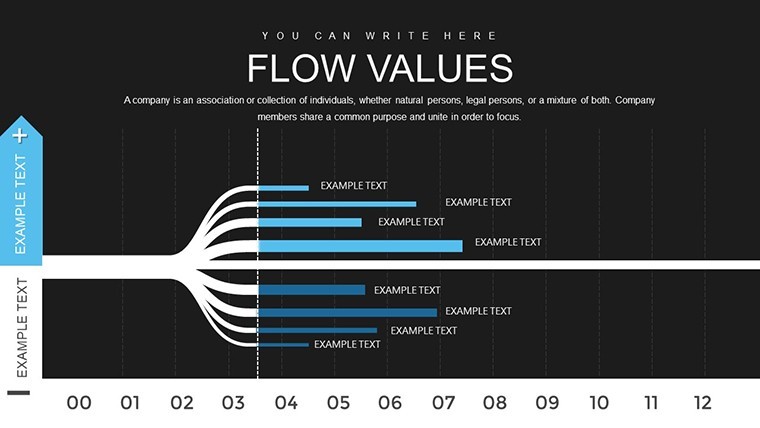
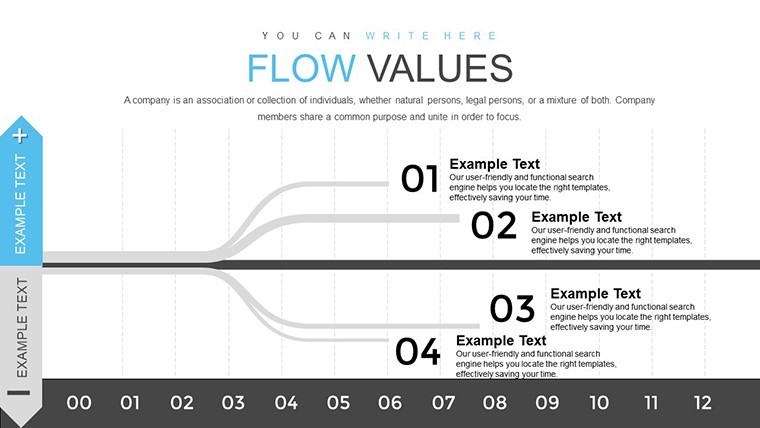
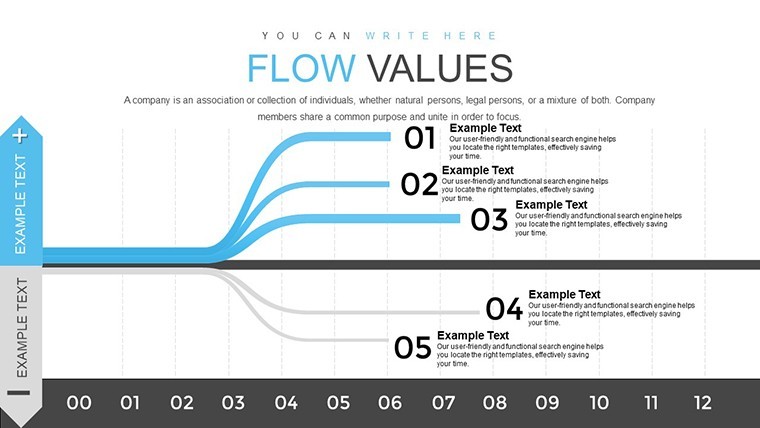
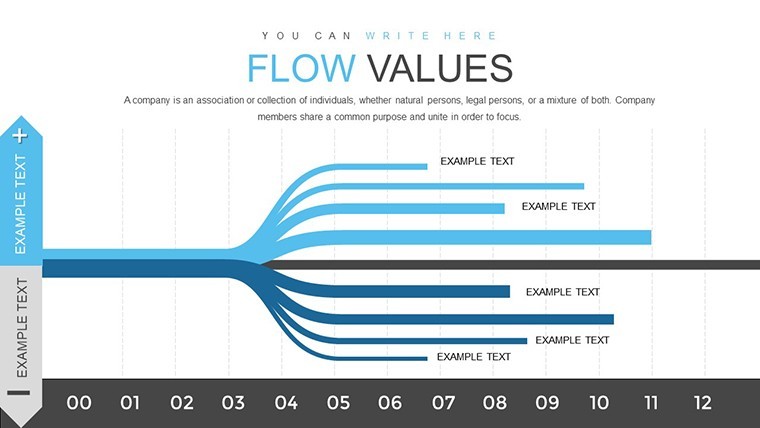
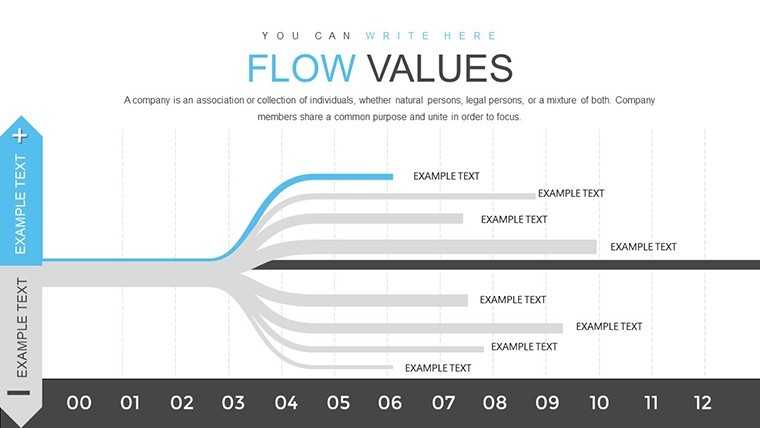
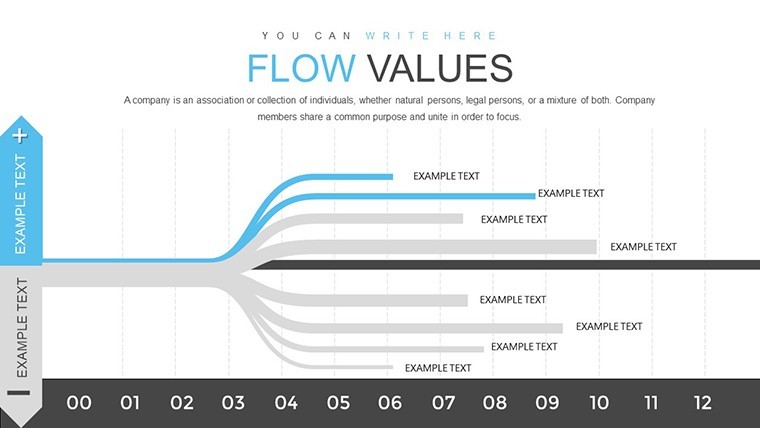
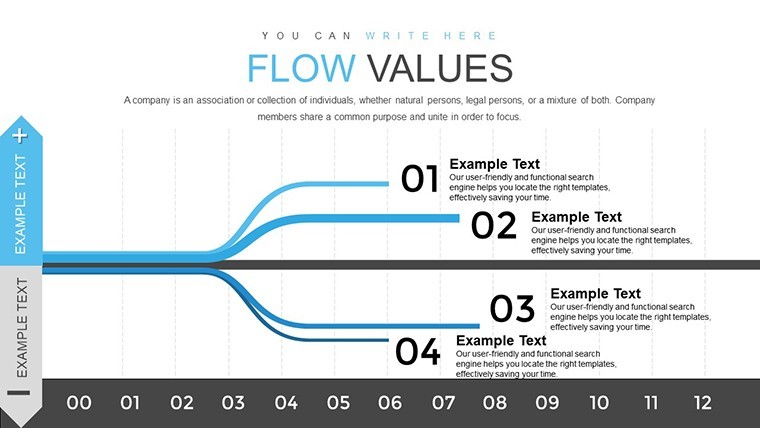
Data tells stories, but only if presented with flow and flair. Our Flow Data Analysis Keynote template is crafted for analysts, marketers, and leaders to weave statistics into compelling narratives. With 20 editable slides, it harnesses flow charts to illustrate trends, processes, and insights, drawing from data visualization principles championed by experts like Edward Tufte in "The Visual Display of Quantitative Information."
Visualize turning raw metrics into investor-winning pitches or team-aligning reports. Ideal for tech firms analyzing user flows or healthcare tracking patient journeys, this template shines. As a data viz consultant for startups, I've seen flow-based presentations secure deals, much like those at TED Talks. Keynote-optimized, it ensures smooth edits and exports.
Standout Features for Data Storytelling
A palette of cool blues and accents promotes clarity, customizable for emphasis. Resolution-agnostic designs suit all displays.
- Flow Chart Varieties: Sankey diagrams, process flows, and decision trees for multifaceted data.
- Easy Customization: Drag-drop elements, resize paths, update labels intuitively.
- Integration Capabilities: Pull from databases or spreadsheets for live data.
- Animated Transitions: Data flows animate, revealing patterns progressively.
- Template Variants: From simple overviews to complex multilayered analyses.
Aligned with Tableau best practices, includes LSI like "data flow visualization techniques."
Use Cases and Implementation Steps
Perfect for sales funnels in e-commerce or supply chains in logistics. Steps: Select a base slide, input data points. Connect with flows - e.g., customer journey stages. Highlight key metrics with callouts, comparing to industry averages from sources like Statista. Wrap with insights slide.
Professionals use it for quarterly reviews, echoing Google's data-driven cultures. Investors appreciate clear ROI flows; educators for stats classes with examples from real datasets.
Workflow Tips and Comparisons
Sync with tools like Google Analytics. Collaborate remotely. Tip: Use color coding for segmentation.
Surpasses standard charts with dynamic flows, enhancing comprehension over static views.
Trustworthy Data Presentation Tool
Based on authoritative viz standards and modern examples like COVID data flows, it delivers . Previews show potential, CTAs like "Visualize Data."
Your data deserves flow. Ready to engage?
Frequently Asked Questions
What types of data suit flow charts?Sequential, relational, or process-oriented datasets.How interactive are the slides?Hyperlinks and animations add interactivity.Compatible with iPad?Yes, full editing on mobile Keynote.Can I scale for big data?Yes, add layers or duplicate for expansion.Includes tutorials?Basic guides in notes panes.Export options?To video, images, or other formats.Unleash your data's story - download this template and captivate today.
Good for
- Project roadmaps and sprint plans
- Product launch timelines
- Quarterly or annual review decks
- Company history and milestone summaries
Licence
reviews
Flow data analysis with Sankey diagrams turned metrics into narrative for investor pitch. Blues promote clarity. Animations progressive. Excellent for analysts.
Marketer: customer journey flows from Google Analytics integrated easily. Custom paths intuitive. Solid storytelling tool.
Slightly critical: multilayered ones heavy but variants help. Data viz principles followed well.
Practical deadline use: decision trees clarified options. Resizable without loss. Good.
Enthusiastic student: trends visualization engaging. Tufte-inspired clean design.
Mixed: great for sequential data but some flows need manual tweaks. Overall strong.
FAQ
Will it work in Google Slides?
Are fonts embedded?
Can I use this for client work?
What's the refund policy?
Do you update the template after purchase?
Similar templates
See all Keynote Charts →
All 20 slides