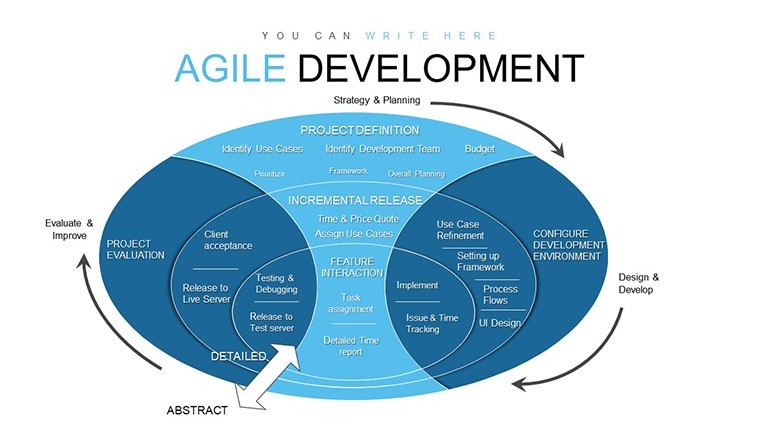
 Click to zoom
Agile Methodology Keynote Charts: 45 Slides
| Format | .pptx |
| Slides | 45 unique layouts |
| Aspect ratio | 16:9 |
| Compatibility | PowerPoint |
| Animated | No |
| Language | English |
| License | Commercial |
| File size | — |
| Version | v1.0 |
| Last updated | September 2021 |
What's inside
Innovation thrives in environments that adapt swiftly to change, and agile methodology is the cornerstone for such dynamism. Our Agile Development Methodology Keynote Charts template, with its expansive 45 editable slides, is crafted for innovators, project managers, and teams seeking to embody agile's core values and principles. From interactive development cycles to self-organizing team structures, this tool addresses the limitations of traditional methods, offering visuals that make complex practices accessible. Perfect for software developers, product owners, or business agile coaches, it facilitates presentations that not only explain but also inspire adoption. With Keynote's robust features, customize effortlessly to fit your project's narrative, ensuring your audience grasps how periodic updates and expert collaborations drive success. Step away from rigid processes and embrace a template that propels your innovative projects forward with clarity and engagement.
The Essence of Agile in Visual Form
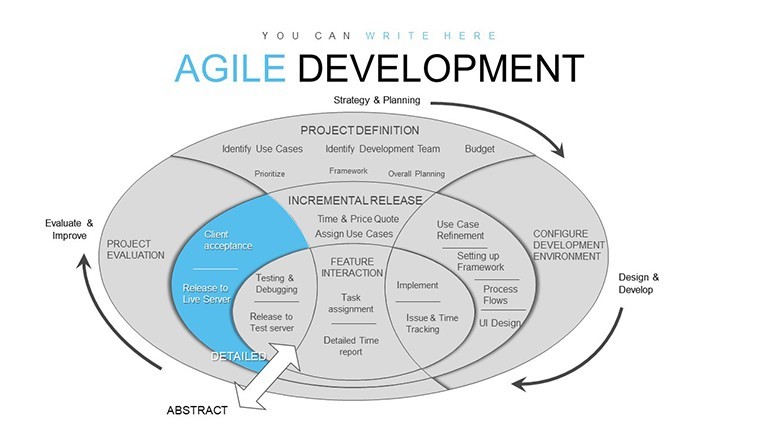
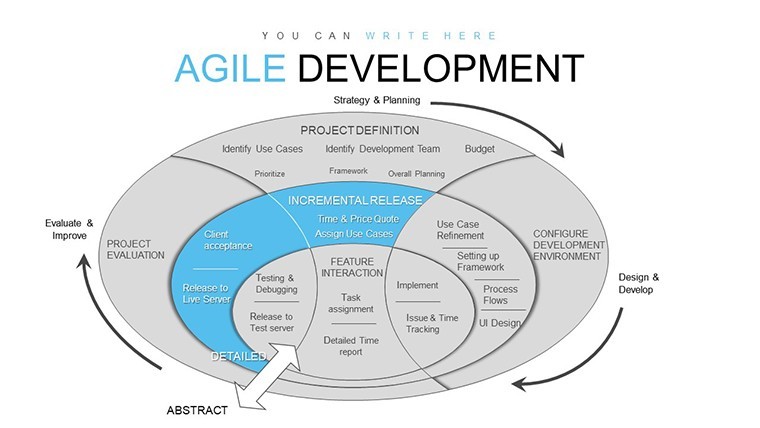
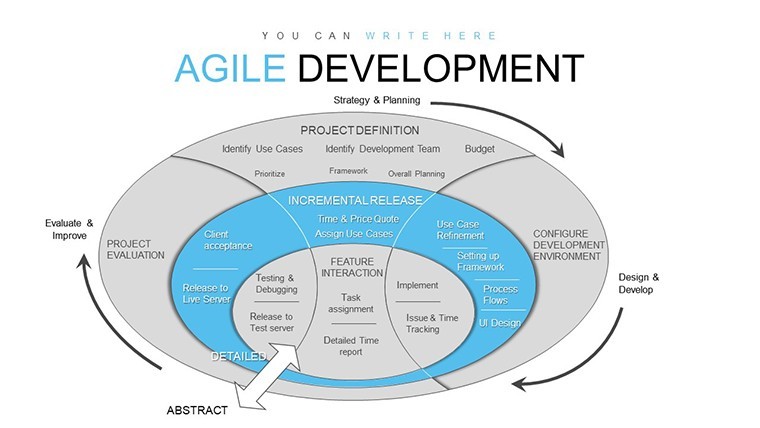
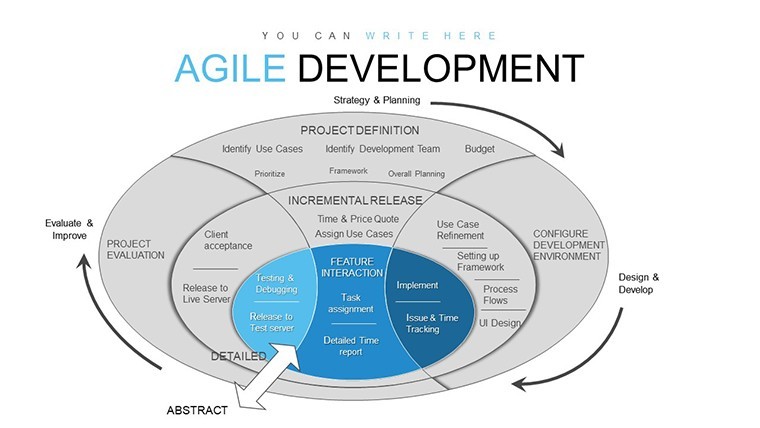
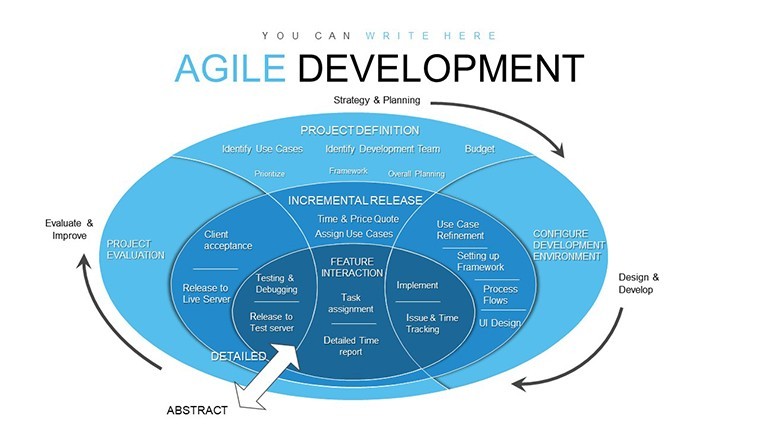
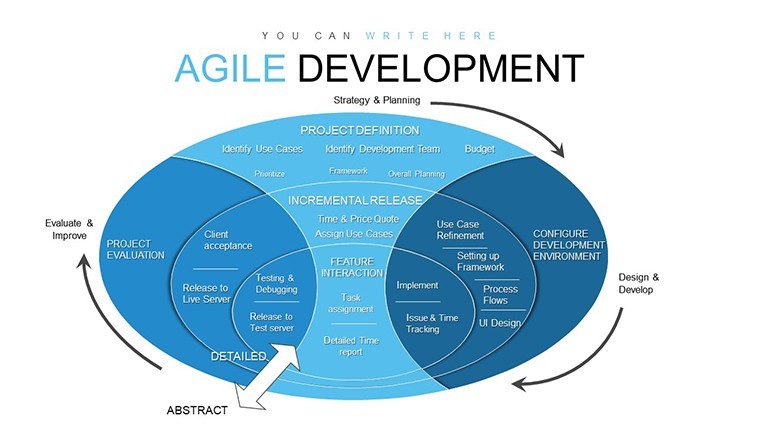
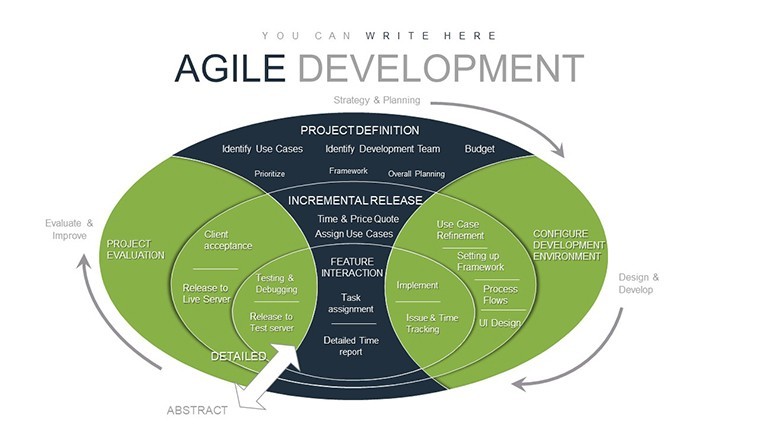
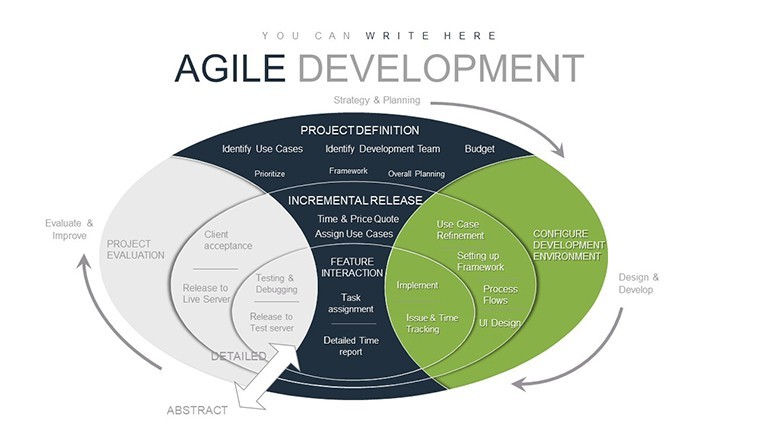
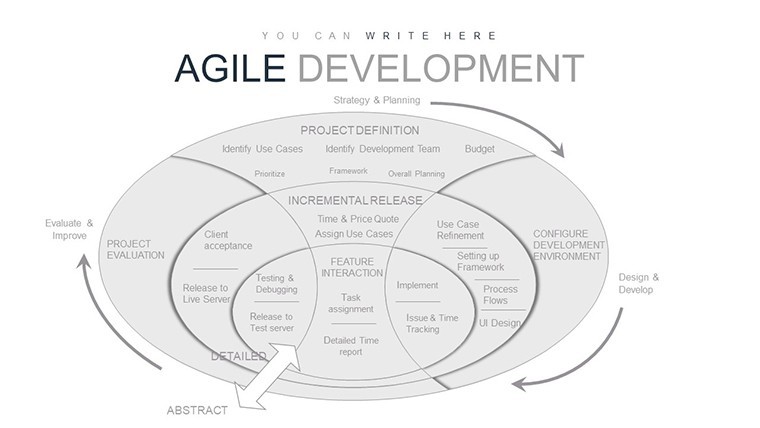
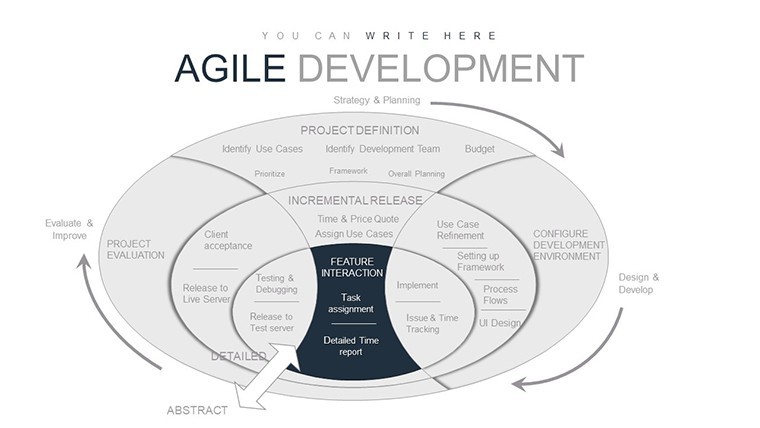
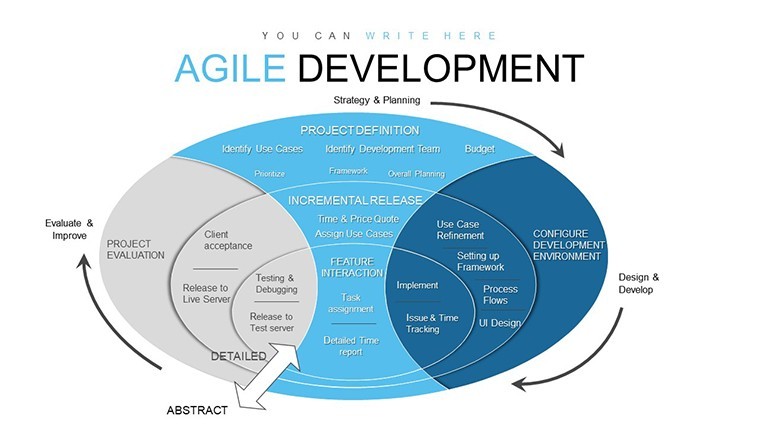
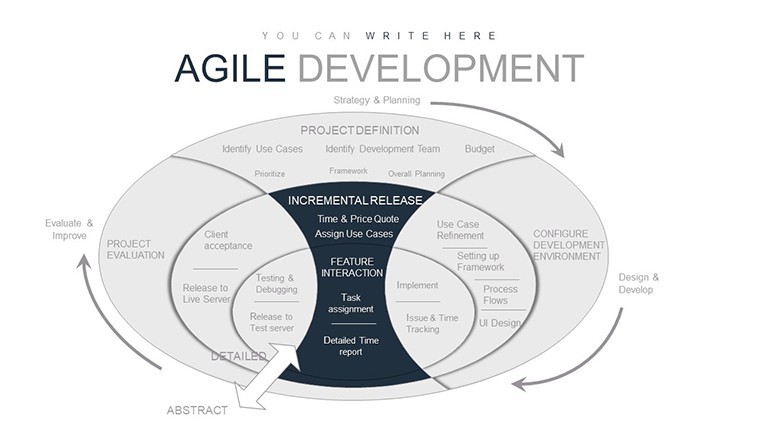
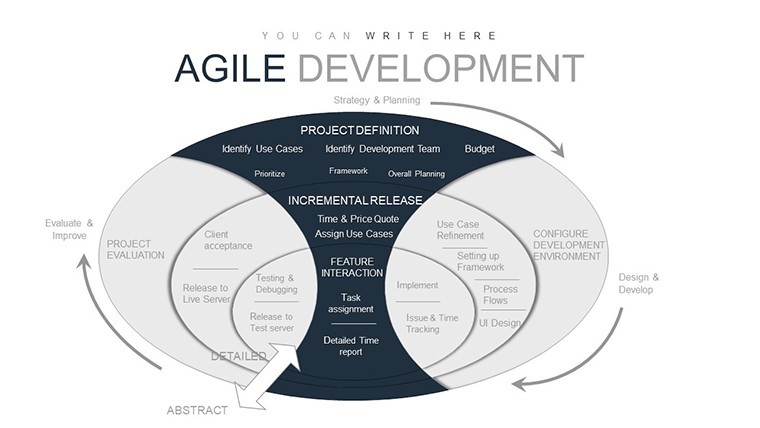
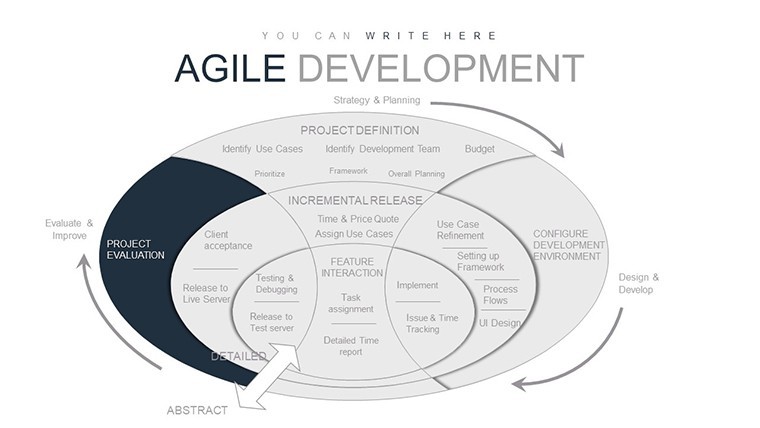
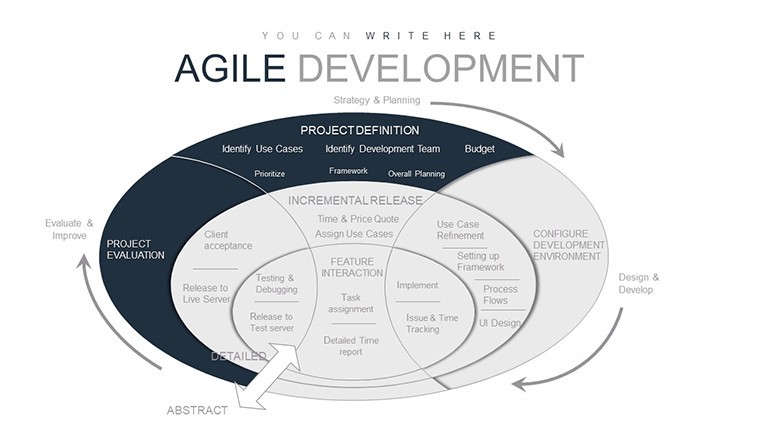
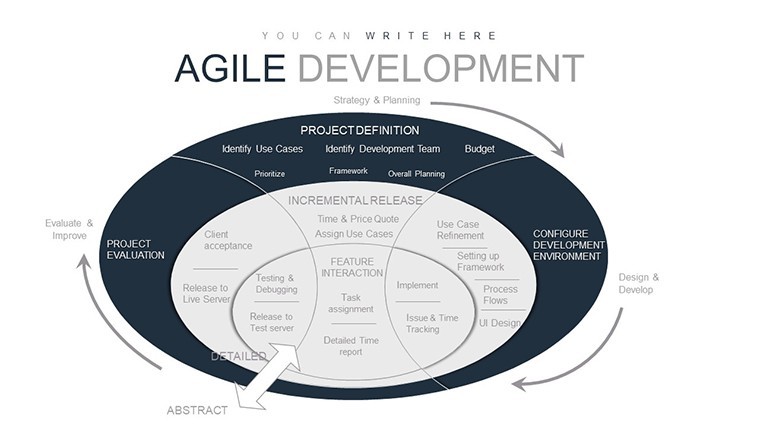
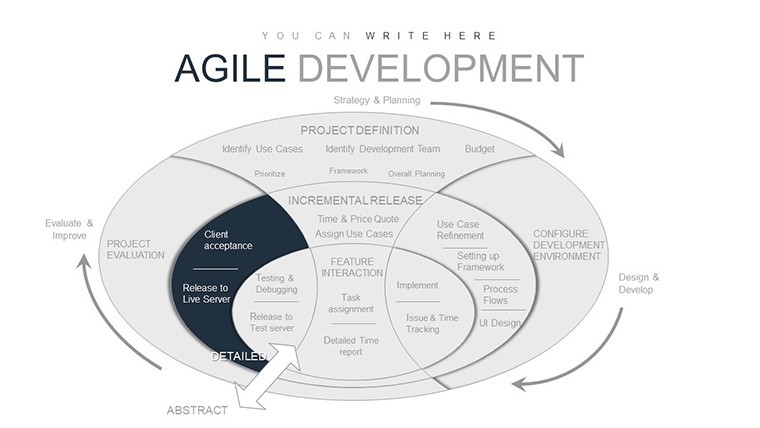
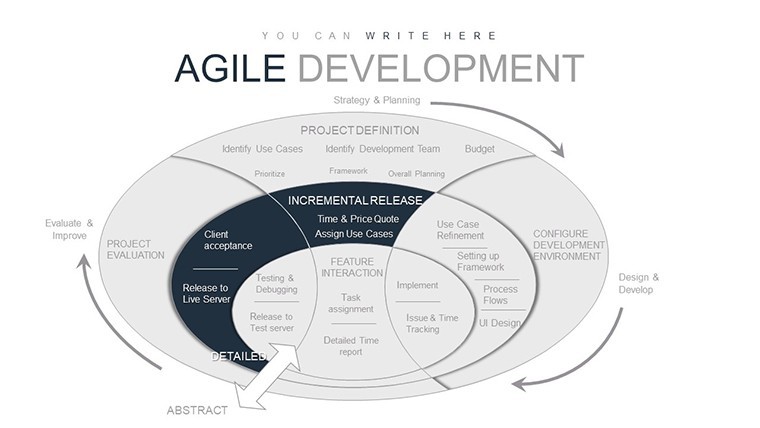
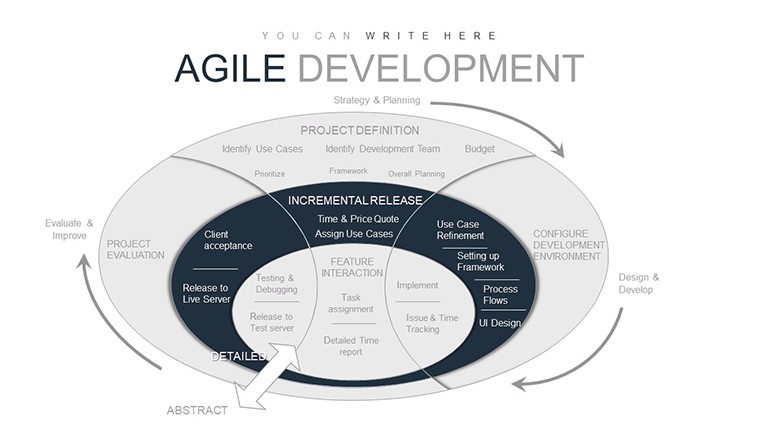
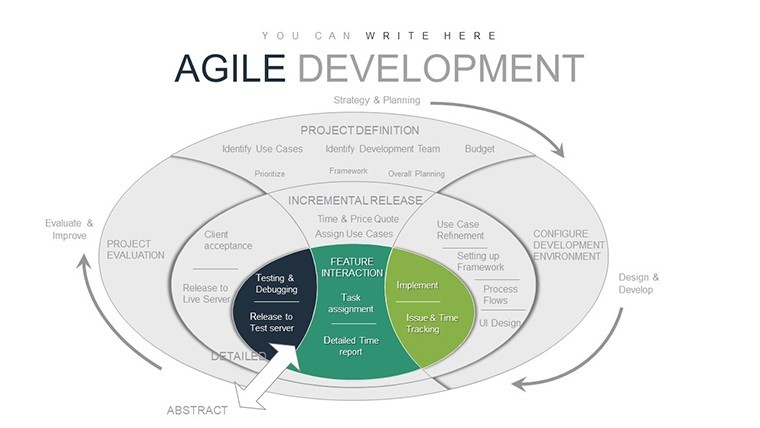
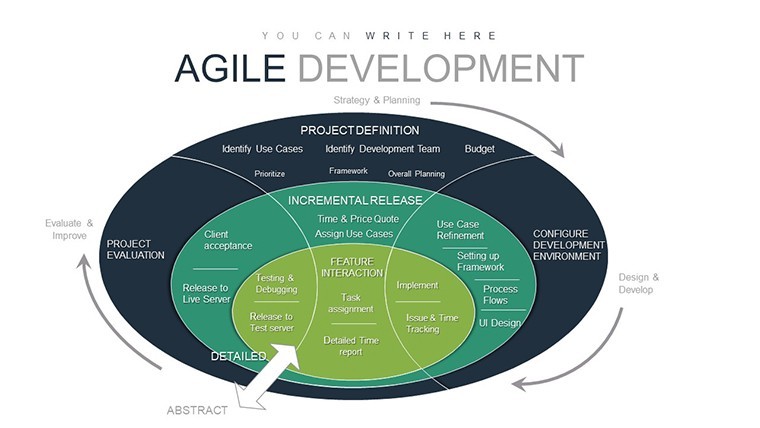
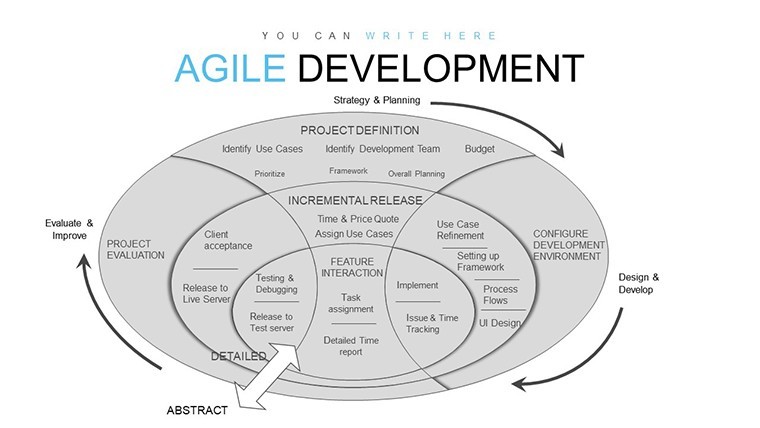
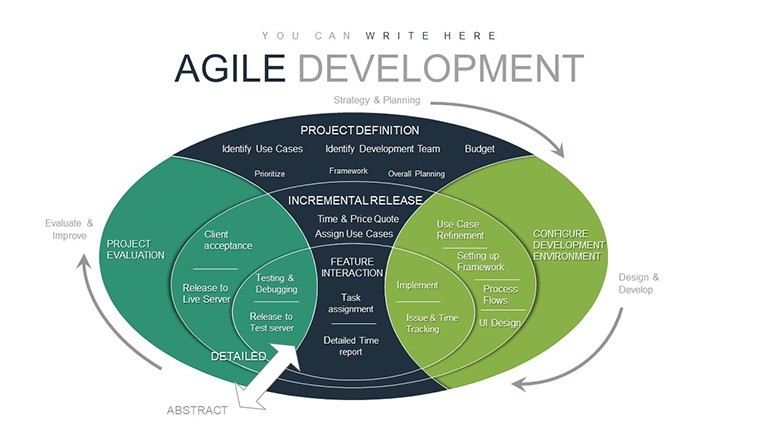
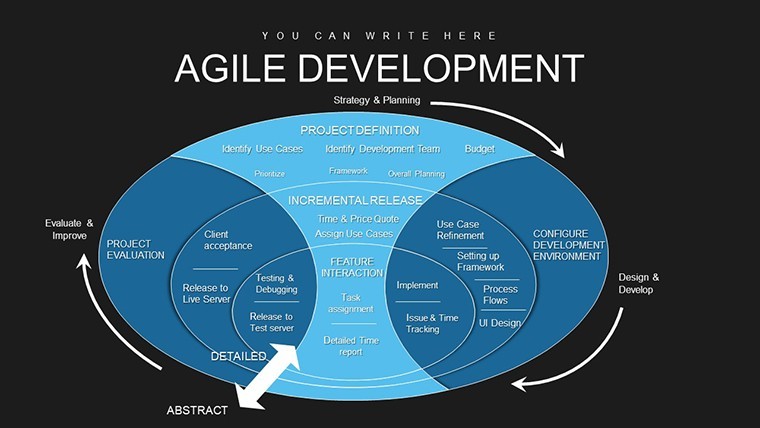
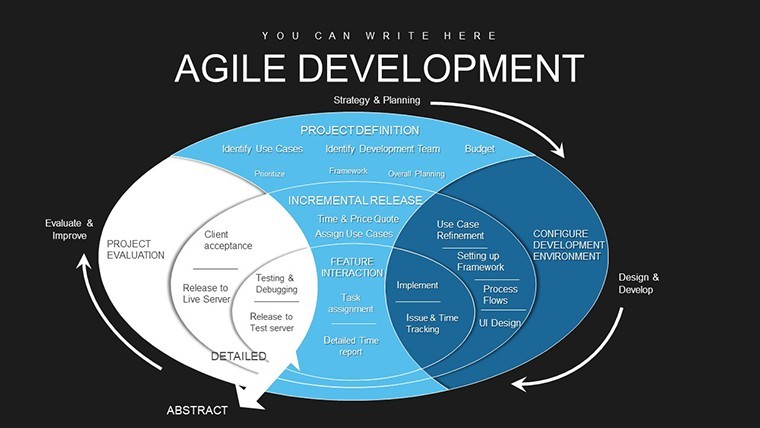
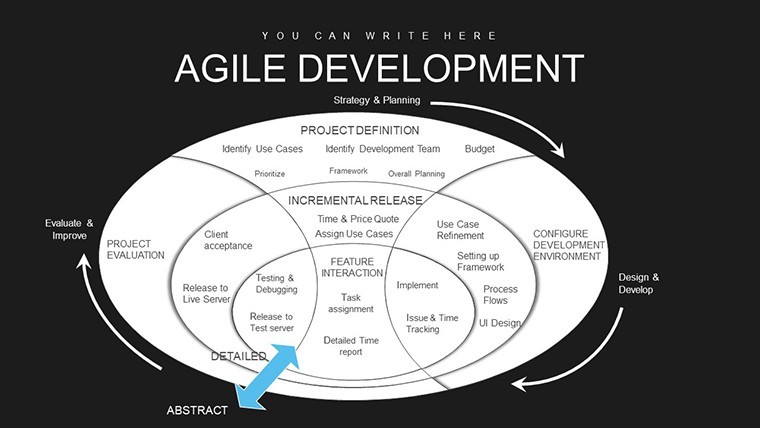
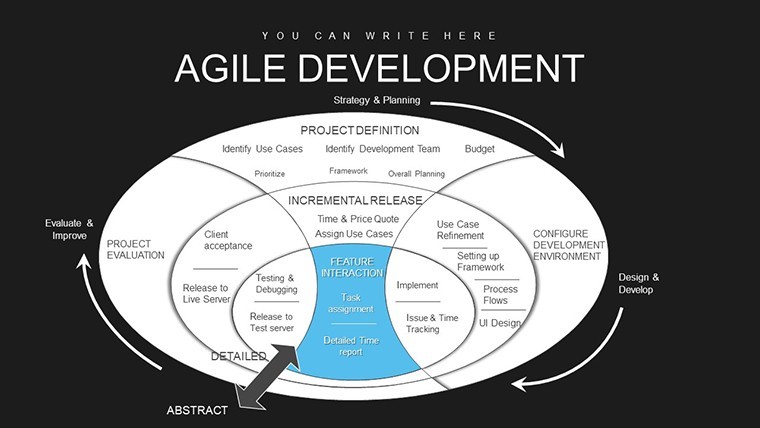
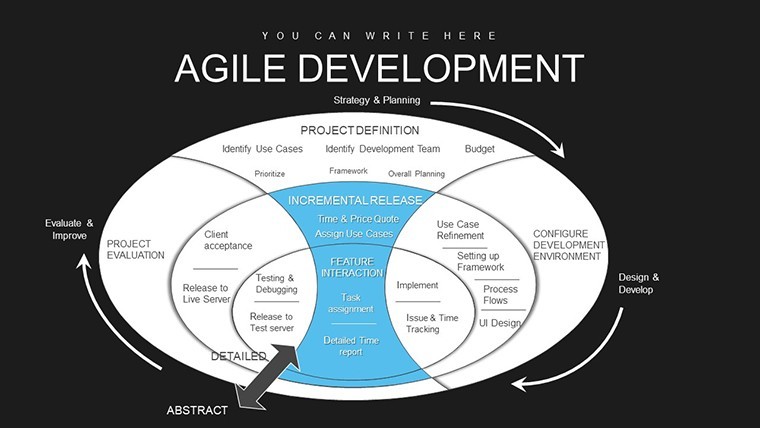
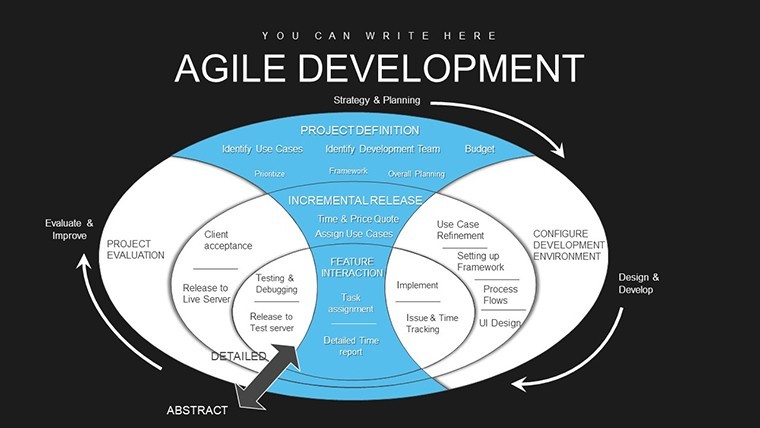
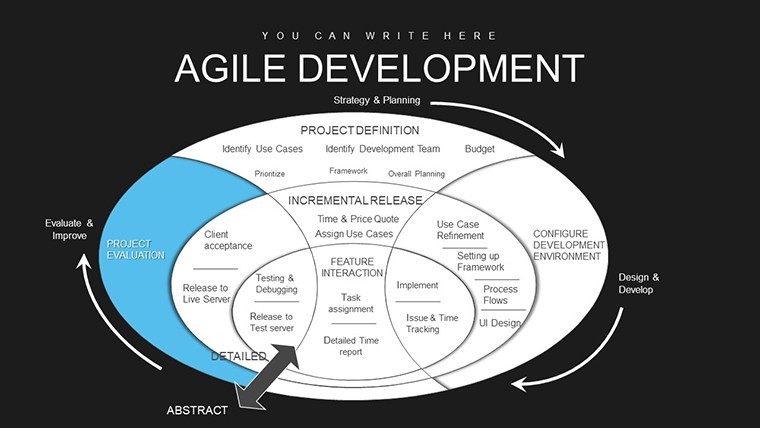
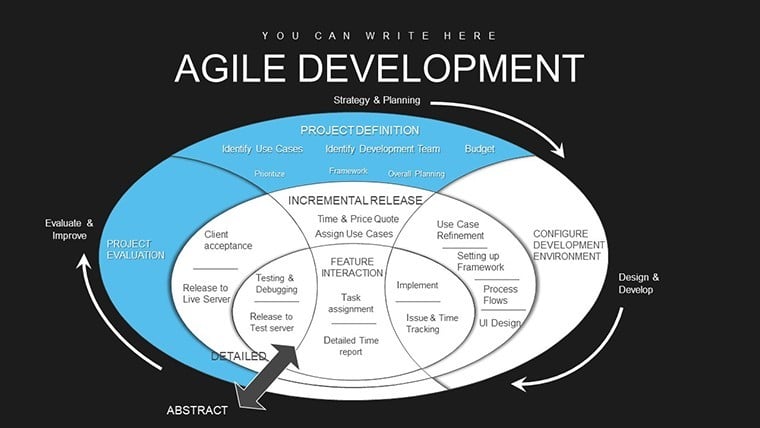
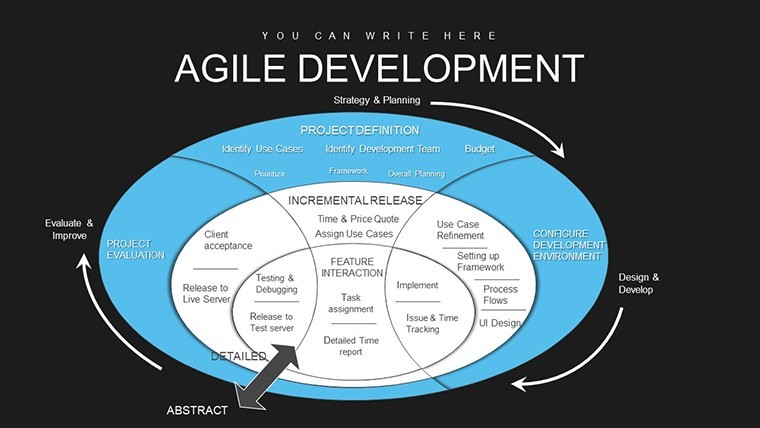
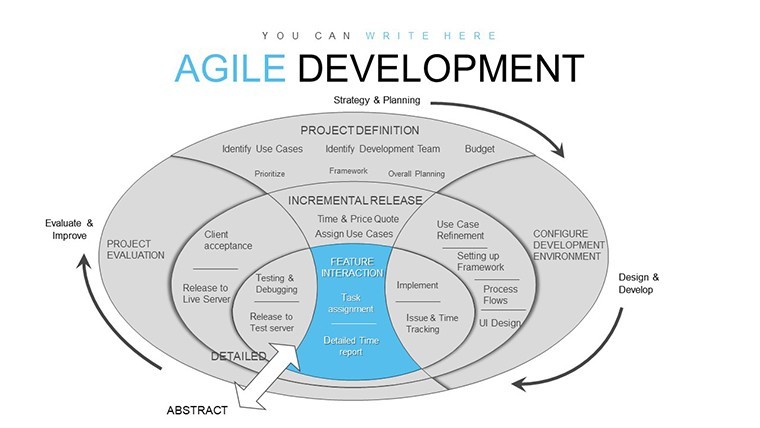
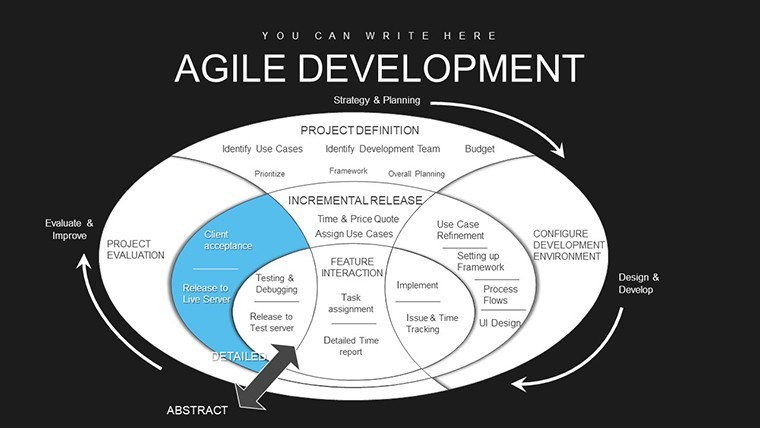
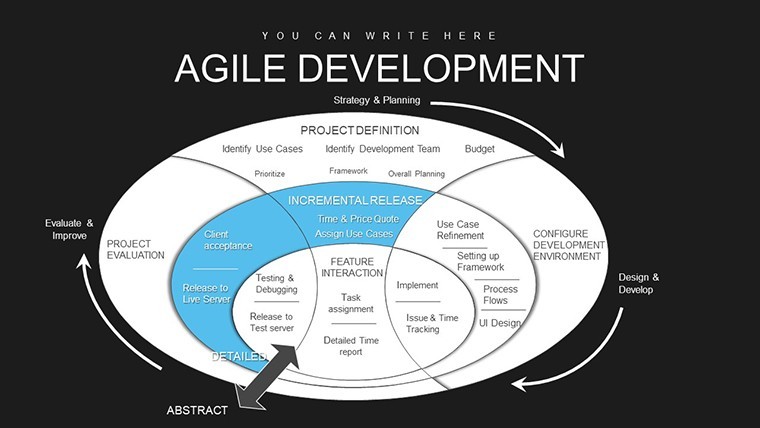
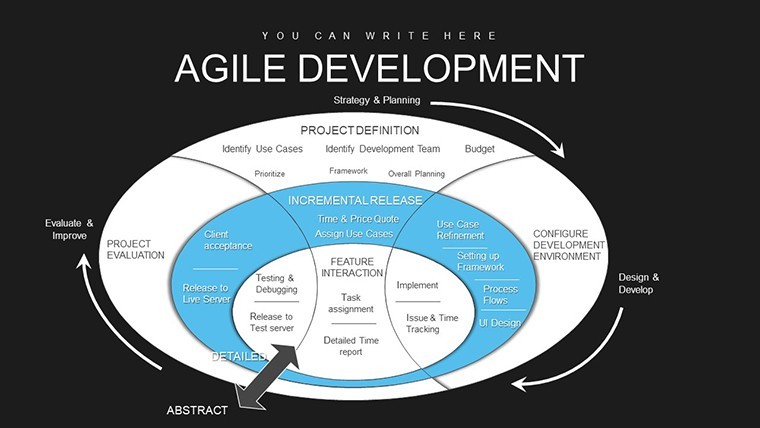
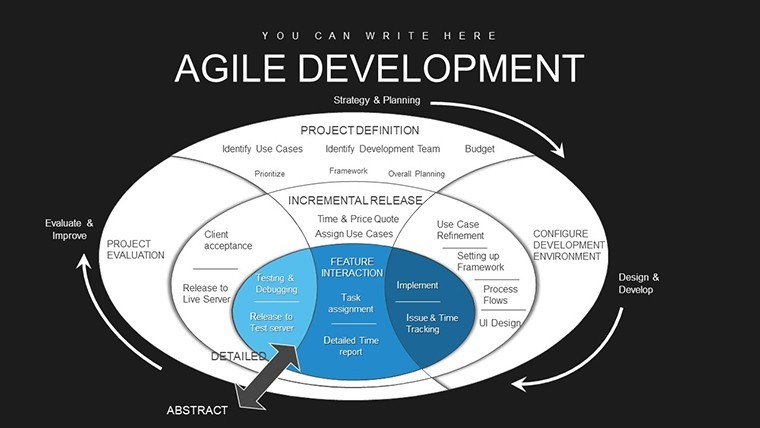
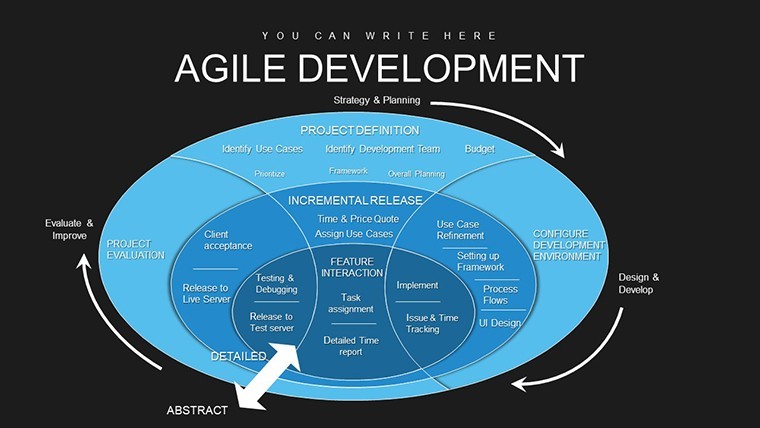
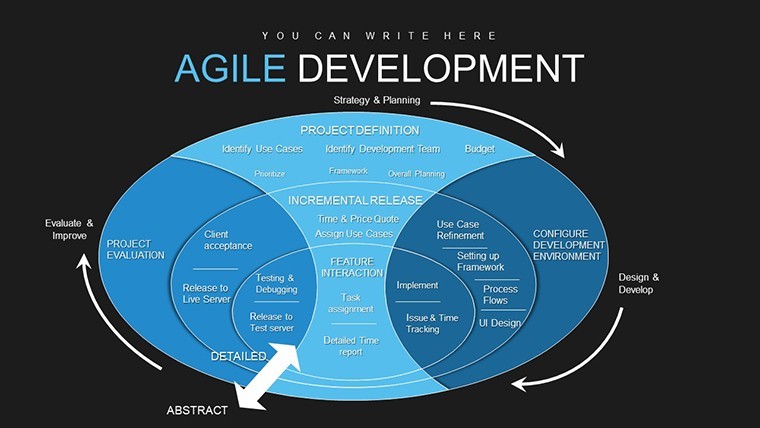
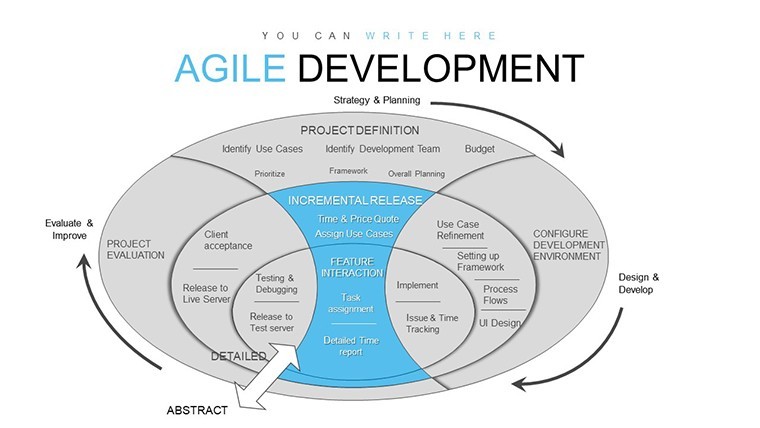
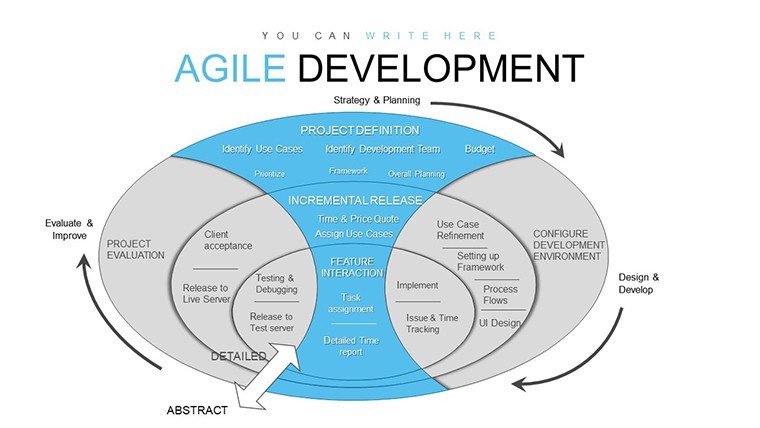
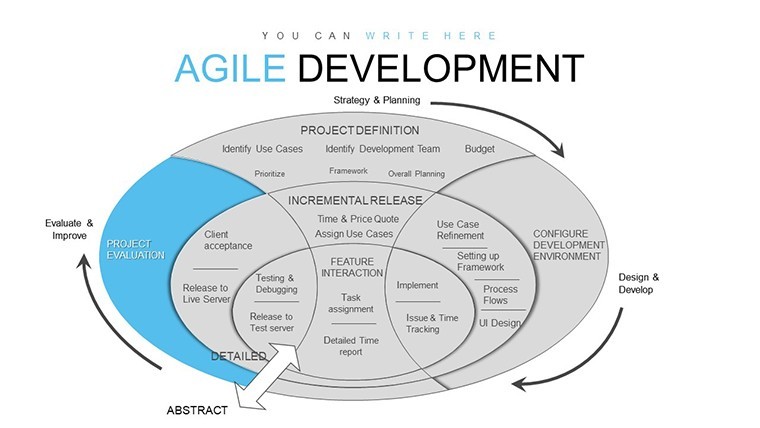
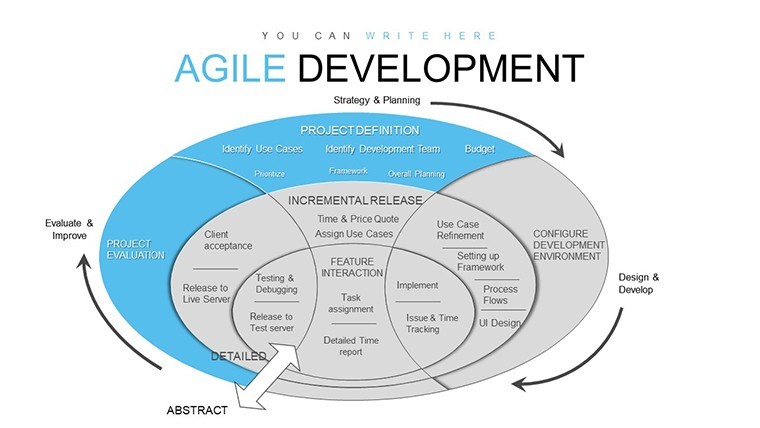
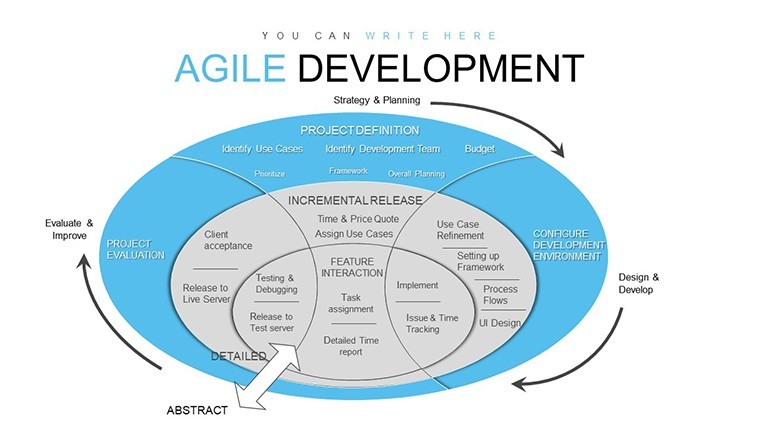
Agile, as outlined in the Agile Manifesto, prioritizes individuals, working solutions, customer collaboration, and responding to change. This template captures that essence across 45 slides, from foundational principles to advanced implementations. Slides include scrum frameworks, kanban boards, and sprint timelines, all designed to illustrate interactive development where customer requirements evolve iteratively.
Core Features Driving Agile Adoption
Fully editable in Keynote, the slides offer flexibility with colors, texts, and layouts. Widescreen optimized, they feature flowcharts for process mapping, pie charts for resource allocation, and Gantt-like timelines for sprints. These align with Scrum Alliance guidelines, ensuring professional-grade visuals.
- Principle Diagrams: Visual breakdowns of agile's 12 principles.
- Team Structure Charts: Illustrations of self-organizing, cross-functional teams.
- Iteration Cycles: Loops showing feedback and adaptation.
- Backlog Prioritization: Tools for ranking user stories.
This setup builds trust by providing structured yet flexible designs, ideal for certified scrum masters.
Agile in Action: Use Cases and Scenarios
Consider a tech startup iterating on a app: Use sprint slides to map releases, incorporating customer feedback loops. For larger enterprises, charts compare waterfall vs. agile, highlighting efficiencies like 40% faster time-to-market per Atlassian reports. Coaches might use it for training, simulating retrospectives with interactive elements. In non-tech, marketing teams apply agile for campaigns, using kanban to track creative flows. This template's breadth ensures it fits diverse contexts, outperforming generic tools by focusing on agile-specific visuals.
Guiding Your Agile Journey Step by Step
- Framework Selection: Choose scrum or kanban starters based on project needs.
- Data Integration: Add metrics like velocity or burndown into charts.
- Customization: Tailor visuals for team branding or emphasis on principles.
- Animation Application: Use transitions to mimic iterative progress.
- Delivery Prep: Rehearse with notes on agile benefits.
This mirrors agile's iterative nature, refining your presentation as you go.
Establishing Expertise in Agile Practices
Expertise shines through informed visuals; this template enables that by incorporating elements from SAFe (Scaled Agile Framework) for enterprise scaling. Weave in terms like "minimum viable product" organically, enhancing discoverability. Case studies, like Spotify's squad model, can be visualized to show real impacts, such as improved innovation rates.
For innovators, adapting slides to hybrid models demonstrates versatility, building authority in evolving fields.
Engaging Teams with Dynamic Visuals
Visuals boost retention; PMI stats show 65% improvement in understanding. Here, cycle charts depict daily standups, fostering team buy-in during rollouts.
Tips for Agile Presentation Mastery
- Focus on value delivery in slides to align with agile ethos.
- Use colors for priority levels in backlogs.
- Incorporate polls for interactive agile discussions.
- Scale visuals for large organizations using hierarchy charts.
Drawn from experts like Jeff Sutherland, these ensure impactful deliveries.
Embrace agile's potential - download this template and innovate with confidence.
Frequently Asked Questions
What are agile's core values?
Individuals over processes, working software over documentation, collaboration over contracts, responding to change over plans.
How editable are these slides?
Completely, from layouts to data, in Keynote for seamless tweaks.
Is it suitable for non-software projects?
Yes, agile principles apply to marketing, HR, and more.
Does it include scrum elements?
Absolutely, with sprints, backlogs, and retrospectives covered.
Can I add custom animations?
Yes, Keynote supports enhancements for dynamic storytelling.
How does it support self-organizing teams?
Through charts illustrating roles and collaborations.
Good for
- Project roadmaps and sprint plans
- Product launch timelines
- Quarterly or annual review decks
- Company history and milestone summaries
Licence
reviews
Agile Methodology's 45 slides with scrum frameworks and sprint timelines transformed my training session. Kanban visuals and iteration cycles are detailed and editable.
Project manager - the backlog prioritization charts and team structure diagrams clarified roles perfectly. Widescreen works well, though volume of slides is overwhelming at first.
The principle diagrams aligned nicely with Agile Manifesto. Used for hybrid team rollout. Practical animations for feedback loops.
Liked the burndown style charts and self-organizing team illustrations. Helped non-tech marketing folks grasp concepts. Solid but needs branding tweaks.
As a coach, the comparison to waterfall flows highlighted efficiencies well. Many editable options. Good value.
Sprint cycle loops and retrospectives visuals made my deck dynamic. Minor critique on some dense text slides.
FAQ
Will it work in Google Slides?
Are fonts embedded?
Can I use this for client work?
What's the refund policy?
Do you update the template after purchase?
Similar templates
See all Keynote Charts →
All 45 slides