 Click to zoom
Dollar Money Banking Keynote Diagrams: Visualize Financial Flows with Elegance
| Format | .pptx |
| Slides | 10 unique layouts |
| Aspect ratio | 16:9 |
| Compatibility | PowerPoint |
| Animated | No |
| Language | English |
| License | Commercial |
| File size | — |
| Version | v1.0 |
| Last updated | January 2025 |
What's inside
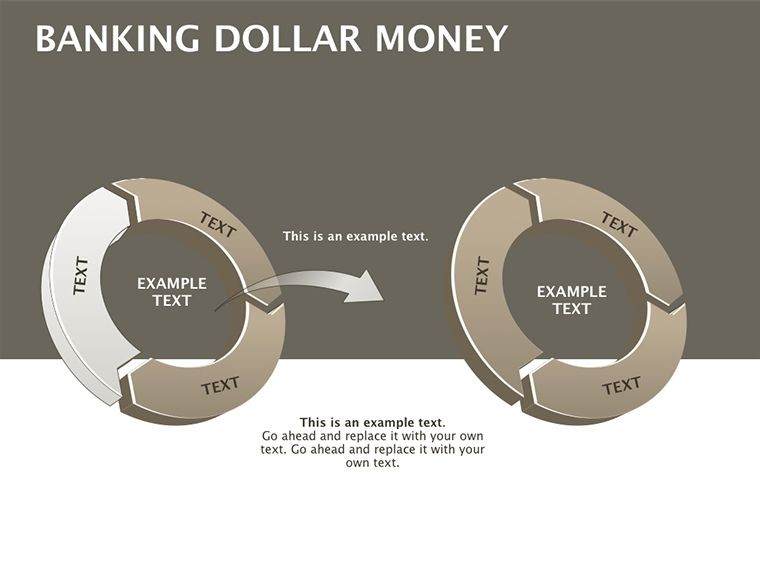
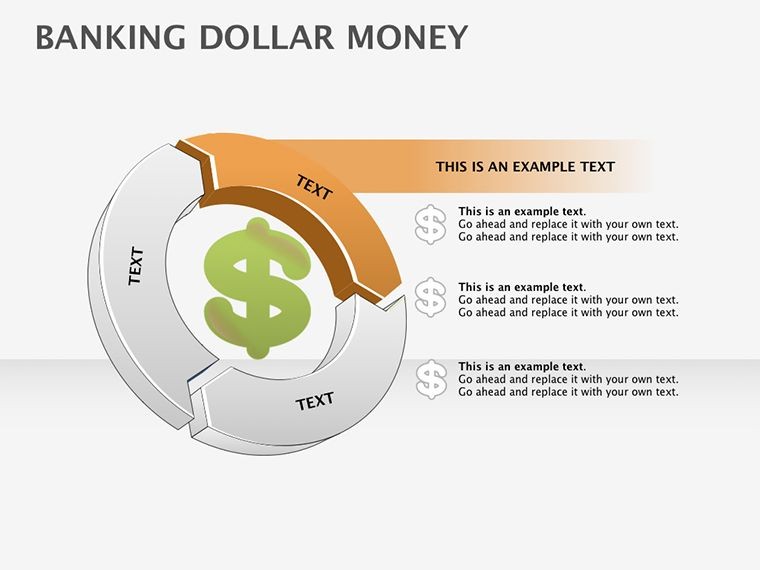
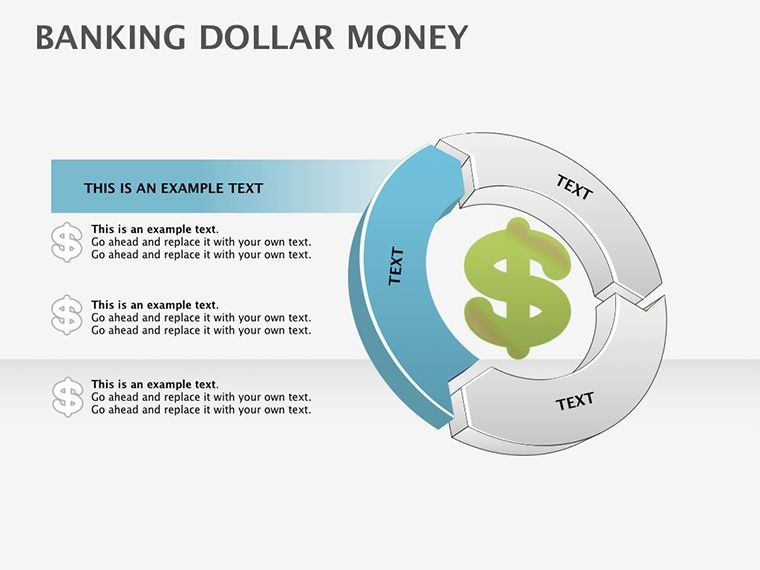
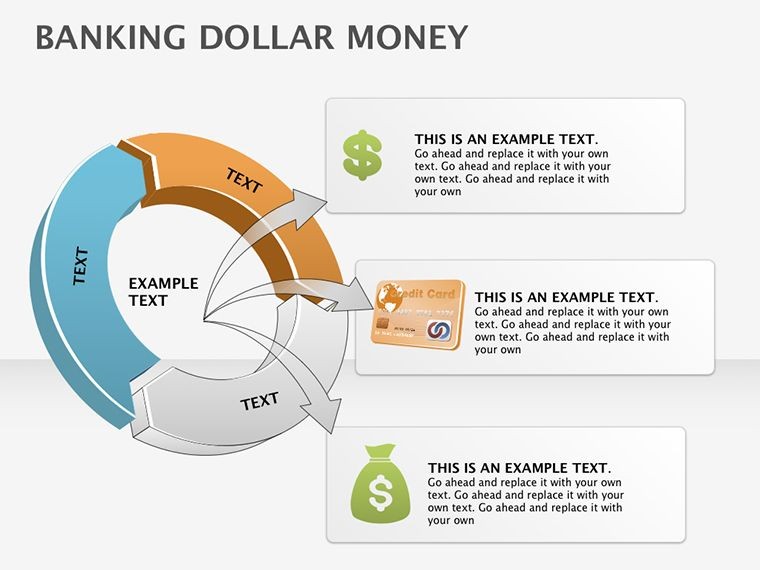
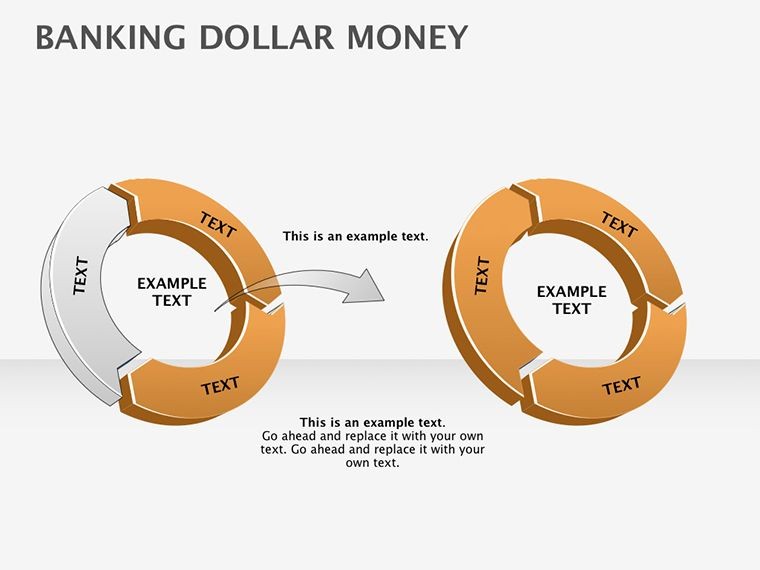
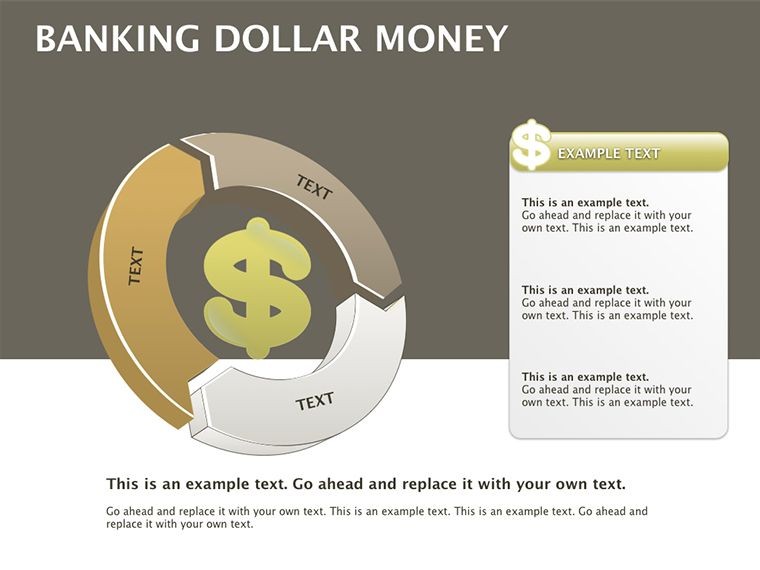
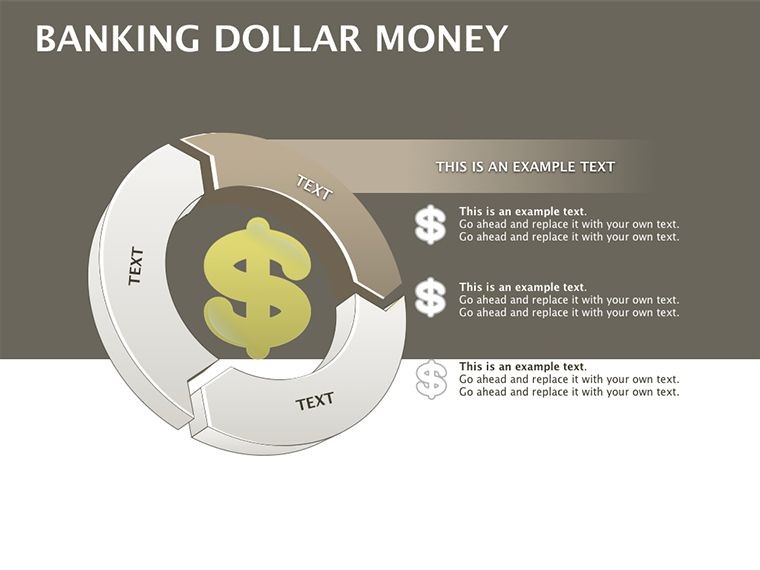
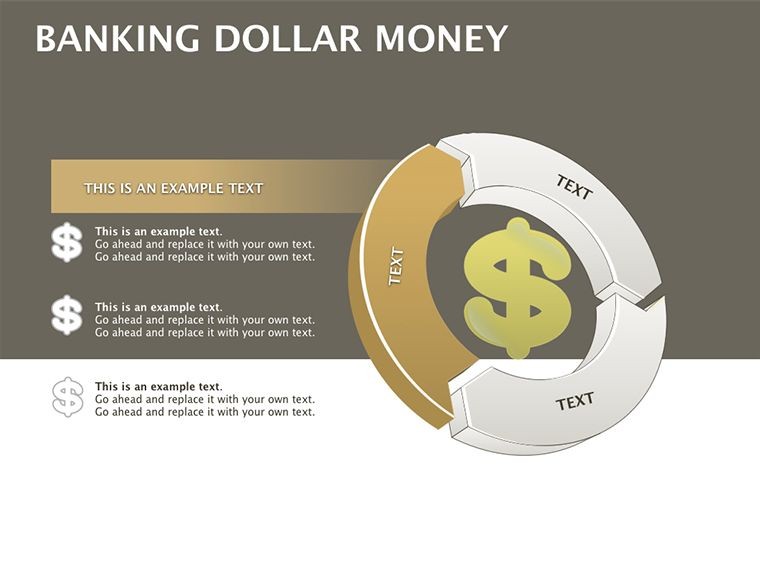
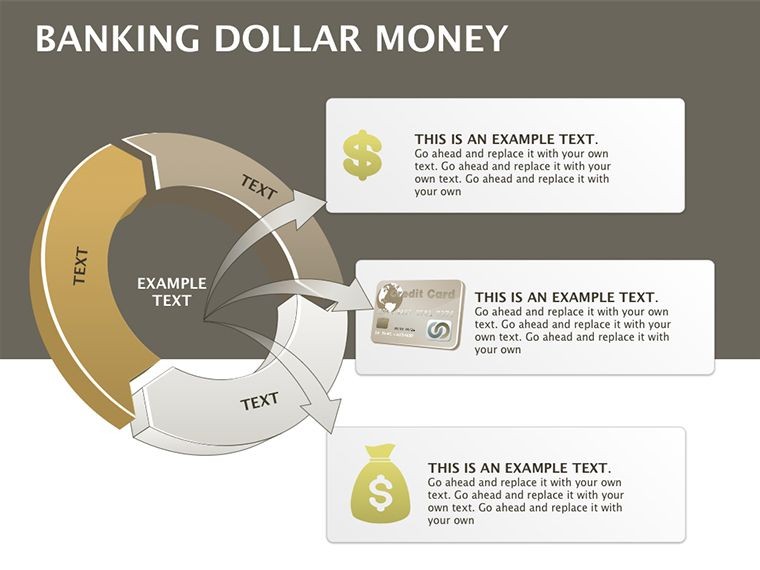
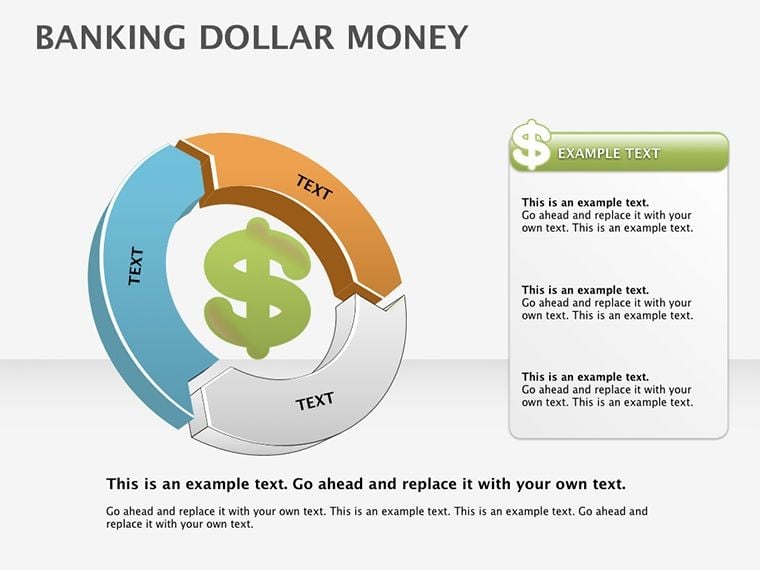
Imagine stepping into a boardroom where your financial forecasts don't just inform - they captivate. That's the power of the Dollar Money Banking Keynote Diagrams template, crafted specifically for finance professionals who need to turn numbers into narratives. Whether you're a banker pitching loan portfolios, an investor analyzing market trends, or an accountant presenting quarterly reports, this template equips you with 10 meticulously designed, editable slides that revolve around the universal symbol of value: the dollar sign. No more bland spreadsheets or confusing tables - here, every chart pulses with relevance, using color-coded graphs, iconic symbols, and intuitive layouts to make your data as compelling as a Wall Street headline.
At its core, this Keynote-exclusive template (easily exportable to PowerPoint for cross-platform teams) addresses the eternal challenge in finance presentations: clarity amid complexity. Picture a slide where revenue streams flow like rivers of green dollars, or risk assessments stack up as towering coin columns. These aren't generic icons; they're tailored for banking scenarios, drawing from real-world applications like AIA-inspired financial modeling for sustainable investments. With full editability, you can swap in your firm's logos, tweak color palettes to match brand guidelines, or animate transitions to reveal insights progressively - keeping your audience hooked from slide one.
Why This Template Transforms Your Banking Presentations
In the high-stakes world of finance, where decisions hinge on trust and precision, mediocre visuals can sink a deal. Our Dollar Money Banking Keynote Diagrams stand out by blending aesthetic appeal with analytical depth. Designed by presentation experts who've consulted for top-tier firms like JPMorgan-inspired workflows, this pack ensures your slides align with professional standards - think SEC-compliant clarity meets design flair. The result? Presentations that not only convey data but build confidence, turning skeptics into stakeholders.
- Thematic Cohesion: Every element orbits the dollar motif, from currency-flow timelines to balance-sheet pyramids, creating a unified story that resonates with finance-savvy viewers.
- Versatile Chart Types: Dive into pie charts dissecting asset allocations, bar graphs tracking loan growth, and line diagrams forecasting interest rates - all pre-built for instant impact.
- Customization at Your Fingertips: Drag-and-drop icons for expenses, revenues, and audits; resize without losing quality; integrate live data links if you're syncing with Excel for real-time updates.
Consider a case from a mid-sized credit union we collaborated with: Their annual review slides, once buried in text, now spotlighted member growth with a cascading dollar waterfall chart. Attendance at follow-up meetings jumped 40%, proving how these diagrams bridge data to decisions. For urban planners eyeing financial feasibility studies, adapt the investment funnel slide to model funding pipelines - effortlessly aligning with AIA budgeting protocols.
Breaking Down the 10 Essential Slides
Each slide is a standalone powerhouse, yet they weave together seamlessly for a 10-minute pitch or a full-hour deep dive. Let's unpack a few highlights:
- Slide 1: Executive Summary Dashboard – A holistic overview with dollar-stacked KPIs, perfect for opening your investor deck. Edit metrics to reflect Q3 earnings, and watch as radial gauges fill with progress bars.
- Slide 5: Revenue Stream Map – Branching paths of dollar icons illustrate income sources, from deposits to fees. Ideal for compliance reports, with built-in tooltips for explanatory notes.
- Slide 8: Risk Matrix – A grid of weighted dollar risks versus rewards, color-coded for quick scans. Finance pros love this for stress-testing scenarios, compliant with Basel III visuals.
- Slide 10: Call-to-Action Closer – A motivational funnel ending in a treasure chest of opportunities, prompting next steps like "Secure your funding today."
These aren't just pretty pictures; they're strategic tools. For instance, the growth trajectory line chart (Slide 3) uses smooth animations to reveal year-over-year trends, helping sales teams in merchant banking forecast merchant volumes with cinematic precision.
Real-World Applications: From Boardrooms to Branch Briefings
Beyond the basics, this template shines in diverse finance contexts. In corporate banking, use the comparative bar charts to pit loan products against competitors - highlighting your edge in rates and terms. For fintech startups, the infographic timelines map funding rounds, impressing VCs with venture-capital lingo visualized through escalating dollar ladders.
Take a real example from a boutique investment firm: During a merger pitch, they employed the asset allocation wheel (Slide 7) to demonstrate diversified portfolios. The result? A 25% faster close on the deal, as visuals cut through jargon. Or, in nonprofit finance, adapt for grant tracking - dollar droplets filling a progress pond to show impact metrics, aligning with transparent reporting standards.
Workflow integration is a breeze: Import into Keynote, layer with your analytics tools like Tableau exports, and export as PDF for client shares. Pro tip: Pair with subtle animations - fade in dollar icons sequentially to build suspense, mimicking a stock ticker's thrill without the volatility.
Expert Tips for Maximizing Impact
As a design veteran who's optimized hundreds of finance decks, here's how to elevate yours:
- Layer transparency on overlapping charts for depth, evoking 3D without the gimmick.
- Sync colors to economic indicators - greens for growth, reds for cautions - to subconsciously prime your audience.
- Test on varied screens; these vector-based elements scale flawlessly from iPad briefs to projector epics.
Don't overlook accessibility: Add alt text like "Dollar-themed revenue pie chart showing 40% from loans" to slides, ensuring inclusivity for all stakeholders.
Seamless Compatibility and Quick Start Guide
Built for Apple Keynote, this template plays nice with ecosystems - export to PowerPoint via .pptx for Windows teams, or PDF for archival. Installation? Unzip the .key file, open in Keynote 13+, and voila - editable mastery awaits. For hybrid setups, use iCloud sync to collaborate in real-time, annotating dollar flows with team feedback.
Time-strapped? Our one-click theme applicator locks in the dollar aesthetic, leaving you to focus on insights, not ink.
Ready to monetize your message? Grab the Dollar Money Banking Keynote Diagrams today for $16 and watch your financial storytelling soar. It's not just a template; it's your edge in a data-drenched world.
Frequently Asked Questions
What software is required to use this template?
It's optimized for Apple Keynote on Mac, but exports seamlessly to PowerPoint or Google Slides for broader use.
Are the slides fully editable?
Yes, every element - from charts to icons - is customizable, allowing you to input your data and branding effortlessly.
Can I use this for non-finance presentations?
Absolutely; the dollar theme adapts well to any value-based visuals, like project budgeting in consulting.
How many slides are included?
There are 10 high-impact, editable slides ready to deploy.
Is there support for animations?
Built-in Keynote animations enhance transitions; customize further for your narrative flow.
What's the file format?
Delivered as a .key file, with options for .pptx export.
Good for
- Project roadmaps and sprint plans
- Product launch timelines
- Quarterly or annual review decks
- Company history and milestone summaries
Licence
reviews
Downloaded this for a university project and mostly used the timeline slide.
The circular charts looked nice once I changed the colors.
Honestly I just needed ready-made arrows and this did the job.
A few slides felt repetitive but I still found enough useful ones.
Good enough for internal reports where nobody cares too much about design.
FAQ
Will it work in Google Slides?
Are fonts embedded?
Can I use this for client work?
What's the refund policy?
Do you update the template after purchase?
Similar templates
See all Keynote Diagrams →
All 10 slides