 Click to zoom
Different Keynote Charts: Decode Marketing Dynamics with Diverse Visuals
| Format | .pptx |
| Slides | 17 unique layouts |
| Aspect ratio | 16:9 |
| Compatibility | PowerPoint |
| Animated | No |
| Language | English |
| License | Commercial |
| File size | — |
| Version | v1.0 |
| Last updated | October 2021 |
What's inside
Marketing isn't a monolith - it's a mosaic of factors, from consumer behaviors to competitive landscapes, demanding visuals as varied as the strategies they support. Our Different Keynote Charts template captures that essence with 17 editable slides, each a unique lens for scientific analysis of goods and services promotion. Tailored for marketers navigating everything from product launches to market audits, this set draws on proven frameworks like the 4Ps model, helping you dissect influences with precision and panache. Imagine unveiling a 3D funnel chart that rotates to expose drop-off points in a campaign, or a cycle diagram looping through buyer journeys - all in Keynote's fluid environment.
With support for widescreen (16:9), standard (4:3), and 16:10 ratios, adaptability is baked in, ensuring your decks shine across devices. This isn't cookie-cutter charting; it's a versatile arsenal for empirical breakdowns, informed by real-world tactics from agencies like Ogilvy. Cut through data noise, spotlight actionable insights, and drive decisions that convert - because in marketing, the right visual can shift perceptions overnight.
Key Advantages: Variety Meets Analytical Power
Embrace diversity in design without sacrificing cohesion. These charts excel in Keynote's ecosystem, with .key files that load instantly and edit intuitively. From 2D simplicity to 3D depth, the range caters to every analytical need, making complex factor analyses feel approachable.
- Format Flexibility: Triple-ratio support for global presentations, no resizing woes.
- Chart Spectrum: Cycles, matrices, and pyramids for holistic views on marketing elements.
- Scientific Scalability: Vector precision holds up under zoom, ideal for detailed annotations.
A marketing director at a consumer goods firm used a similar setup to map influencer impacts, streamlining a $200K campaign pivot. It's about turning observations into opportunities, grounded in practical research scopes.
Slide Deep Dive: A Toolkit for Every Angle
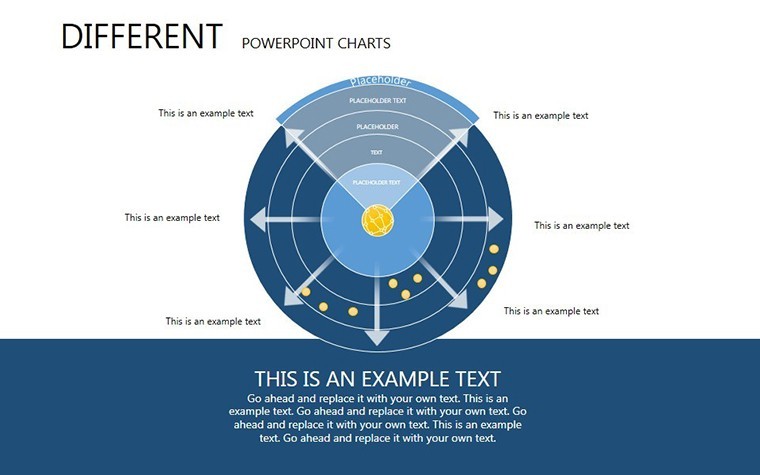
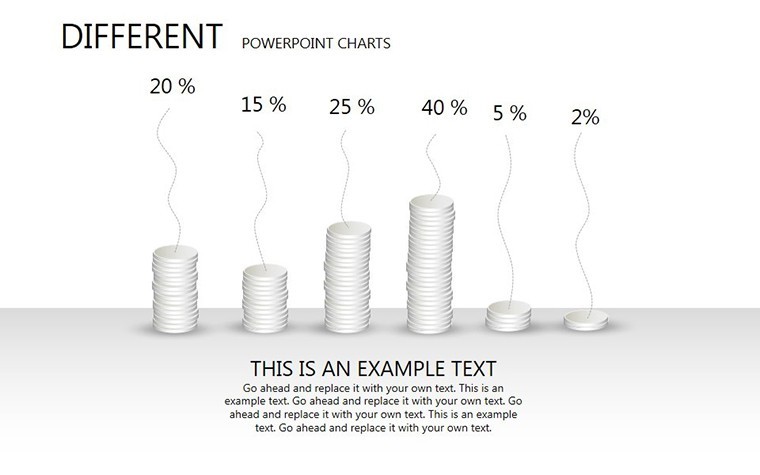
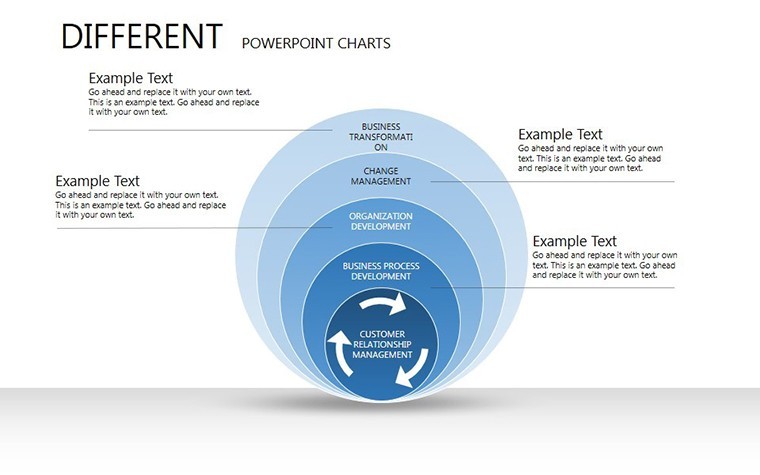
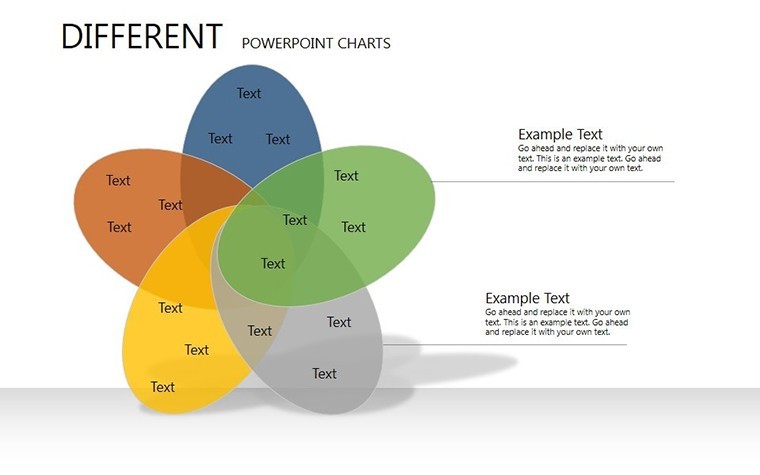
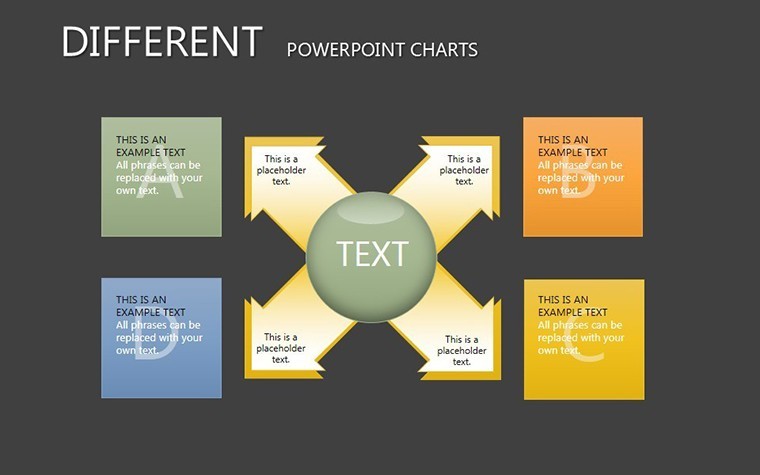
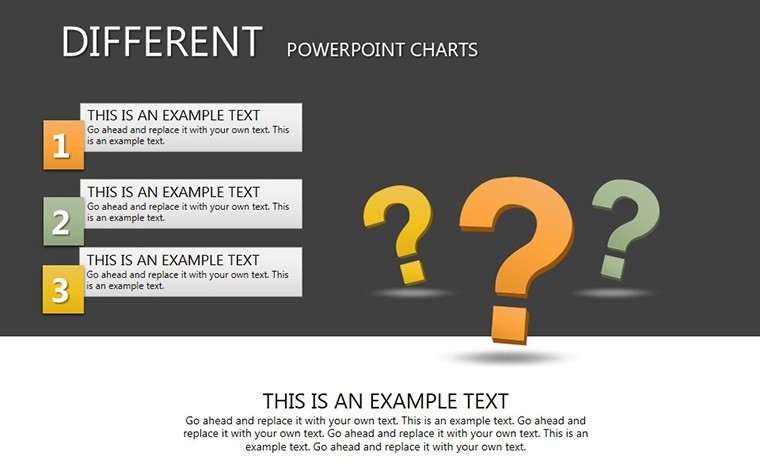
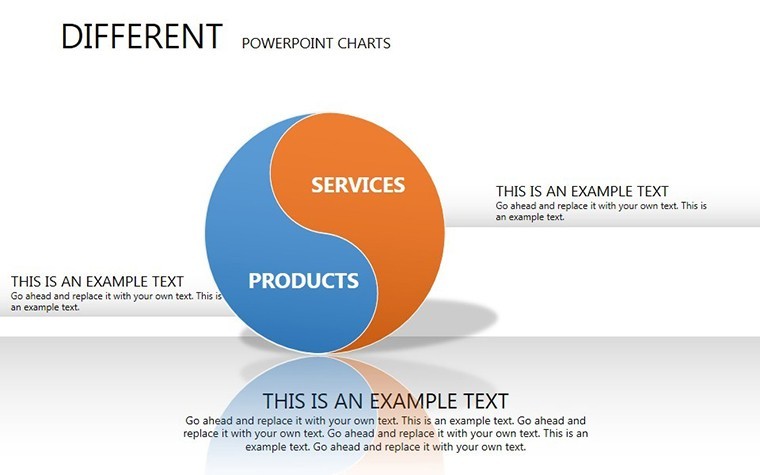
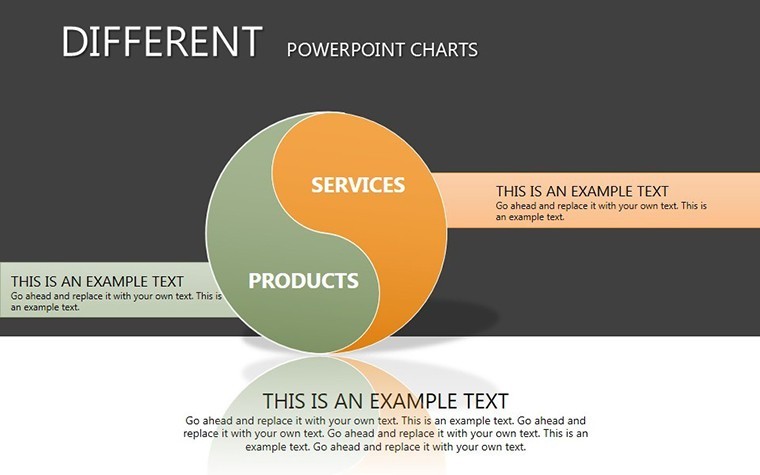
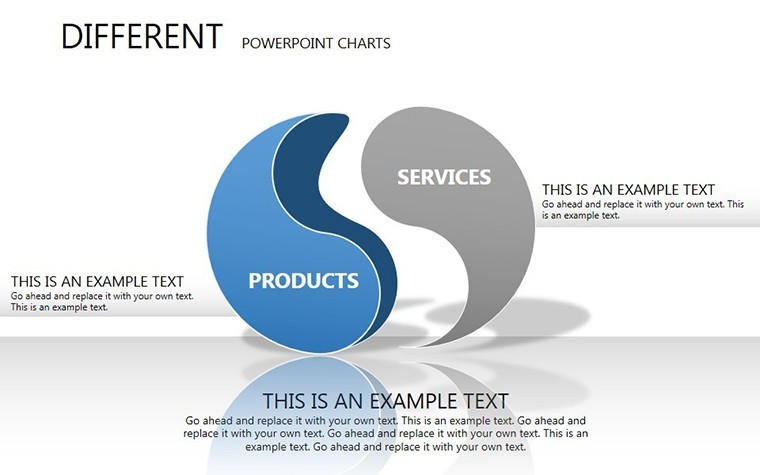
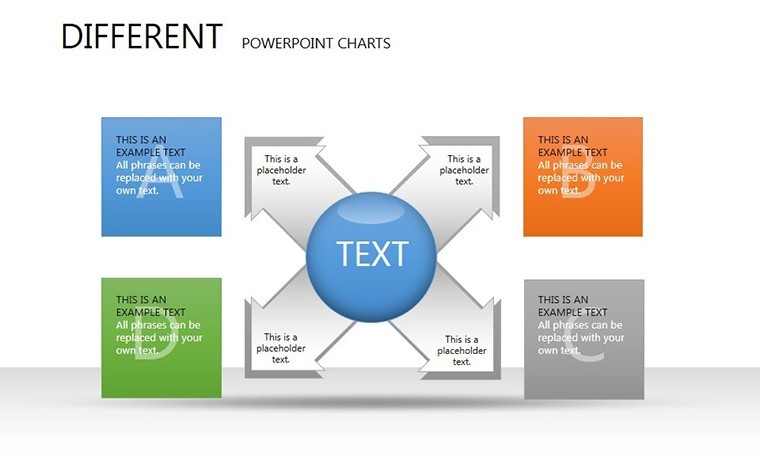
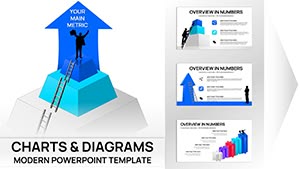
Slide 1 launches with a multi-panel overview, segmenting market factors into digestible quadrants. Advance to Slide 7's layered cycle, tracing service delivery loops with adjustable arcs. The variety peaks in Slides 12-15: 3D bars for volume comparisons, heat grids for sentiment mapping.
- Strategic Starters (Slides 1-4): SWOT radars pulsing with weighted scores.
- Trend Trackers (Slides 5-9): Diverging arrows for growth/decline narratives.
- Factor Focus (Slides 10-13): Bubble clusters sizing opportunities by impact.
- Synthesis Wraps (Slides 14-17): Dashboard mosaics consolidating key takeaways.
Tweak pro-style: Apply gradient fills to denote urgency in timelines, or embed formulas for auto-updating KPIs. This granularity empowers on-the-fly adjustments during client calls.
Targeted Scenarios: Marketing Mastery Unleashed
For product marketers, deploy the assortment matrix to evaluate SKU performance against sales data. Service pros? Leverage process flows to audit customer touchpoints, akin to McKinsey's service blueprints. In broader scopes, visualize external factors like economic shifts via interconnected webs, aiding scenario planning that anticipates disruptions.
One e-commerce brand credited diverse charts for optimizing ad spends, yielding a 18% uplift in conversions. Outpacing basic Excel dumps, this Keynote collection delivers narrative depth, transforming reports into roadmaps.
Optimization Hacks for Marketers
Harmonize with brand kits: Swap icons for logo-aligned assets. Use build orders to reveal insights progressively, building suspense. For reports, export layered PDFs preserving editability. The outcome? Analyses that don't just inform but influence, turning data into dollars.
Amplify Your Analytical Edge Now
In the competitive arena of marketing, standing out starts with seeing clearly. Acquire the Different Keynote Charts today and chart your path to unparalleled insights. Your next breakthrough awaits.
Frequently Asked Questions
What chart types are included?
A mix of cycles, 3D models, matrices, and more for comprehensive marketing views.
Does it support multiple aspect ratios?
Yes - 16:9, 4:3, and 16:10 for versatile display options.
How easy is data updating?
Seamless: Link to spreadsheets for real-time refreshes in Keynote.
Ideal for B2B or B2C?
Both - adaptable for goods/services across sectors.
Any 3D customization?
Fully rotatable and rescalable for immersive explorations.
Good for
- Project roadmaps and sprint plans
- Product launch timelines
- Quarterly or annual review decks
- Company history and milestone summaries
Licence
reviews
Needed charts for a quarterly report and this one already had the layout ready.
I liked the timeline slide with the icons because it made my presentation less empty.
Some text boxes were weirdly placed but I fixed it after a few minutes.
Downloaded this late at night for a university project and honestly it helped.
The graph pages are okay, not super fancy but usable.
FAQ
Will it work in Google Slides?
Are fonts embedded?
Can I use this for client work?
What's the refund policy?
Do you update the template after purchase?
Similar templates
See all Keynote Charts →
All 17 slides