 Click to zoom
Decode PESTLE Factors with Economic PowerPoint Charts
| Format | .pptx |
| Slides | 21 unique layouts |
| Aspect ratio | 16:9 |
| Compatibility | PowerPoint |
| Animated | No |
| Language | English |
| License | Commercial |
| File size | — |
| Version | v1.0 |
| Last updated | February 2024 |
What's inside
In an era where external forces shape business landscapes, mastering PESTLE (Political, Economic, Social, Technological, Legal, Environmental) analysis is crucial for strategic foresight. Our PESTLE Economic PowerPoint Charts Template provides 21 editable slides blending process, relationship, and business model visuals to dissect these elements. Tailored for strategists, analysts, and leaders, it enables vivid representations of how economic shifts interplay with other factors. From radar charts for multi-factor overviews to flow diagrams tracing impacts, customize effortlessly in PowerPoint or Google Slides. This tool overcomes vague analyses by offering professional designs that clarify complexities, supporting data-driven decisions. Whether assessing market entry or risk mitigation, it builds on frameworks like those from Porter's models, enhancing your presentations with authority and visual appeal to guide organizational resilience.
Visualizing PESTLE Interconnections
Relationship charts here map PESTLE interdependencies, with slides using webs or matrices to link factors - e.g., economic policies to technological advancements. Edit nodes with specifics, color for emphasis (greens for opportunities, reds for threats). This illuminates synergies, as in a global firm's use to navigate trade tariffs, per World Economic Forum insights. Benefits: Deeper understanding, fostering proactive strategies. Icons enhance intuitiveness, aligning with SWOT integrations for comprehensive views.
Process Flows for Factor Analysis
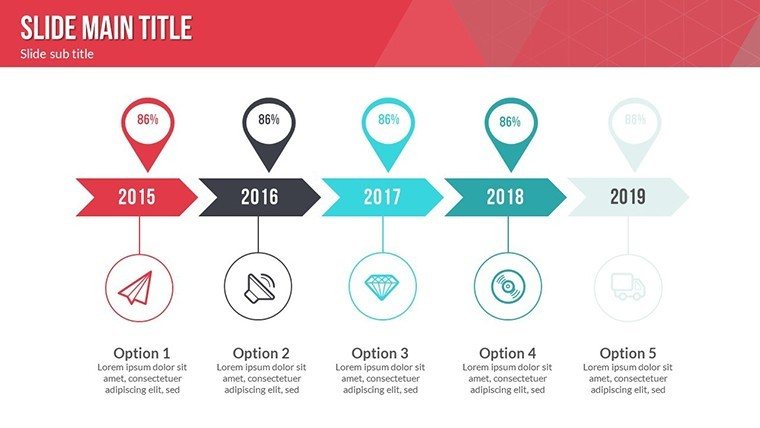
Process slides detail sequential impacts, like economic downturn cascades. Customizable arrows and stages allow metric inserts, gradients for progression. Solves siloed thinking; a consultancy applied these to streamline compliance, cutting review times, as per PwC studies. User perks: Dynamic animations reveal steps, boosting engagement and retention.
Business Model Canvases with PESTLE Lens
Slides adapt canvases to PESTLE, segmenting for factor overlays. Edit texts, shapes; ideal for workshops. Addresses adaptation needs; startups used to pivot amid regulations, echoing Lean Startup methodologies. Features like vectors ensure scalability, with tips for bold contrasts per design pros.
Practical Applications and Enhancements
Apply in risk assessments or planning; integrate Excel data for live updates. Tips: Use hierarchies for depth, collaborate via shared platforms. Case: Energy sector visualized environmental shifts, aiding sustainability shifts per IPCC alignments.
Strategize with Confidence Now
This template empowers PESTLE mastery through 21 slides, surpassing basics with tailored insights. Benefits: Informed strategies, visual persuasion. Incorporate LSI like macro-environment scanning. Secure your edge; customize your analysis today.
Frequently Asked Questions
How editable are PESTLE charts?Fully - alter texts, colors, and structures for precise factor representations.Supports business model integrations?Yes, canvases overlay PESTLE seamlessly.Animations for process flows?Included, for step-wise reveals.Suitable for global analyses?Ideal, with adaptable international factors.What formats are provided?.pptx, vectors, JPGs for versatility.Good for
- Project roadmaps and sprint plans
- Product launch timelines
- Quarterly or annual review decks
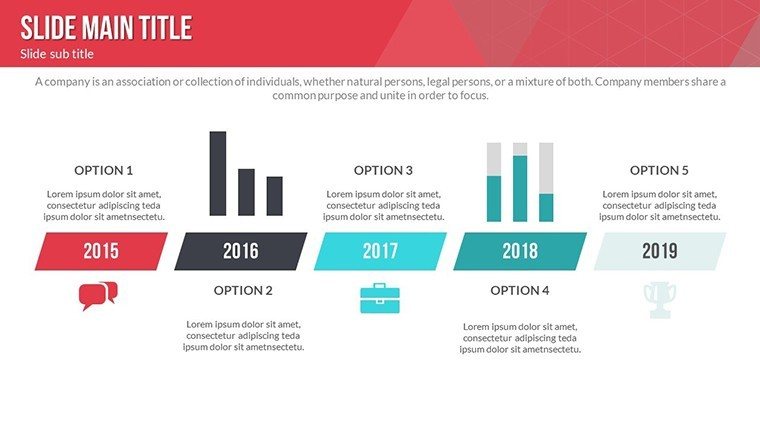
- Company history and milestone summaries
Licence
reviews
The layout was simple and not overloaded with effects.
A few chart slides looked repetitive but I still used them.
Worked fine for a small office presentation.
I appreciated that the colors were not too bright.
I downloaded this because I had to present market data in class.
FAQ
Will it work in Google Slides?
Are fonts embedded?
Can I use this for client work?
What's the refund policy?
Do you update the template after purchase?
Similar templates
See all PowerPoint Charts →


All 21 slides