 Click to zoom
Data Visualization Techniques PowerPoint Charts Template: Bring Data to Life
| Format | .pptx |
| Slides | 32 unique layouts |
| Aspect ratio | 16:9 |
| Compatibility | PowerPoint |
| Animated | No |
| Language | English |
| License | Commercial |
| File size | — |
| Version | v1.0 |
| Last updated | August 2023 |
What's inside
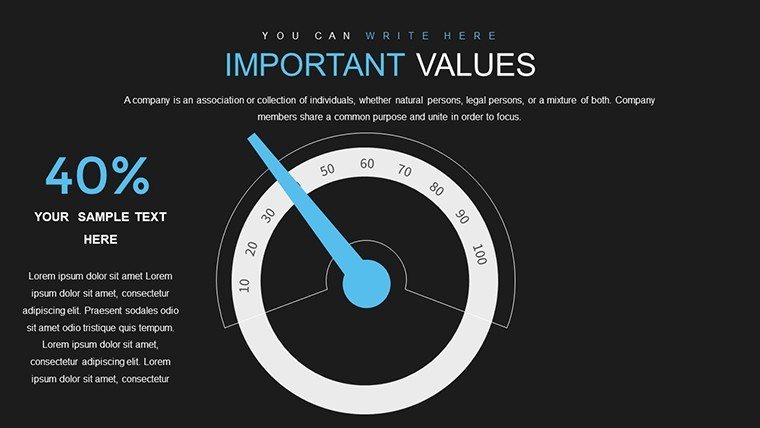
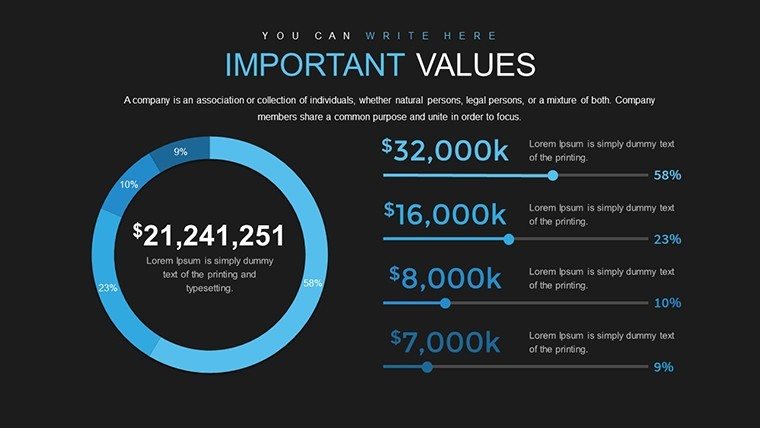
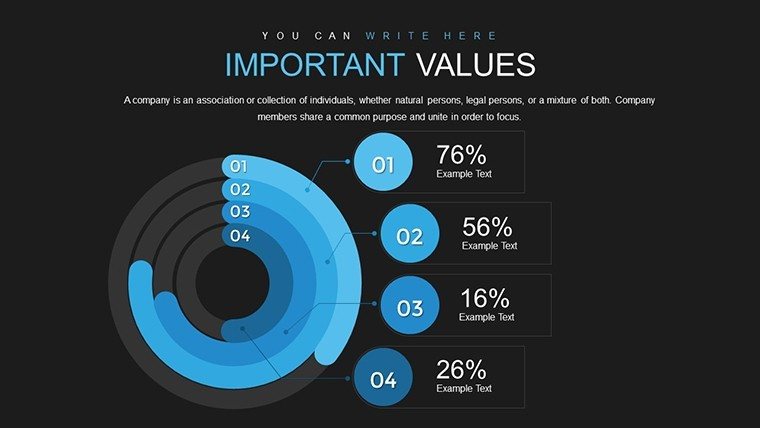
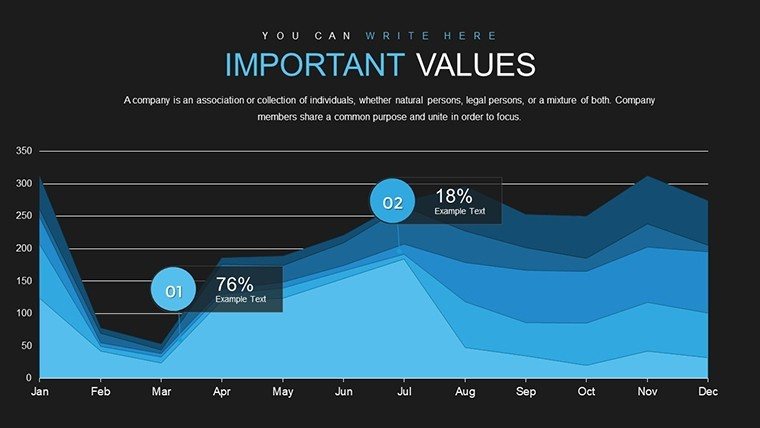
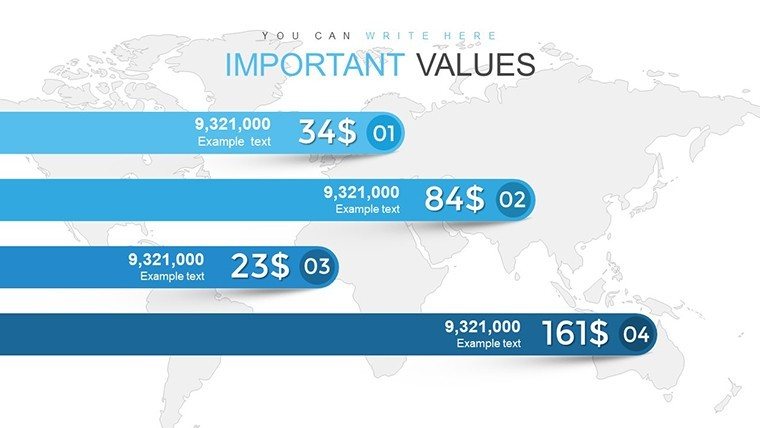
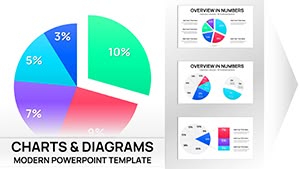
In a world overflowing with data, the ability to present it clearly can make or break your message. Enter the Data Visualization Techniques PowerPoint Charts Template, a powerhouse with 32 editable slides designed to transform raw numbers into compelling narratives. Crafted for those who demand precision and flair, this template caters to business strategists, researchers, and teachers alike. Imagine effortlessly creating bar graphs that highlight sales growth or pie charts that dissect market shares - all with animations that guide your audience through the story. This isn't just about charts; it's about making data relatable, actionable, and unforgettable. By focusing on user-friendly customization, it saves time while ensuring your presentations stand out, whether in boardrooms or lecture halls. Dive in and discover how these visuals can amplify your insights, fostering better decisions and deeper understanding among your viewers.
Exploring the Rich Array of Visualization Options
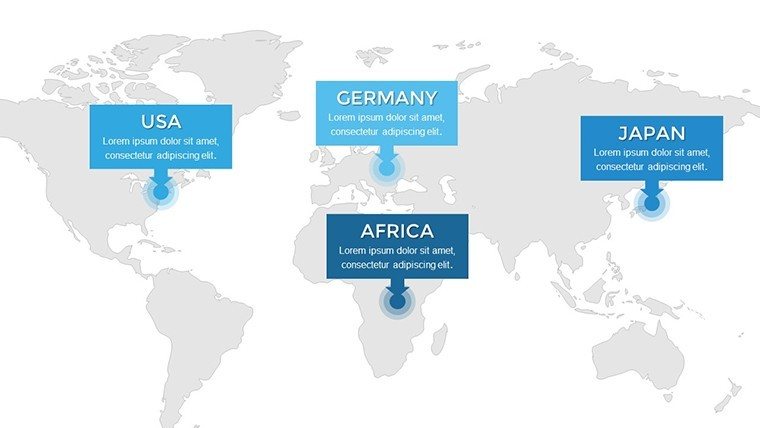
At the heart of this template is a diverse toolkit of charts, from dynamic bar and line graphs to insightful scatter plots and heat maps. Each slide is pre-formatted for quick adaptation, allowing you to input data via simple Excel links or direct edits. What sets it apart is the emphasis on storytelling: use infographics to simplify trends or layered graphs to compare metrics over time. Customization extends to every detail - alter axis labels, add legends, or integrate brand colors seamlessly. This flexibility ensures your visuals align with your message, avoiding the pitfalls of generic templates that force-fit data.
Standout Features for Seamless Data Presentation
- Varied Chart Types: Includes bars, pies, lines, areas, and more, covering all common data needs.
- Engaging Animations: Reveal data points progressively to build suspense and aid comprehension.
- Industry-Agnostic Design: Adaptable for finance, marketing, education, or research with minimal tweaks.
- Easy Integration: Edit directly in PowerPoint; compatible with Google Slides for collaborative work.
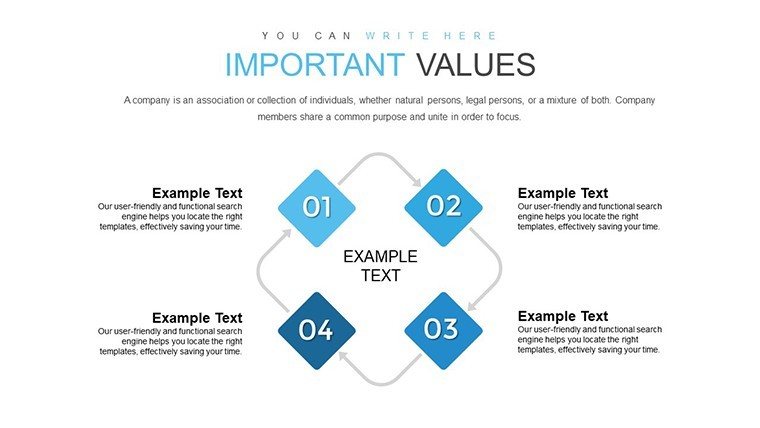
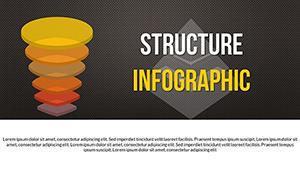
- Infographic Elements: Icons and shapes that enhance visuals, turning slides into narrative canvases.
These elements address common frustrations like mismatched designs or time-consuming builds, offering a polished alternative to basic PowerPoint tools.
Tailored Use Cases Across Professions
For business professionals, deploy these charts in quarterly reports to visualize KPIs, such as revenue streams via stacked bars. Researchers can plot experimental results in scatter charts, highlighting correlations with trend lines. Educators might use pie charts to teach fractions, animating segments for interactive lessons. Marketers benefit from funnel charts tracking customer journeys, identifying drop-offs at a glance. In each scenario, the template facilitates clearer communication, like in a healthcare study where line graphs showed patient recovery trends, leading to informed policy changes.
Workflow Integration: From Data to Delivery
- Gather your data: Compile stats in Excel or directly in the slide placeholders.
- Choose a chart: Select from the library based on your visualization goal, e.g., comparisons vs. distributions.
- Customize visuals: Adjust scales, colors, and add annotations for context.
- Incorporate storytelling: Sequence slides to build a logical flow, using transitions for smooth progression.
- Review and refine: Test on audiences or use PowerPoint's presenter view for notes.
Versus standard charts, this template's pre-optimized layouts reduce errors and enhance aesthetics, drawing from principles like those in Stephen Few's "Show Me the Numbers" for effective data display.
Pro Tips to Enhance Your Visual Narratives
Leverage color psychology - use blues for trust in financial data or reds for alerts in risk assessments. Avoid chart junk by keeping designs clean, focusing on key insights. For , cite sources like Tableau's best practices in your slides. In a real example, a tech startup used similar visualizations to secure funding, with animated graphs demonstrating user growth projections. Integrate with tools like Power BI for live data feeds, making presentations dynamic and current.
This template's trustworthiness shines through its compatibility and ease, empowering users to create authoritative content without design expertise.
Elevate Your Data Game Today
With its focus on clarity and engagement, this Data Visualization Techniques template is a must-have for anyone serious about impactful communication. It's more than slides - it's a bridge between data and decisions. Ready to make your information shine? Download and customize this versatile tool now to craft presentations that resonate and drive results.
Frequently Asked Questions
What types of charts are included?
A wide range: bars, pies, lines, scatters, and infographics, all editable for diverse data needs.
Can I link external data sources?
Yes, integrate Excel sheets or other tools for automatic updates in PowerPoint.
Is it suitable for beginners?
Absolutely - user-friendly interfaces make customization intuitive, even for non-designers.
How do animations work?
Pre-set options reveal elements step-by-step; adjust via PowerPoint's animation pane.
Does it support team collaboration?
Compatible with Google Slides, ideal for shared editing in real-time.
Can I add my own branding?
Yes, easily change colors, fonts, and logos to match your identity.
Good for
- Project roadmaps and sprint plans
- Product launch timelines
- Quarterly or annual review decks
- Company history and milestone summaries
Licence
reviews
I used this for a startup pitch and the timeline slides looked nice on screen.
Some text boxes were oddly placed but nothing serious.
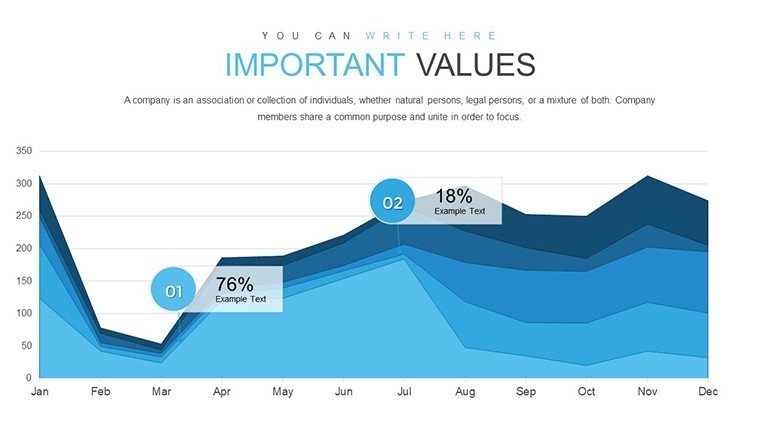
The charts actually matched the preview which surprised me.
Good enough for quick business presentations when you don’t want to think too much.
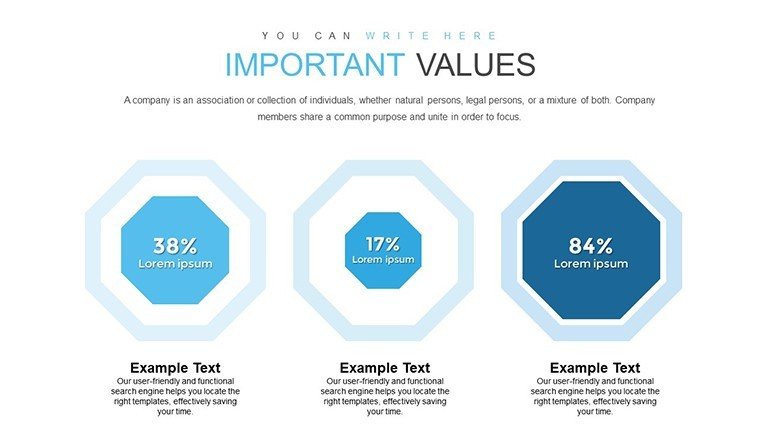
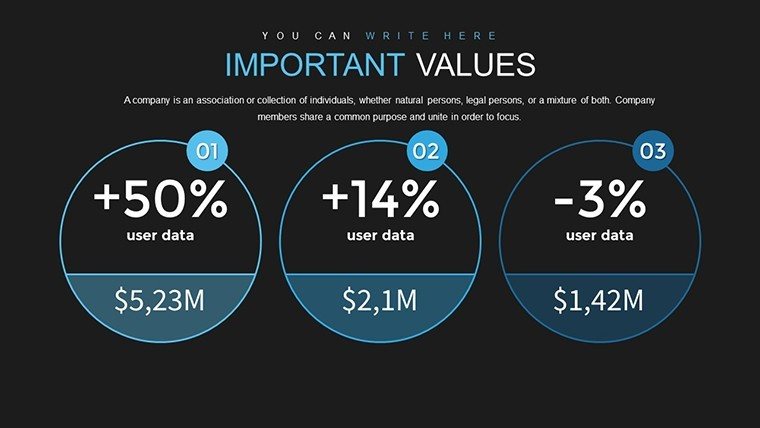
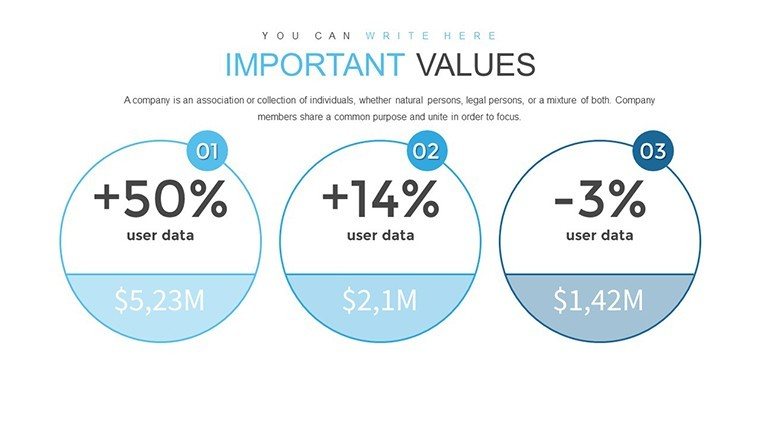
My manager liked the clean layout with the icons and percentages.
FAQ
Will it work in Google Slides?
Are fonts embedded?
Can I use this for client work?
What's the refund policy?
Do you update the template after purchase?
Similar templates
See all PowerPoint Charts →

All 32 slides