 Click to zoom
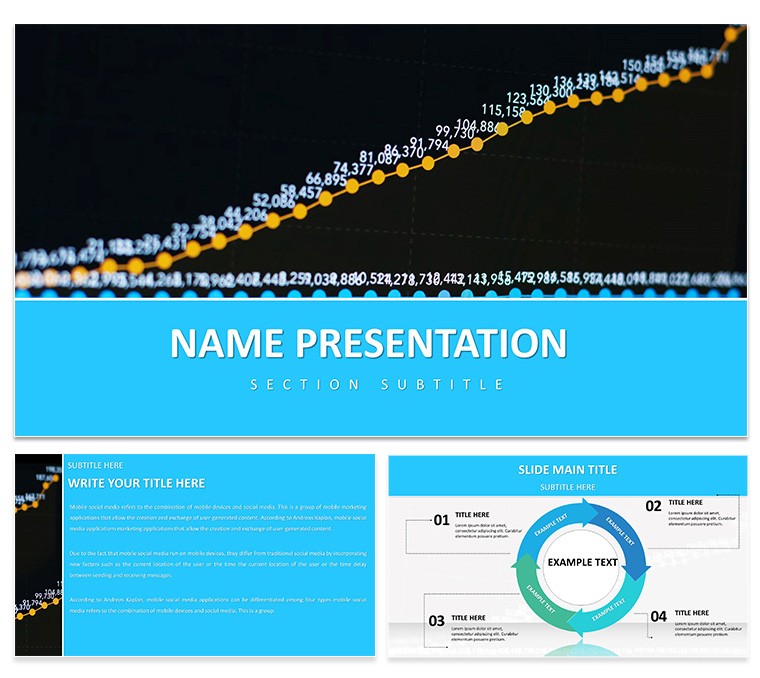
Data-Driven Growth PowerPoint Presentation Template
| Format | .pptx |
| Slides | 3 unique layouts |
| Aspect ratio | 16:9 |
| Compatibility | PowerPoint |
| Animated | No |
| Language | English |
| License | Commercial |
| File size | — |
| Version | v1.0 |
| Last updated | February 2026 |
What's inside
In an era where numbers narrate the path to progress, the Data-Driven Growth PowerPoint Template stands as your ultimate ally for distilling insights into impact. Geared toward businesses, marketers, and analysts charting courses through metrics, this collection boasts 28 insightful diagrams in seven adaptive color schemes, fortified by three master slides and three background styles. It's the bridge from spreadsheet chaos to boardroom clarity, empowering you to spotlight growth trajectories, dissect market dynamics, or benchmark KPIs with visuals that compel and convince.
Envision a marketing summit where your campaign ROI unravels via a layered bar stack, each segment illuminating channel contributions. Or, during an analyst review, the predictive model slide forecasts trajectories with trend lines that curve toward opportunity. Tailored for PowerPoint 2016 and beyond, the template's charts - editable axes, dynamic series - are geared for rapid iteration, so you iterate on hypotheses, not hurdles in design.
Power-Packed Components for Insightful Decks
The template excels in its data-centric ingenuity, kicking off with dashboard aggregators that consolidate silos into unified views. Pivot to the forecasting tools, where scatter plots correlate variables, revealing correlations that spark strategy shifts.
- Robust Diagram Array: Twenty-eight focused layouts, including cohort analyses for retention paths and Sankey flows for resource allocation.
- Scheme Versatility: Seven assortments, from energizing oranges for upward arcs to calming indigos for reflective dives.
- Intuitive Editing: Formula-linked cells update cascades, with drag-to-adjust legends for on-the-fly refinements.
An analytics consultant in a quarterly deep-dive used the attribution wheel to apportion touchpoints, clarifying multi-channel impacts and refining budget steers.
Targeted Applications: Metrics in Motion
For growth hackers, the A/B test comparator shines, side-by-side metrics framing variants to underscore winners. In sales ops, the pipeline funnel visualizes stages, bottlenecks flagged with conditional colors for urgent interventions. Researchers employ the correlation matrix to probe survey data, heat intensities mapping affinities that inform segmentation.
Picture a CMO defending ad spend: The lifetime value curve arcs from acquisition costs to loyalty peaks, quantifying nurture's worth. These tactics thrive in varied venues - from webinar polls to executive briefs, with vector exports preserving detail in reports.
Streamlined Setup: Data to Deck
- Acquire and Activate: Unpack the .pptx; navigate to outline view for structural overviews.
- Align Visuals: Select schemes from color dropdowns, previewing against data palettes.
- Load Insights: Leverage data import wizards or copy-paste from sources like Google Sheets.
- Animate Flows: Sequence build orders for progressive disclosures, timing for emphasis.
- Validate Output: Run accessibility checks for color contrasts, then archive in OneDrive.
This routine turns raw figures into refined foresight, amplifying your analytical edge.
Outpacing Plain Data Visuals
Beyond PowerPoint's rudimentary plots, these incorporate micro-interactions - like hover tooltips in exported PDFs - mimicking interactive dashboards. Layouts employ whitespace strategically, avoiding the clutter of crammed canvases. For collaborative environments, version history embeds facilitate team annotations.
Link to BI tools for refreshed pulls, evolving static slides into living analytics.
Chart your ascent with data's true voice - acquire the Data-Driven Growth PowerPoint Template for $22 and propel your presentations forward.
Frequently Asked Questions
Can charts link to external data sources?
Yes, via OLE links to Excel for automatic refreshes on open.
Support for advanced stats like regressions?
Base templates for linear models; integrate with add-ins for deeper regressions.
Best for mobile viewing?
Optimized for landscape mode, with simplified animations for battery efficiency.
Number of editable data series per chart?
Up to 50 series, with customizable labels and error bars.
Compatible with PowerPoint Online?
Fully, though some advanced edits require desktop app.
How to handle large datasets?
Aggregate via summaries; use drill-down hyperlinks for details.
Good for
- Project roadmaps and sprint plans
- Product launch timelines
- Quarterly or annual review decks
- Company history and milestone summaries
Licence
reviews
The chord diagram is beautiful for showing flows between categories. Used it for migration data.
The labels on the chords overlapped. Had to adjust the arc sizes.
My audience was impressed visually. The curved arrows are elegant.
The download was slow but worth it. The diagram is not easy to find elsewhere.
Good for a demographic report. The colors were bright and distinguishable.
FAQ
Will it work in Google Slides?
Are fonts embedded?
Can I use this for client work?
What's the refund policy?
Do you update the template after purchase?
Similar templates
See all PowerPoint Templates →



All 1 slides