 Click to zoom
Cycle Periods PowerPoint Template for Time-Based Charts
| Format | .pptx |
| Slides | 44 unique layouts |
| Aspect ratio | 130/73 |
| Compatibility | PowerPoint |
| Animated | No |
| Language | English |
| License | Commercial |
| File size | — |
| Version | v1.0 |
| Last updated | January 2026 |
What's inside
Master Time-Divided Cyclical Processes With Purpose-Built Visuals
Presenting recurring business patterns broken into specific time periods creates a unique visualization challenge. Standard pie charts lack directional flow. Basic timelines miss the recurring nature. When your CFO needs to see how quarterly performance cycles feed into annual planning, or your operations team must track maintenance schedules across defined intervals, you need charts that merge time segmentation with cyclical continuity.
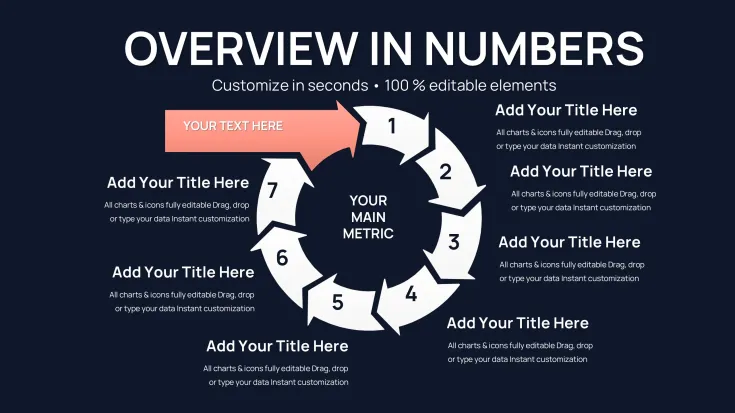
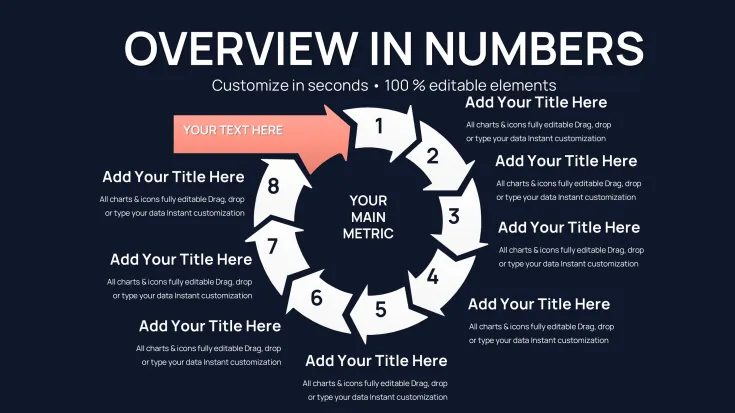
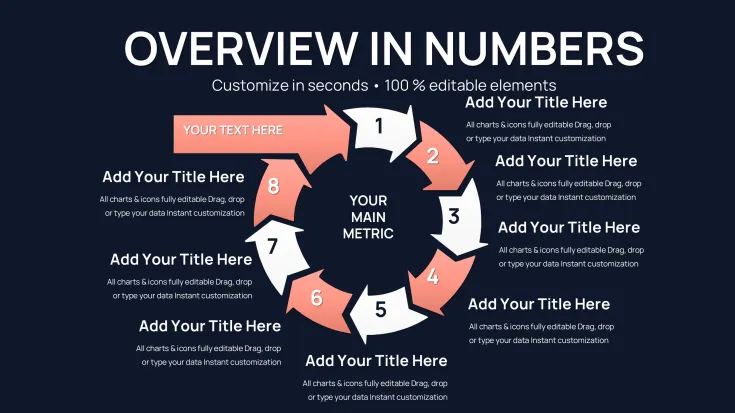
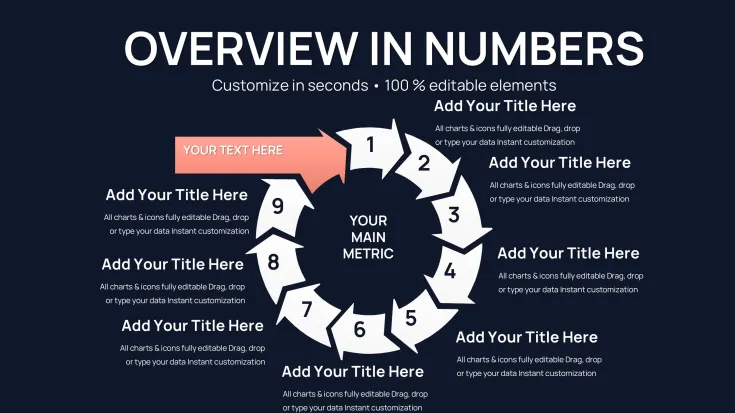
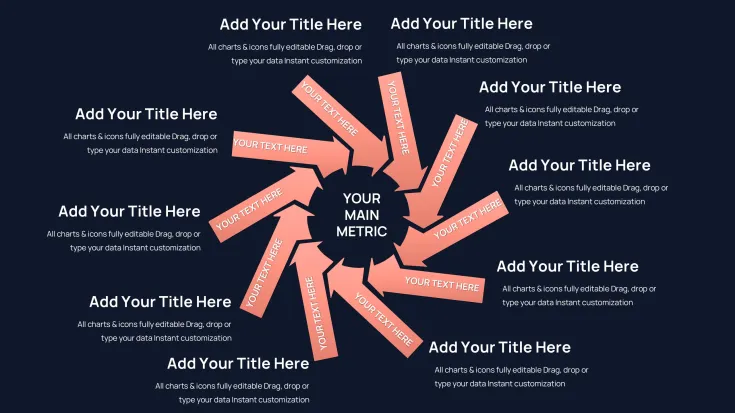
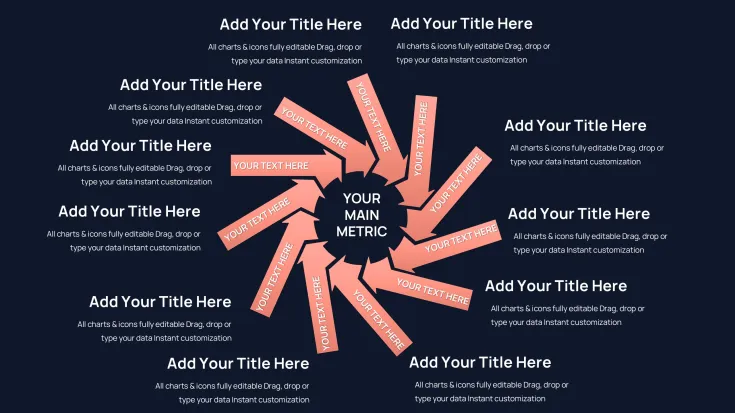
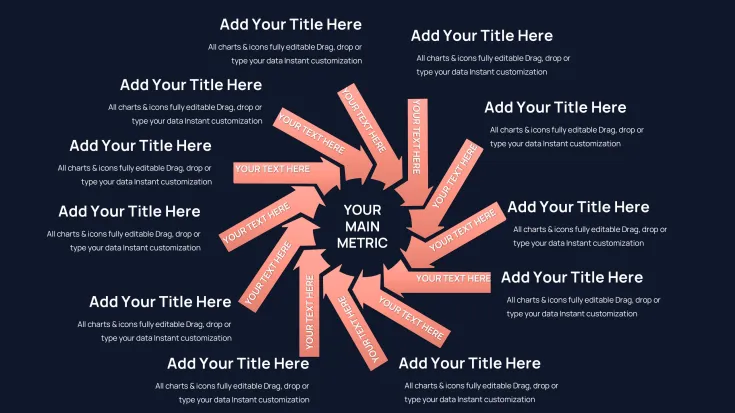
This Cycle Periods PowerPoint Charts Template provides 44 specialized slides engineered specifically for time-based recurring processes. Each layout divides cycles into proportional periods while maintaining the visual flow that emphasizes repetition and continuity. The charts work equally well for fiscal quarters, project sprints, seasonal patterns, or any process where time intervals repeat in systematic sequences.
After building hundreds of quarterly business review decks, I've seen how effectively these period-based cycle charts communicate patterns that confuse audiences when shown in linear formats. The combination of circular arrangement and time segmentation creates immediate comprehension of how periods connect within larger cycles.
Forty-Four Specialized Slides for Period-Based Cycle Visualization
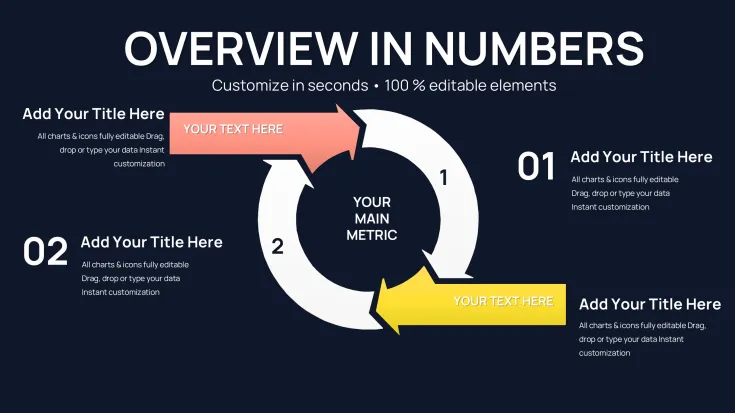
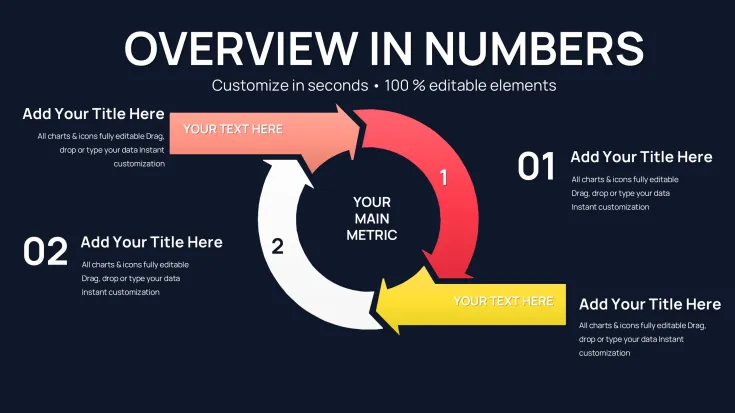
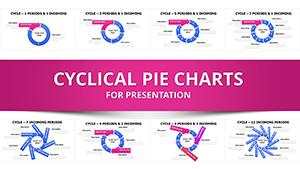
The template collection spans multiple period configurations, from simple two-period splits through complex twelve-period divisions representing months within annual cycles. Each slide maintains professional aesthetics while prioritizing functional clarity that survives projection in executive briefing rooms.
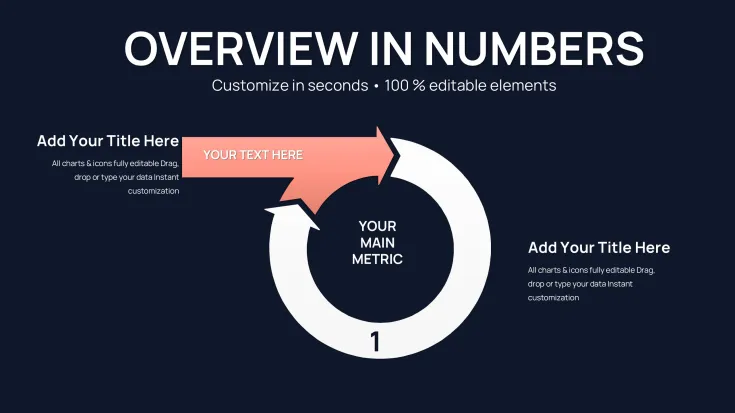
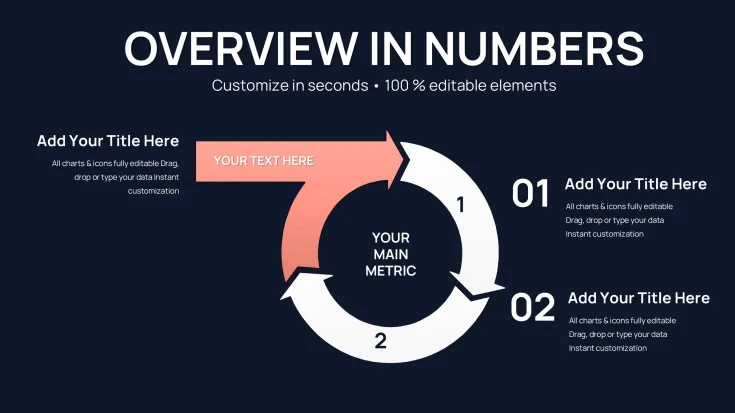
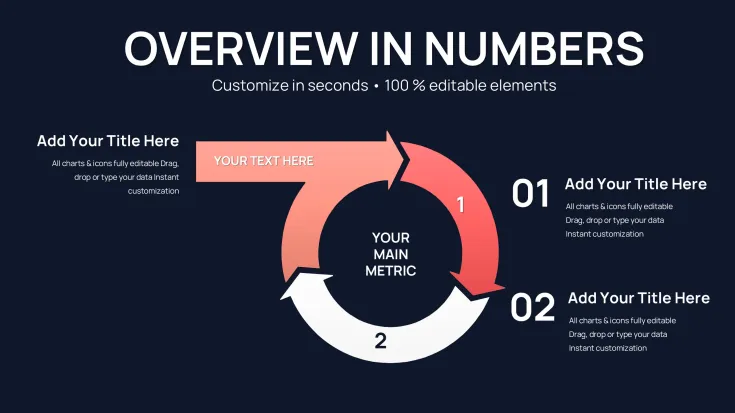
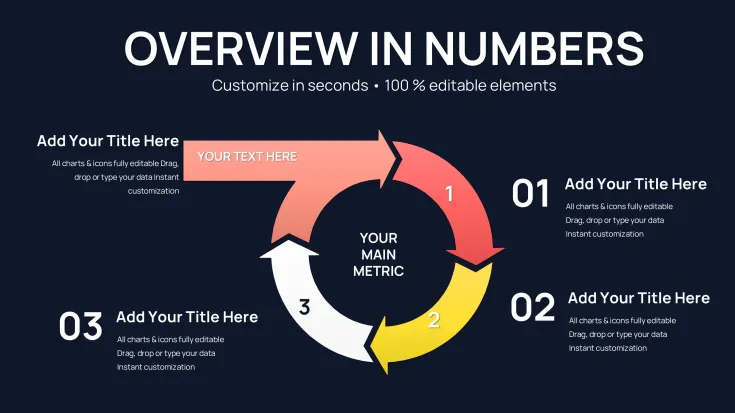
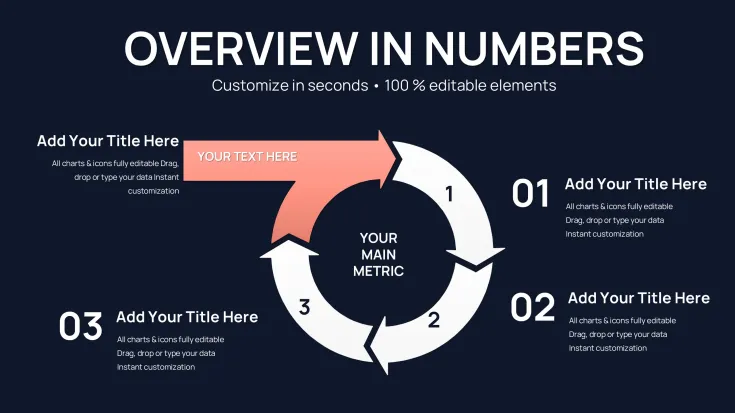
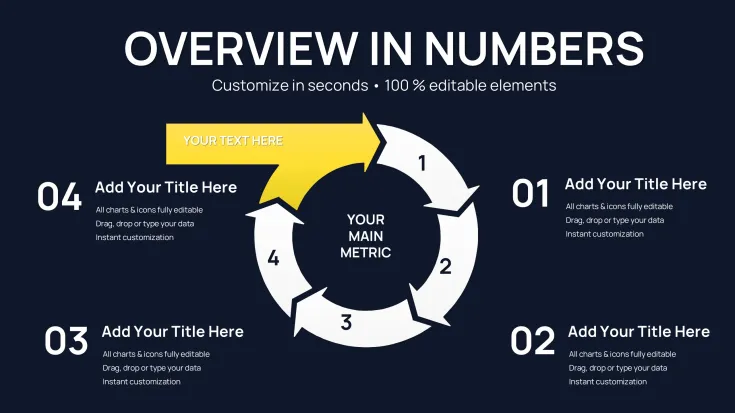
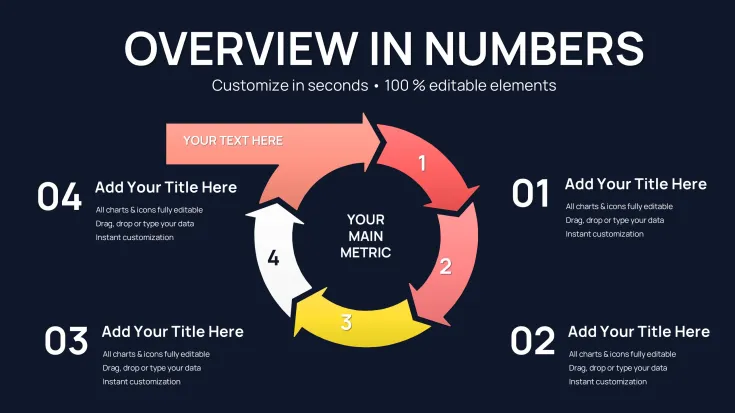
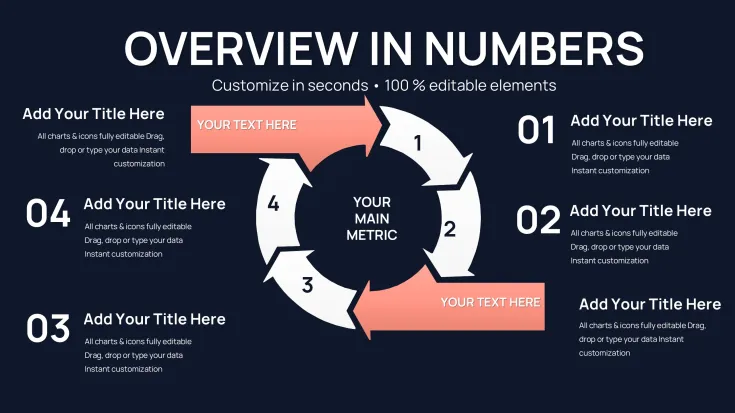
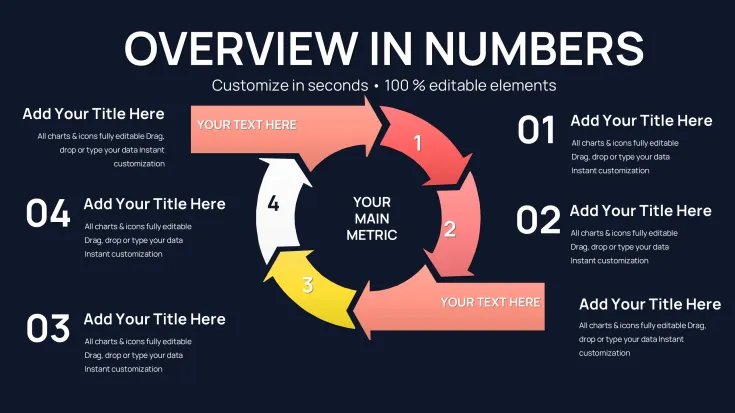
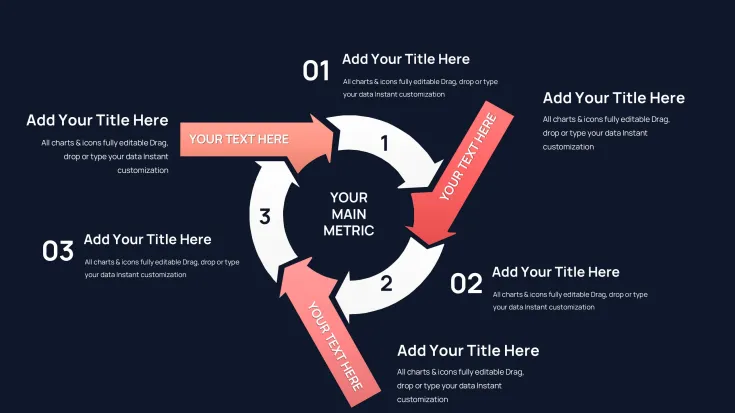
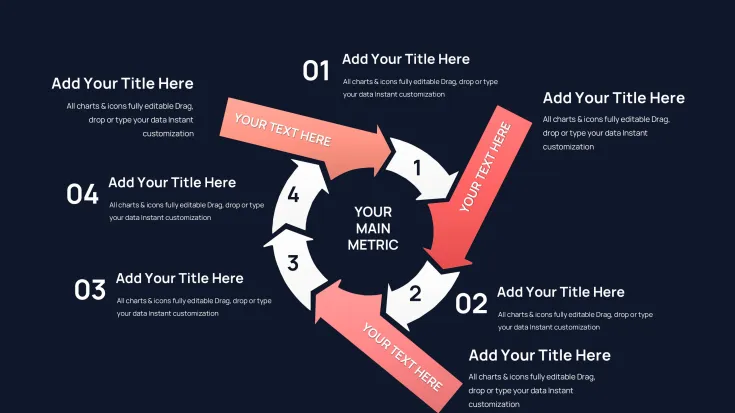
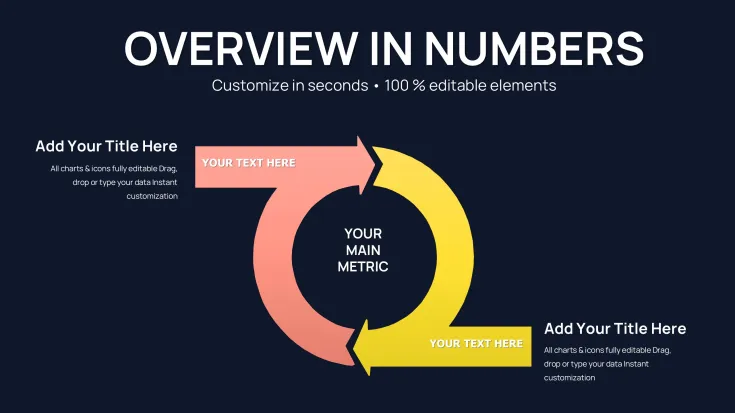
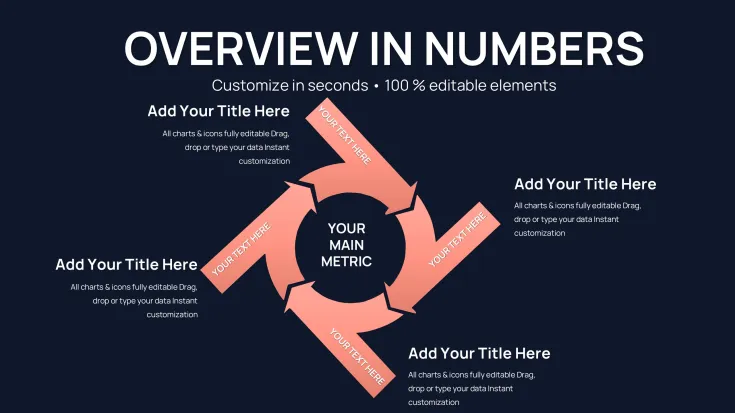
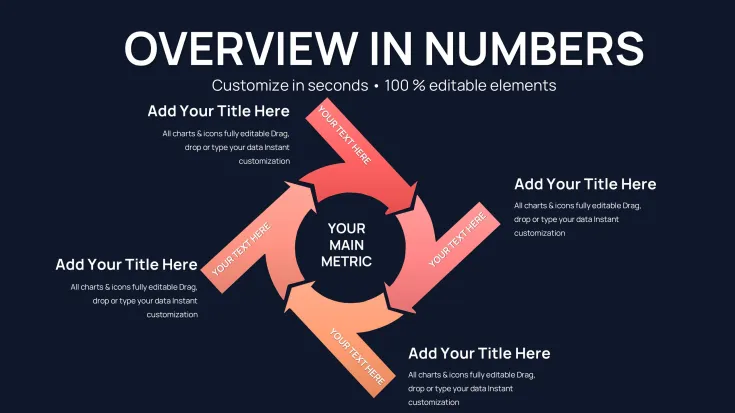
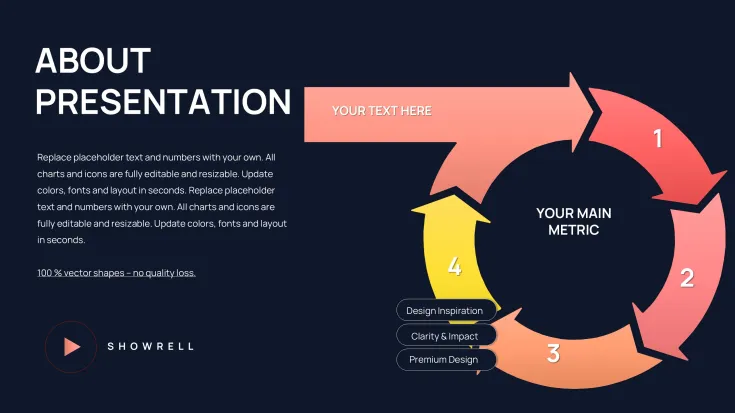
Four-period cycle slides work perfectly for quarterly business reporting. Each quarter occupies one quadrant with dedicated space for metrics, highlights, and period-specific commentary. The circular path emphasizes how Q4 results influence Q1 planning, making the fiscal cycle nature explicit rather than implied.
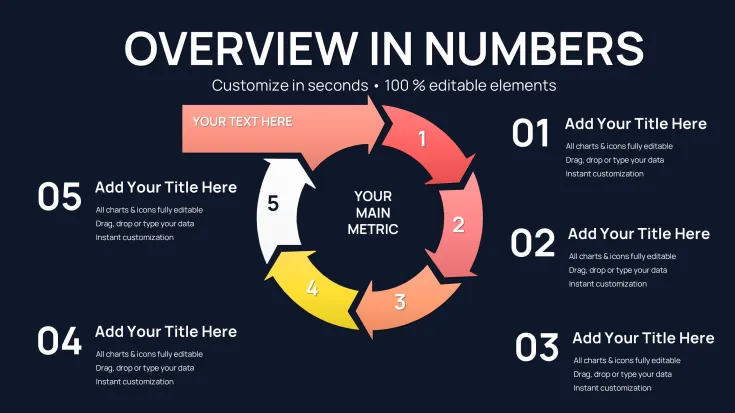
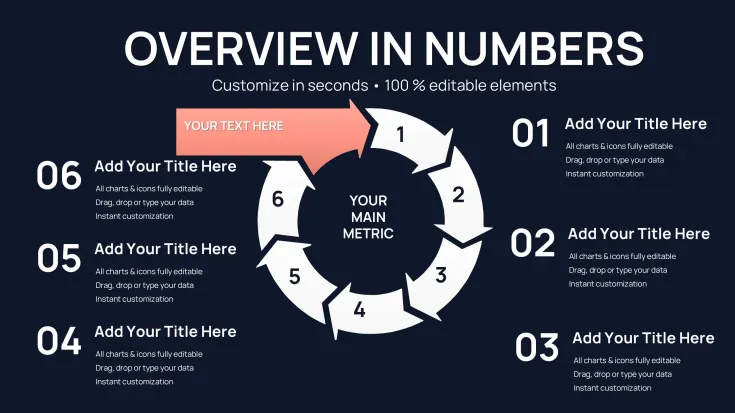
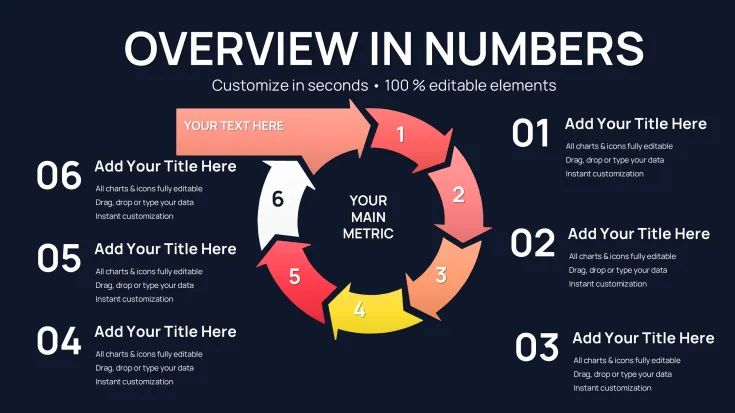
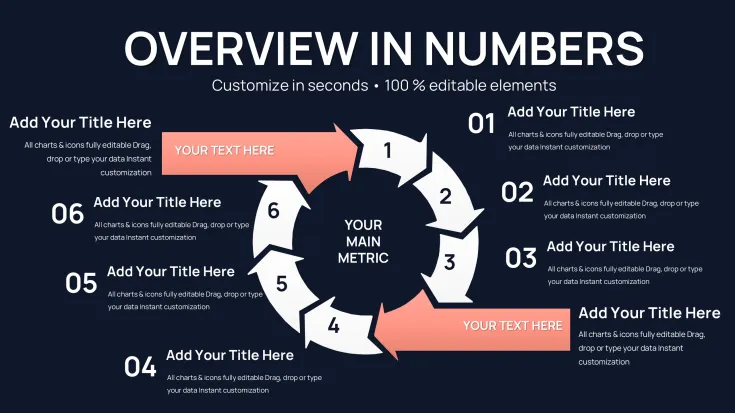
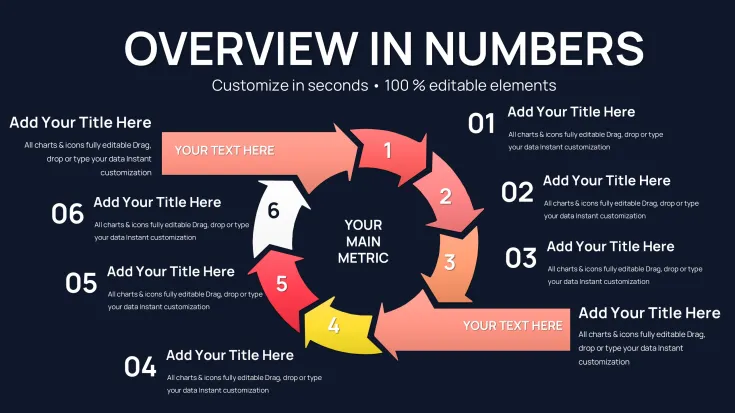
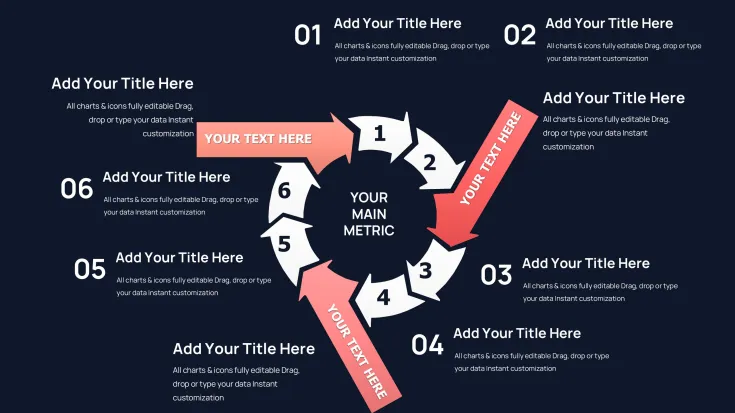
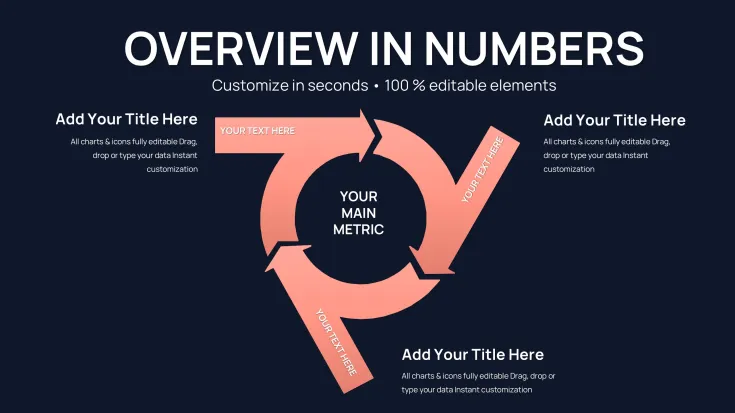
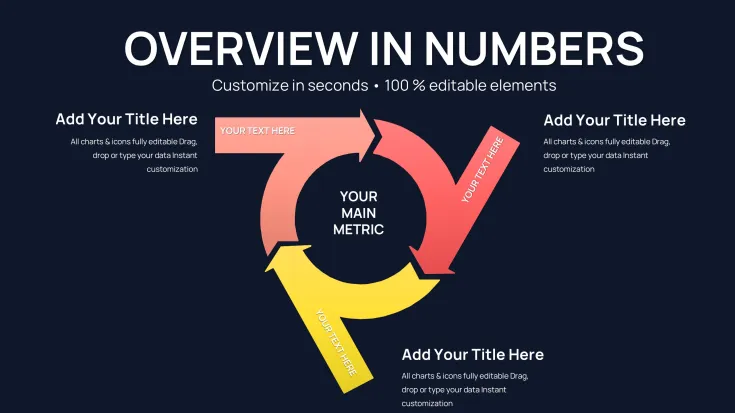
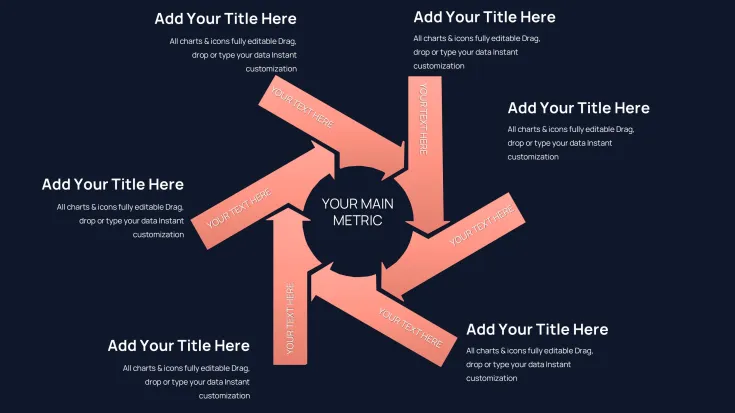
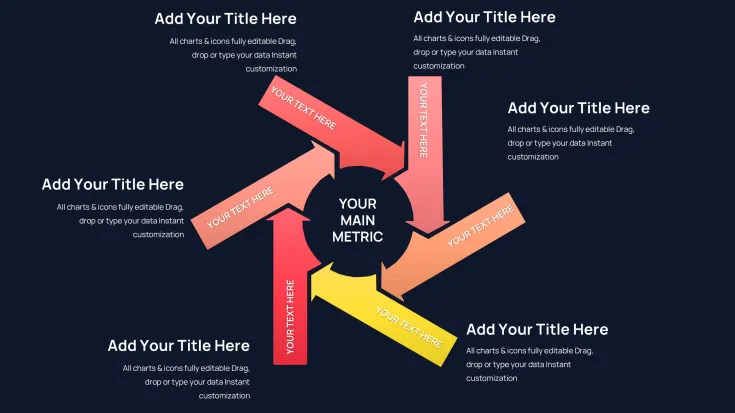
Six-period configurations suit bi-monthly cycles or semester-based academic calendars. The proportional divisions maintain visual balance while providing enough segments for detailed period breakdowns. Marketing teams use these for campaign cycles, showing how each two-month period contributes to half-year objectives.
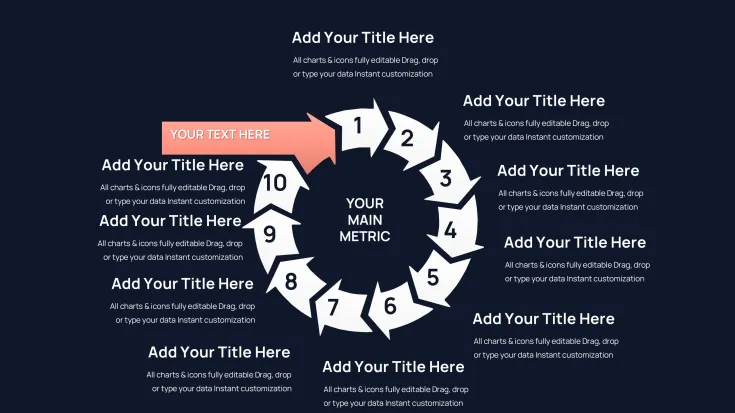
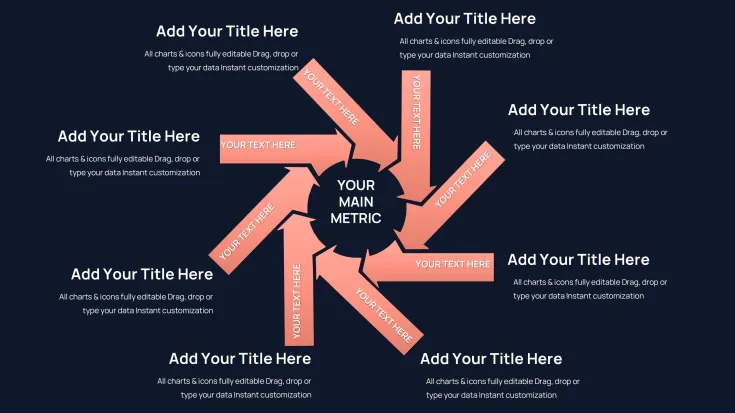
Eight-period slides accommodate processes divided into eight-week sprints or phases. Product development teams track agile iterations, training departments map eight-module certification programs, and retail organizations show seasonal merchandise cycles across eight distinct periods.
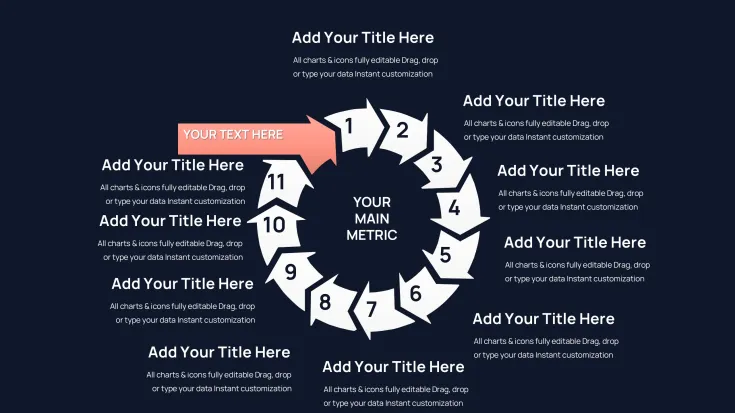
Twelve-period annual cycle slides give each month individual representation within the full year. Financial controllers present monthly revenue patterns, HR directors show hiring cycles across calendar months, and supply chain managers track inventory fluctuations through all twelve months with the circular format reinforcing year-over-year continuity.
Nested period slides show cycles within cycles. Display annual patterns with quarterly breakdowns, where each quarter segment contains its own three-month subdivision. This hierarchical approach works for strategic planning presentations that need to show both macro annual goals and micro quarterly tactics.
Comparison period slides place two cycles side-by-side for year-over-year analysis. Show this year's quarterly performance against last year's results using parallel period cycles. The matched structure makes performance trends immediately visible without dense numerical tables.
Strategic Applications Across Business Functions
Finance departments rely on these templates for earnings call presentations and board reporting. The quarterly cycle slides show revenue progression across fiscal periods, with color coding distinguishing strong quarters from periods requiring strategic intervention. CFOs appreciate how the circular format keeps all four quarters visible simultaneously rather than requiring page turns or scrolling.
Sales organizations track pipeline development across monthly or quarterly periods. Each period segment shows new lead generation, qualification rates, and closed deals within that time frame. The cycle visualization helps sales leaders spot seasonal patterns and adjust forecasting models accordingly.
Marketing directors present campaign performance across defined periods. A six-period cycle might represent six major campaign launches throughout the year, with metrics for each period including reach, engagement, and conversion outcomes. The circular structure emphasizes how each campaign builds awareness for the next.
Operations managers document preventive maintenance schedules using period cycles. Manufacturing facilities run maintenance during scheduled downtime periods, with each cycle segment representing a maintenance window. The circular view shows how maintenance intervals distribute across the annual calendar.
Human resources teams communicate talent development cycles. Performance review periods, goal-setting windows, training sessions, and promotion cycles all fit within period-based circular charts. Employees see how their development activities align with organizational talent management rhythms.
Education administrators present academic calendars as period cycles. Semesters, terms, or quarters appear as cycle segments with registration periods, instruction periods, examination windows, and break periods all visible within the circular academic year.
Workflow Integration and Customization Capabilities
The template works natively in PowerPoint 2016 through current Microsoft 365 versions, ensuring compatibility with standard corporate software environments. Keynote users on Mac systems can open and edit files with complete functionality. Google Slides supports the template with all editing features available through the web interface.
Customization requires only basic PowerPoint competency. Click any period segment to change colors matching your reporting standards. Many organizations color-code periods by performance, using green for periods exceeding targets and red for periods requiring attention. Text boxes accept standard typing for period labels, metrics, and commentary.
The template accommodates your existing brand guidelines completely. Apply corporate color palettes using PowerPoint's theme colors feature. Change fonts to match organizational standards. Adjust segment sizes if certain periods deserve emphasis over others. All shapes are vector objects that scale without quality loss when resized.
For recurring presentations, save customized versions as your baseline template. Monthly or quarterly updates then require only data refreshes rather than complete rebuilds. Link text fields to Excel data sources for automatic updates when source spreadsheets change.
Combine period cycle slides with other chart types in comprehensive presentations. Lead with a full-year twelve-period cycle for context, then drill into individual quarters using four-period quarterly cycles. The consistent circular visual language maintains coherence across different time granularities.
Comparative Analysis: Period Cycles Versus Alternative Approaches
Visualization NeedPeriod Cycle ChartsLinear TimelinesStandard Pie ChartsShowing time intervalsPeriods clearly defined with labelsExcellent for sequential viewNo time dimension indicatedEmphasizing repetitionCircular format shows continuityRepetition requires multiple timelinesStatic, no flow indicationComparing periodsAll periods visible simultaneouslyRequires scrolling or page turnsComparison possible but no sequenceSpace efficiencyCompact circular footprintExtends horizontally, needs widthCompact but lacks directionalityProfessional appearanceModern, strategic lookCan appear basic or genericOverused in business contextsPattern recognitionStrong for cyclical patternsBetter for one-time sequencesGood for proportion, not patternsProfessional Implementation Scenarios
When presenting fiscal year results to boards of directors, I use the four-period quarterly cycle with each segment colored by performance against budget. The board immediately sees which quarters drove annual success and which required course corrections. Supporting detail slides then expand individual quarters using monthly subdivisions.
The twelve-period annual cycle proves invaluable for subscription business models tracking monthly recurring revenue. Each month segment shows MRR figures, churn rates, and net new subscriptions. The circular format reinforces that December performance sets up January, emphasizing the continuous nature of subscription operations.
Project portfolio managers use nested period cycles to show how individual project phases align with fiscal periods. The outer cycle represents fiscal quarters while inner cycles represent project sprints or phases. This layered view helps executives understand resource allocation across both organizational time structures and project timelines.
Retail merchandising teams map inventory cycles using period charts aligned with seasons. Each period represents a merchandise season with inventory buys, sell-through rates, and markdown periods visible. The cycle view emphasizes how end-of-season clearance feeds capital for next season's purchasing.
Technical Specifications and Practical Details
The 44-slide collection includes multiple variations of each period count. You receive light backgrounds, dark backgrounds, and neutral backgrounds for each configuration. This variety ensures appropriate options for different presentation contexts, from bright conference rooms to dimmed auditoriums.
Slides include both filled period segments and outlined segments. Filled versions work well when period data varies significantly and color coding adds information. Outlined versions suit situations where period uniformity deserves emphasis or when overlay text needs maximum contrast.
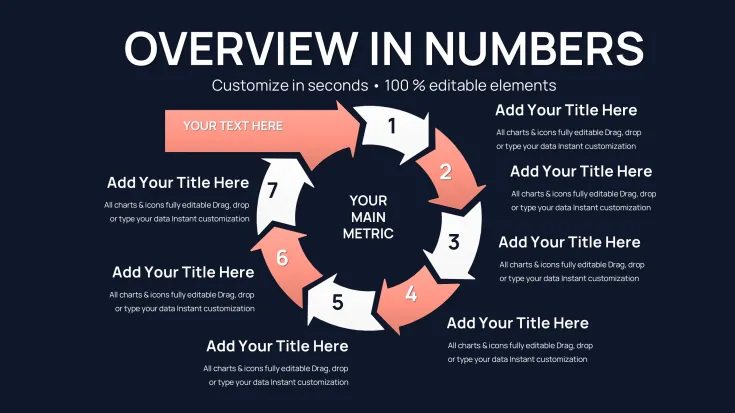
Directional arrow variations show clockwise or counterclockwise flow depending on your preference. Western audiences typically read clockwise, while some process documentation standards prefer counterclockwise notation. The template provides both options.
Combination slides merge period cycles with supporting data visualizations. One layout places a period cycle alongside a trend line showing period-over-period changes. Another pairs the cycle with a bar chart for detailed period comparisons. These integrated slides eliminate the need to jump between multiple charts during presentations.
Start creating more effective period-based presentations today. Download this template for immediate access to all 44 professionally designed slides with lifetime usage rights.
Frequently Asked Questions
What makes period-based cycles different from standard process cycles?
Period-based cycles emphasize time segmentation as a core element, with each segment representing a specific time interval like a month, quarter, or sprint. Standard process cycles focus on sequential steps or stages that may or may not have equal time durations. Period cycles work best when time intervals matter as much as the activities within them, such as fiscal reporting, seasonal planning, or scheduled maintenance programs.
Can I adjust period proportions if time intervals are unequal?
Yes, all period segments are individually resizable PowerPoint shapes. If your first period spans three months while others span one month, expand that segment proportionally. Select the segment, grab the sizing handles, and adjust. However, unequal segments may reduce visual clarity, so consider whether showing time-to-scale provides sufficient value to justify disrupting visual balance.
How do these templates handle periods that cross calendar year boundaries?
Fiscal year presentations often start in periods other than January. Designate your cycle start point at any position and label periods accordingly. If your fiscal year runs July through June, position July at the traditional starting point and proceed around the cycle. The circular format accommodates any period numbering or labeling scheme without visual awkwardness.
What's the recommended approach for showing targets versus actuals?
Use two-layer period cycles where the outer ring shows targets and the inner ring shows actuals, or use side-by-side cycles for comparison. Alternatively, apply color coding within single periods, using color intensity or pattern fills to indicate performance levels. Green segments for exceeded targets, yellow for on-track, and red for below expectations creates instant visual assessment.
Do these templates work for non-business applications?
Absolutely. Academic institutions show semester cycles, athletic programs track training periodization, healthcare facilities map patient care protocols across treatment intervals, and research teams document longitudinal study timelines. Any recurring process with defined time periods benefits from these visualizations regardless of whether the context is commercial, educational, medical, or scientific.
How many periods can one cycle effectively display?
Twelve periods represent the practical maximum for clarity. Beyond twelve segments, individual period labels become difficult to read and the chart loses visual impact. If your process genuinely requires more than twelve periods, consider nested cycles where an outer cycle shows major periods and inner cycles show subdivisions, or use multiple separate cycles for different time granularities.
Good for
- Project roadmaps and sprint plans
- Product launch timelines
- Quarterly or annual review decks
- Company history and milestone summaries
Licence
reviews
Period-based cycle charts with 4,6,8,12 segments perfect for quarterly reviews. Color coding by performance clarified patterns. Nested cycles showed macro/micro nicely.
Finance user: twelve-period annual for MRR tracking reinforces continuity. Side-by-side year-over-year comparisons insightful. Vector shapes scale well.
Marketing: six-period campaign cycles with metrics per segment. Directional arrows guide flow. 44 slides cover most time-based needs thoroughly.
The template's proportional divisions and light/dark variants suit different rooms. Easy data input. Helped spot seasonal patterns fast.
Operations: maintenance schedule cycles distributed across year. Professional circular footprint efficient. Minor adjustment for unequal periods needed.
Deadline: integrated bar/trend combos eliminate chart jumping. Strong for recurring process visualization.
FAQ
Will it work in Google Slides?
Are fonts embedded?
Can I use this for client work?
What's the refund policy?
Do you update the template after purchase?
Similar templates
See all PowerPoint Charts →
All 44 slides