 Click to zoom
Creative Panel Circle with Segments PowerPoint Charts Template: Architectural Segmentation
| Format | .pptx |
| Slides | 32 unique layouts |
| Aspect ratio | 16:9 |
| Compatibility | PowerPoint |
| Animated | No |
| Language | English |
| License | Commercial |
| File size | — |
| Version | v1.0 |
| Last updated | August 2023 |
What's inside
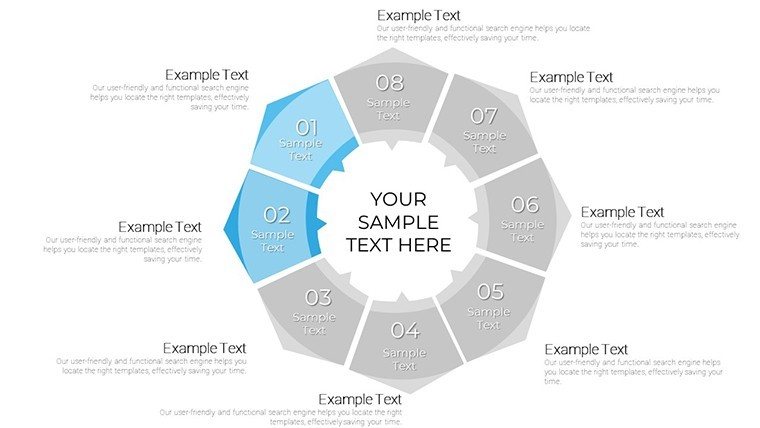
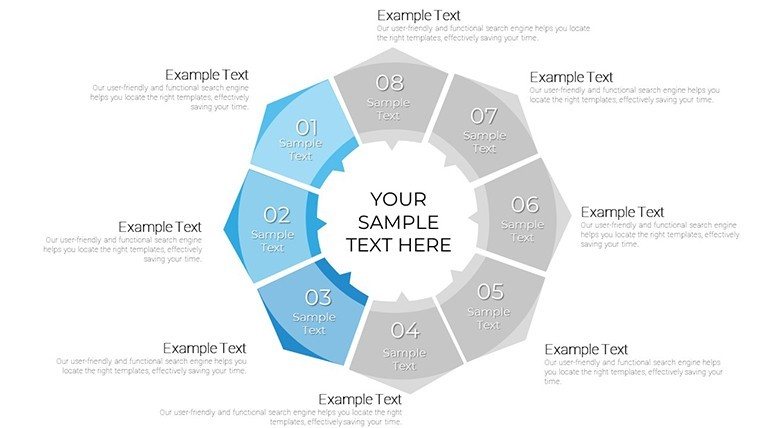
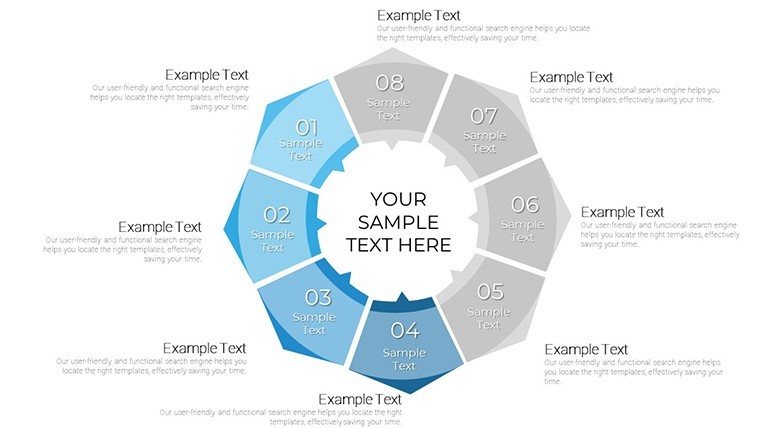
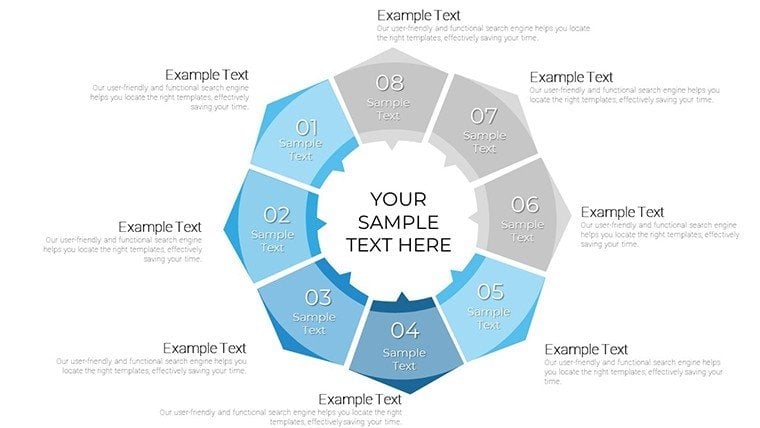
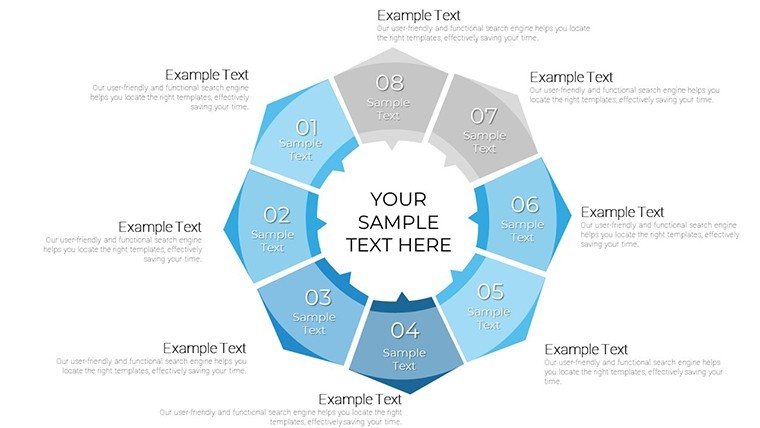
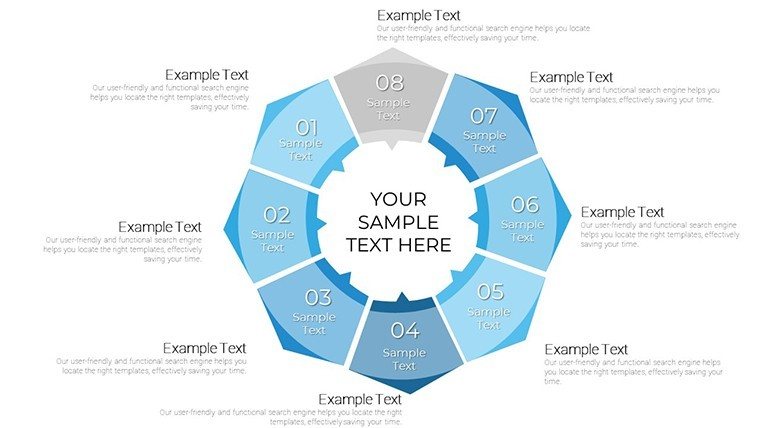
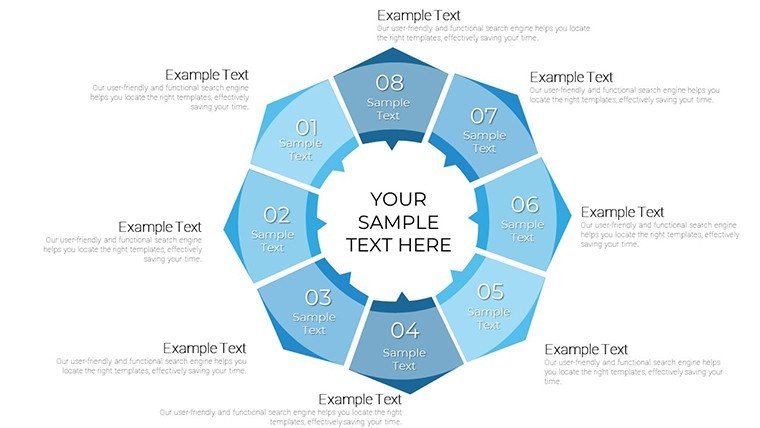
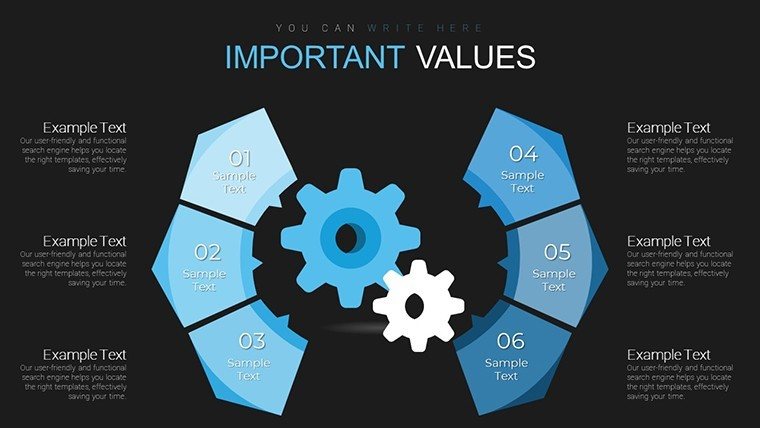
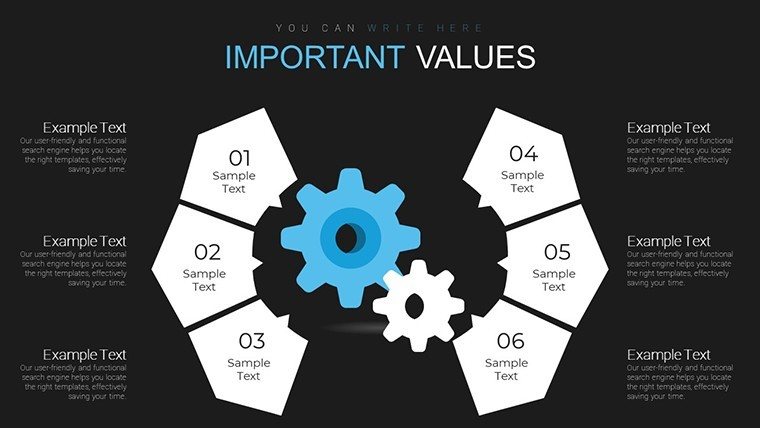
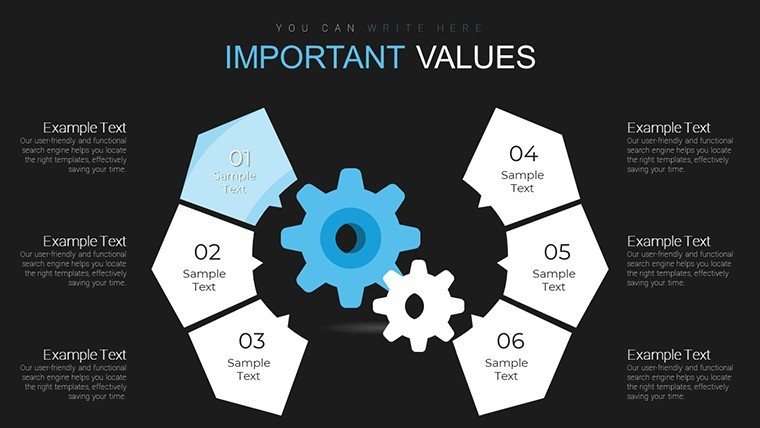
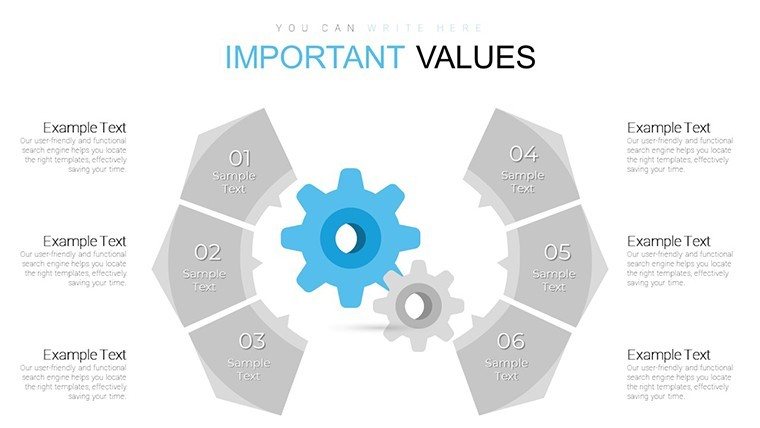
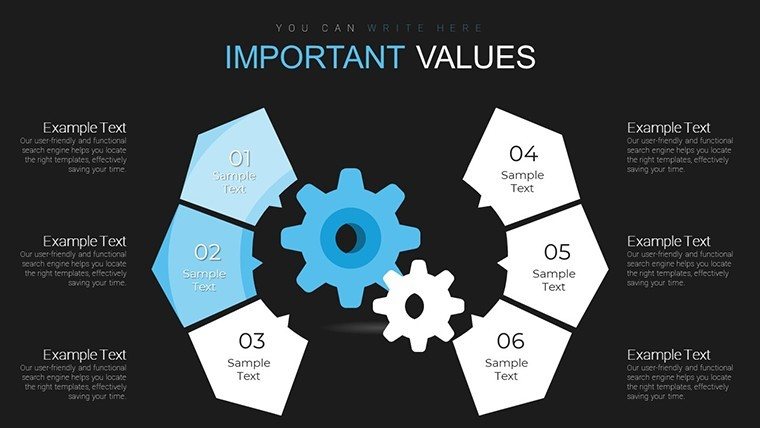
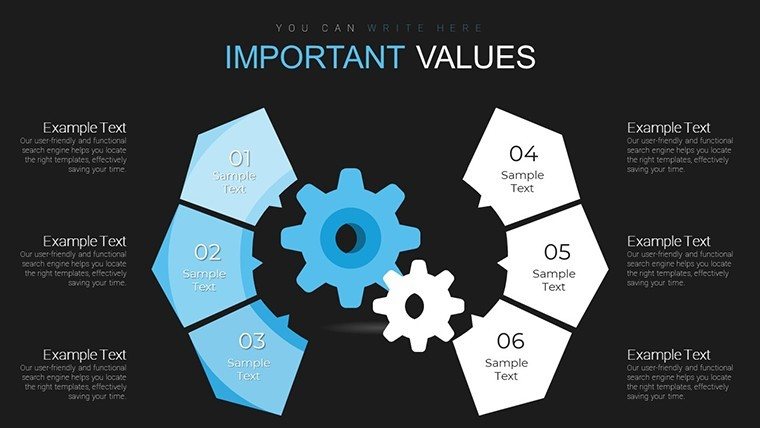
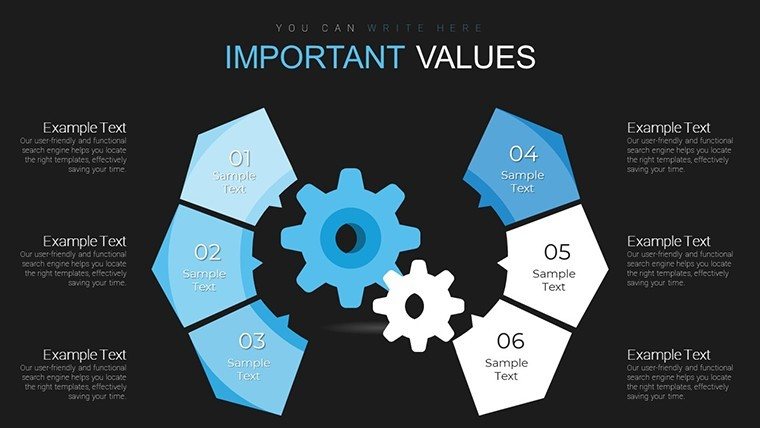
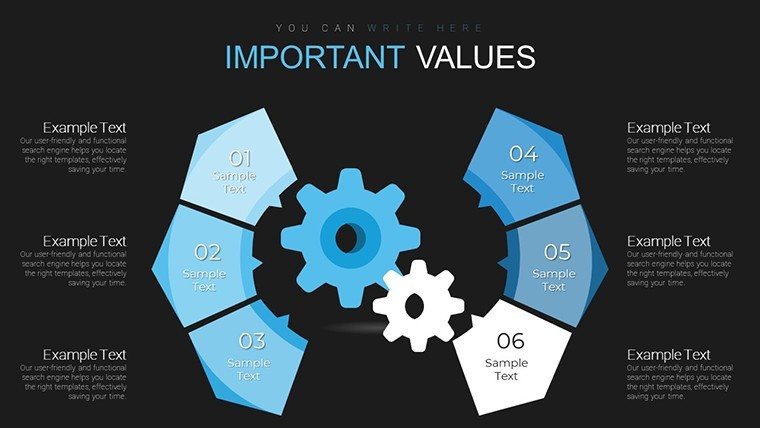
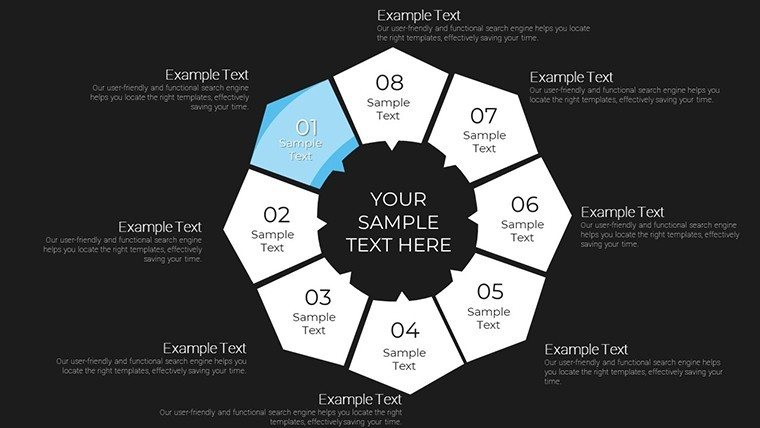
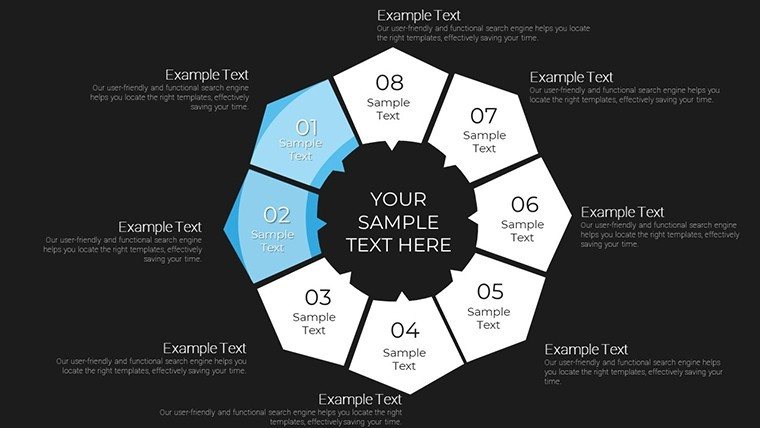
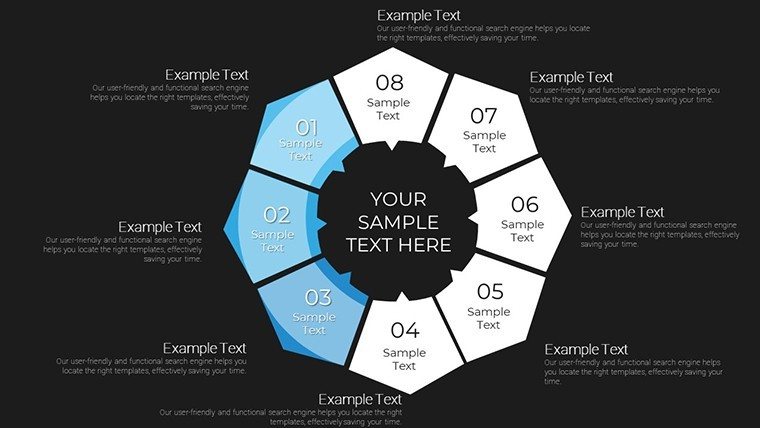
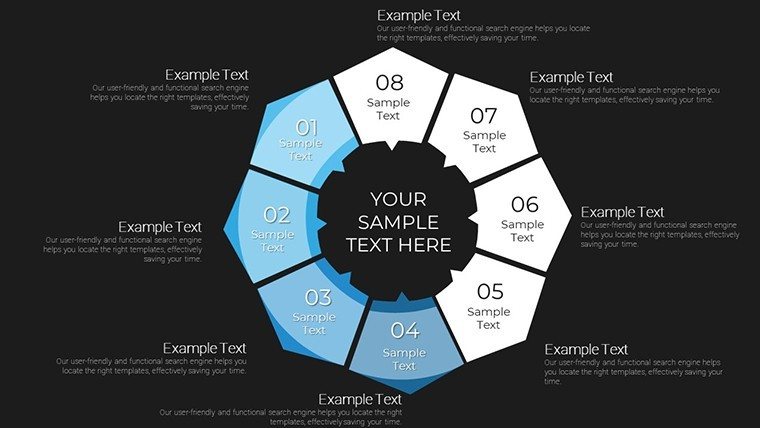
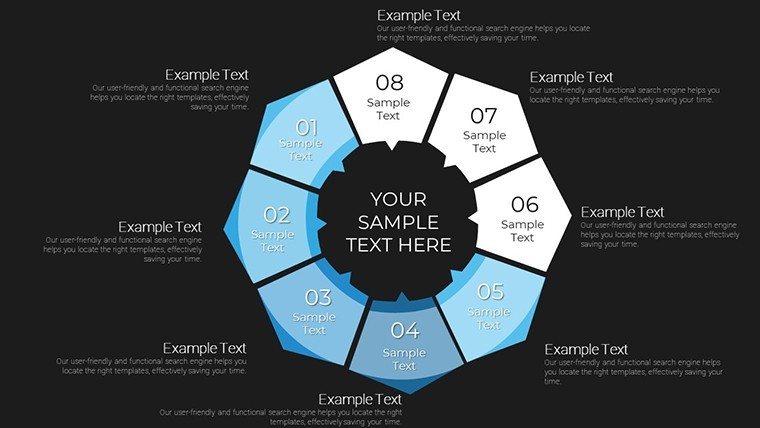
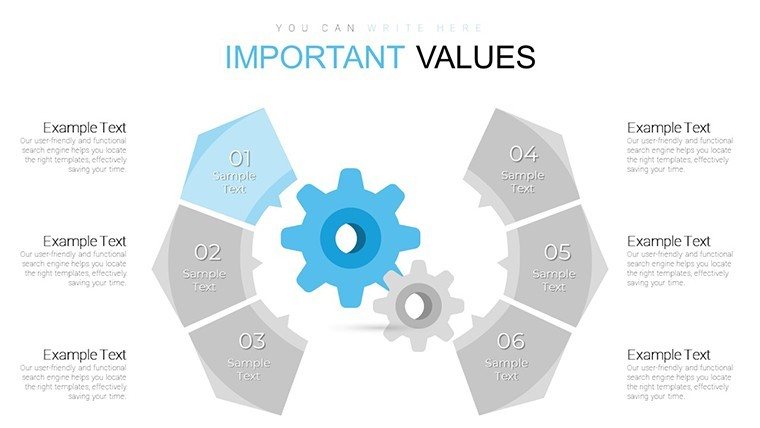
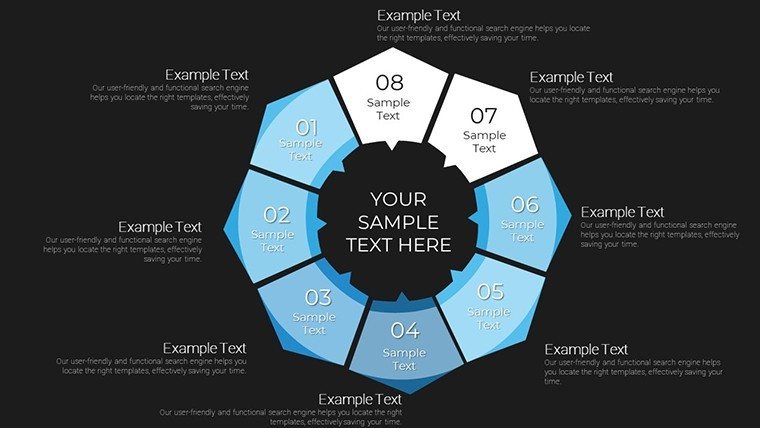
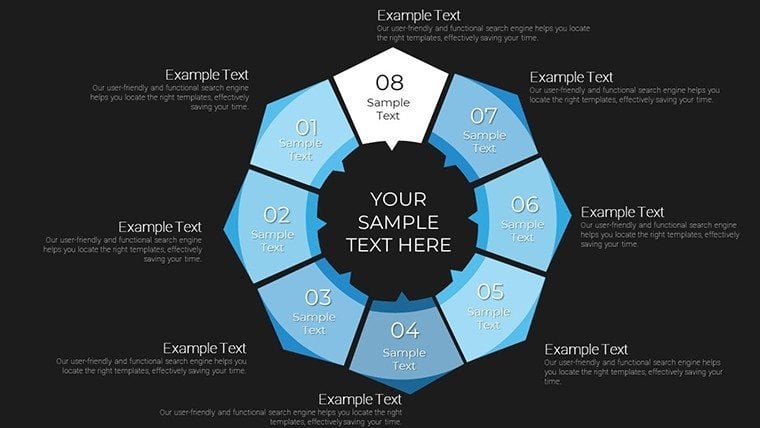
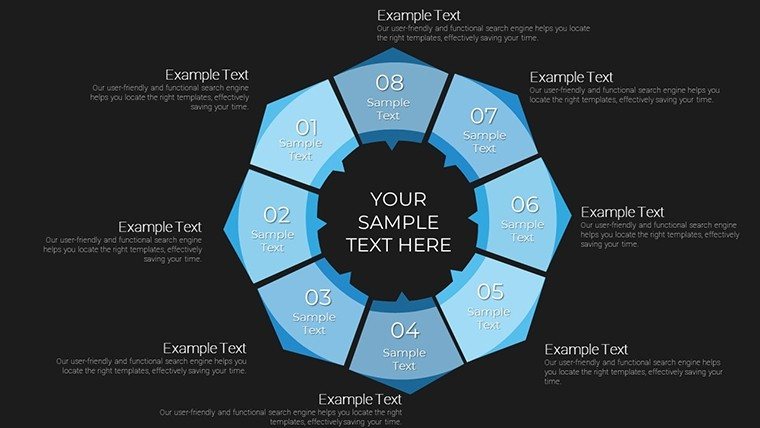
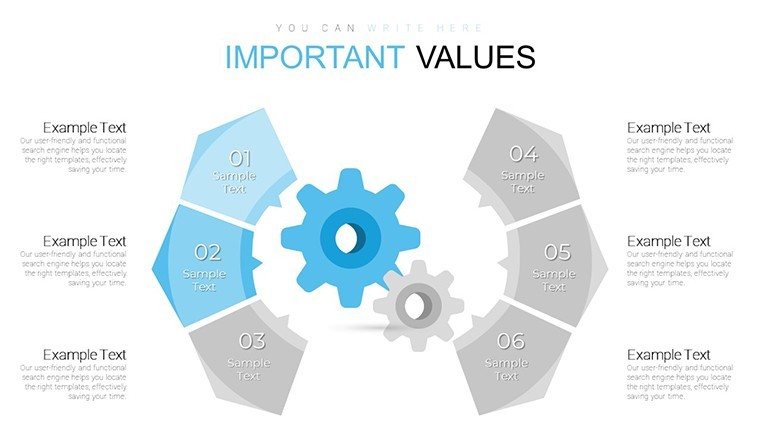
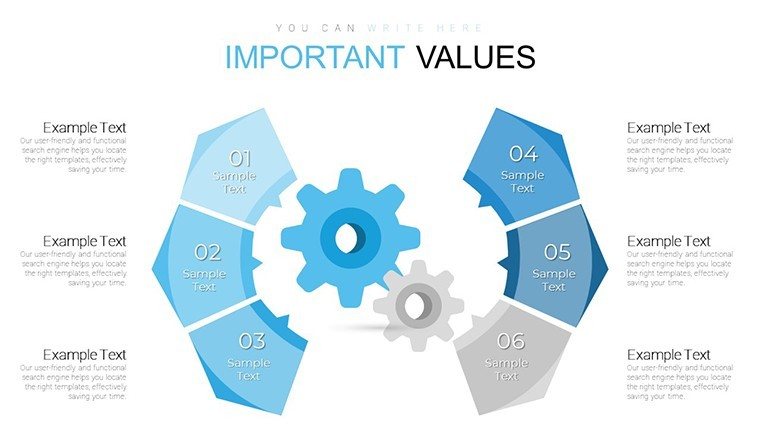
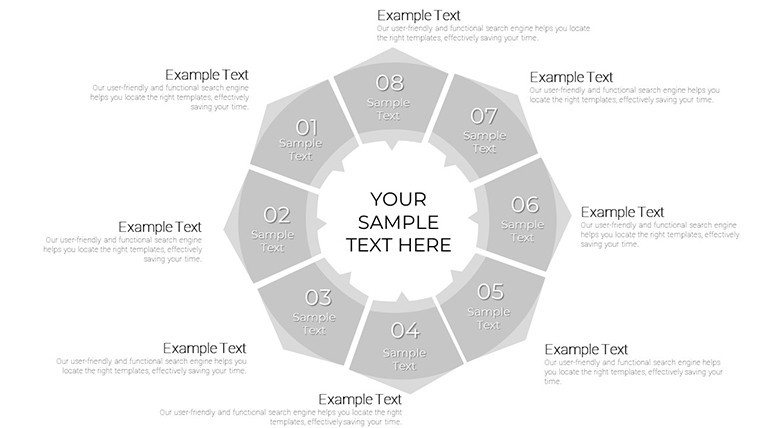
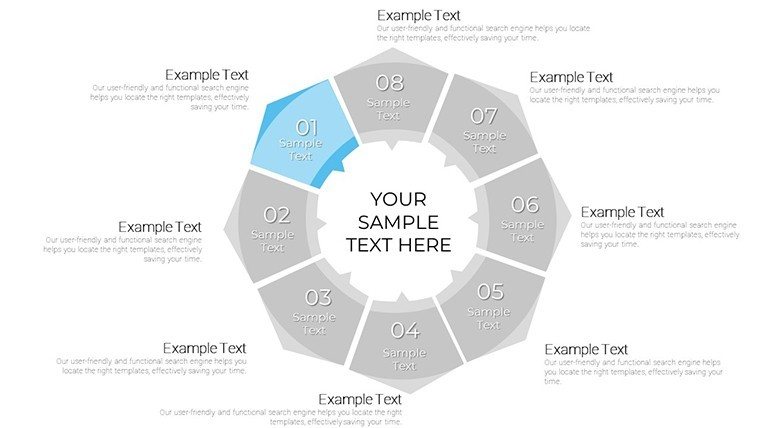
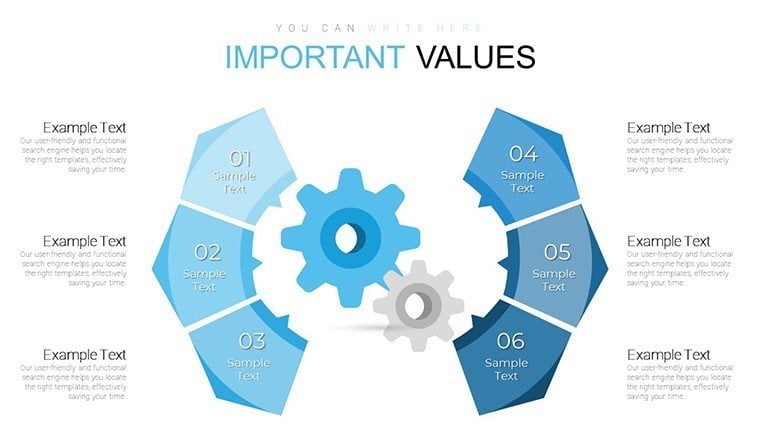
Delve into the art of segmented storytelling with our Creative Panel Circle PowerPoint Charts Template, a powerhouse for architects seeking to dissect and display multifaceted project data. Boasting 32 editable slides, this tool transforms circular panels into insightful visuals, ideal for breaking down budget allocations, material distributions, or stakeholder roles in complex builds. Inspired by radial designs in iconic structures like the Pantheon, it helps you present holistic views that foster deeper client understanding, positioning your firm as a leader in innovative communication for AIA-compliant proposals.
The Essence of Segmented Circles in Design Communication
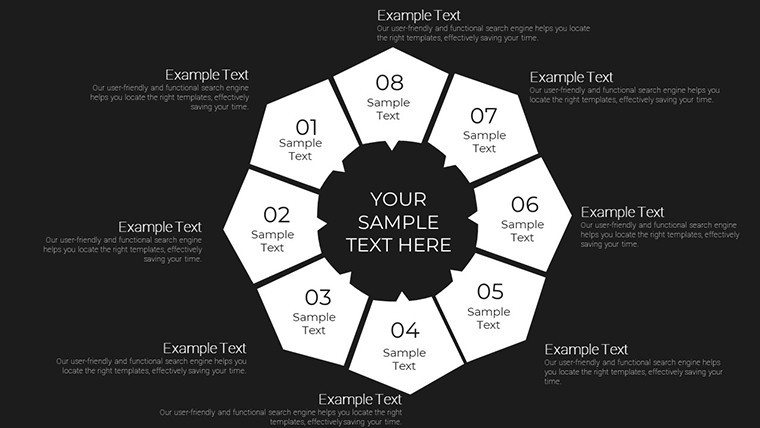
Segmented circles offer a balanced, encompassing format that echoes architectural symmetry, allowing for equitable representation of parts within a whole. This template's design facilitates clear comparisons, far surpassing generic pie charts by incorporating panels for detailed annotations. Fully compatible with PowerPoint and Google Slides, it streamlines your creative process, letting you focus on conceptualizing spaces rather than formatting visuals.
Core Features for Enhanced Presentations
- Segmented Panel Variety: Mix and match radial divisions for data like site analysis breakdowns or team role distributions.
- 32 Comprehensive Slides: From basic circles to advanced multi-layered panels, covering all angles of project dissection.
- Full Editability: Alter segments' sizes, colors, and labels to reflect project specifics, with high-fidelity graphics for print or digital use.
- Integrated Tools: Built-in legends and tooltips for intuitive navigation, enhancing user experience in presentations.
Weaving in concepts like radial diagramming and proportional visualization ensures organic SEO alignment for design-focused searches.
Applied Use in Architectural Contexts
A real-world example: An urban design firm utilized segmented circles to illustrate land use allocations in a mixed-use development pitch. By paneling out residential, commercial, and green spaces, they conveyed balance to planners, securing approvals swiftly. This mirrors AIA's advocacy for transparent data sharing, building trust through visual equity. For interior architects, it's perfect for material mood boards, segmenting palettes by room function.
Guided Application: Budget Segmentation for Projects
- Initiate with Slide 1: A master circle overview of total budget.
- Drill Down in Slides 10-20: Segment specifics like labor vs. materials, with interactive hover effects.
- Compare Alternatives: Use parallel panels to show cost scenarios, aiding decision-making.
- Wrap Up: Summarize with a unified circle, tying back to project goals.
This structure tackles segmentation challenges, ensuring no aspect is overlooked in comprehensive reviews.
Pro Tips from Industry Veterans
Channeling experts like Le Corbusier, who championed modular proportions, use segments to emphasize harmony in designs. Reference studies from the Royal Institute of British Architects on visual aids to add weight, perhaps segmenting sustainability metrics. Suggestion: Layer animations to reveal segments progressively, building narrative tension akin to unveiling a model.
Outperforming basic tools, this template's depth minimizes ambiguity, potentially accelerating project timelines through clearer stakeholder alignments.
Workflow Harmony and Beyond
Integrate effortlessly with design software, pulling data from SketchUp for accurate proportions. For collaborative efforts, its shareable format supports feedback cycles, vital in iterative architecture. In teaching, it aids in deconstructing masterpieces, like segmenting the Parthenon's frieze for student analysis.
Addressing Segmentation Pitfalls
When data overwhelms, this template's paneling prevents clutter, promoting focused discussions on key segments.
Transform your insights - secure this Panel Circle template and segment your way to presentation excellence.
Frequently Asked Questions
How many segments can I add per circle?
Unlimited, with easy resizing to maintain balance and readability.
Are the panels interactive?
Yes, with options for hyperlinks and tooltips in PowerPoint.
Suitable for large datasets?
Ideal, as multi-slide setups handle complexity without overcrowding.
Can I export segments to reports?
Absolutely, high-res exports ensure quality in printed materials.
Includes design guidelines?
Yes, notes provide best practices for proportional accuracy.
Good for
- Project roadmaps and sprint plans
- Product launch timelines
- Quarterly or annual review decks
- Company history and milestone summaries
Licence
reviews
This helped organize my research presentation better.
The graph layouts looked clean without much effort.
Some decorative shapes were distracting.
Easy to move things around.
Useful for quick student projects.
FAQ
Will it work in Google Slides?
Are fonts embedded?
Can I use this for client work?
What's the refund policy?
Do you update the template after purchase?
Similar templates
See all PowerPoint Charts →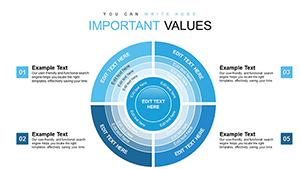
All 32 slides