 Click to zoom
Circular Concept PowerPoint Charts - Professional Presentation Template
| Format | .pptx |
| Slides | 12 unique layouts |
| Aspect ratio | 16:9 |
| Compatibility | PowerPoint |
| Animated | No |
| Language | English |
| License | Commercial |
| File size | — |
| Version | v1.0 |
| Last updated | June 2023 |
What's inside
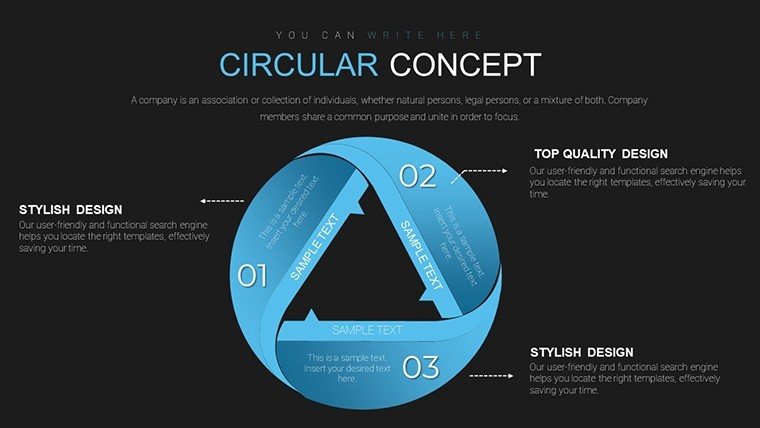
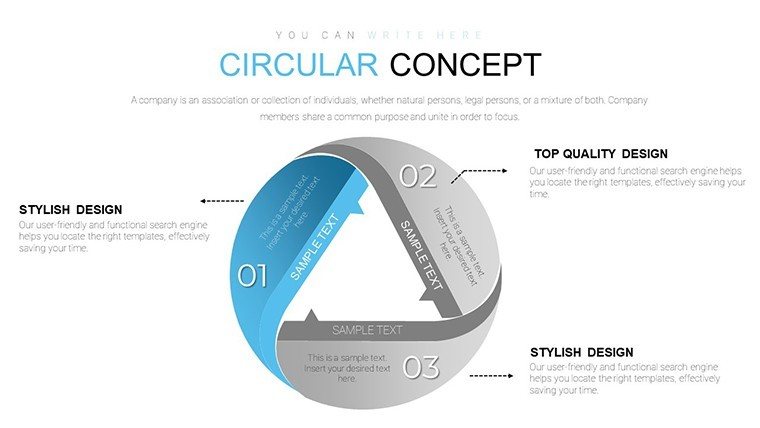
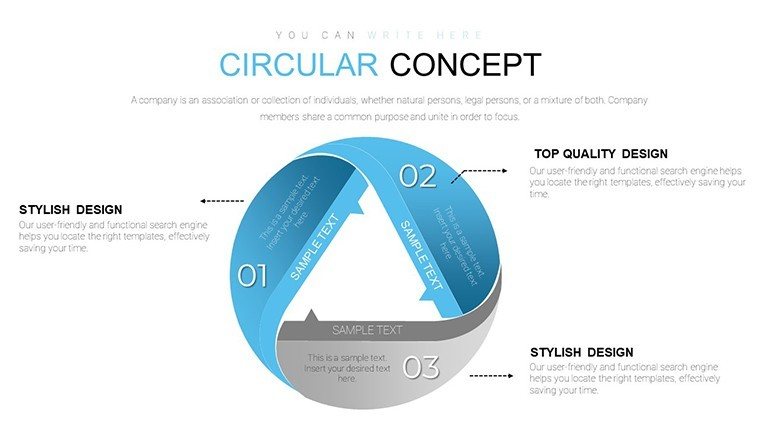
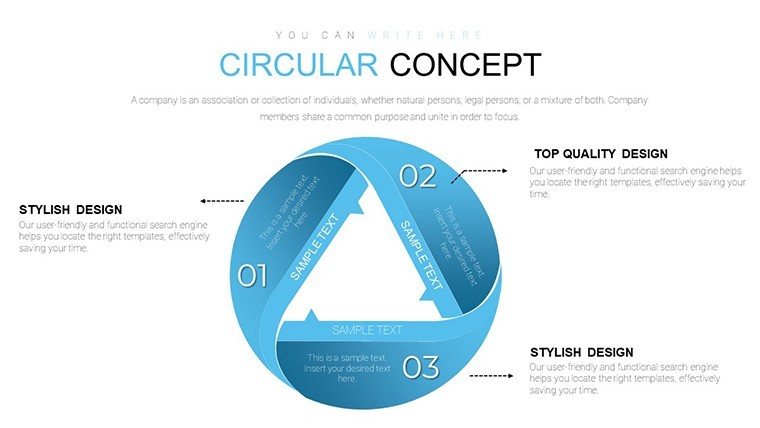
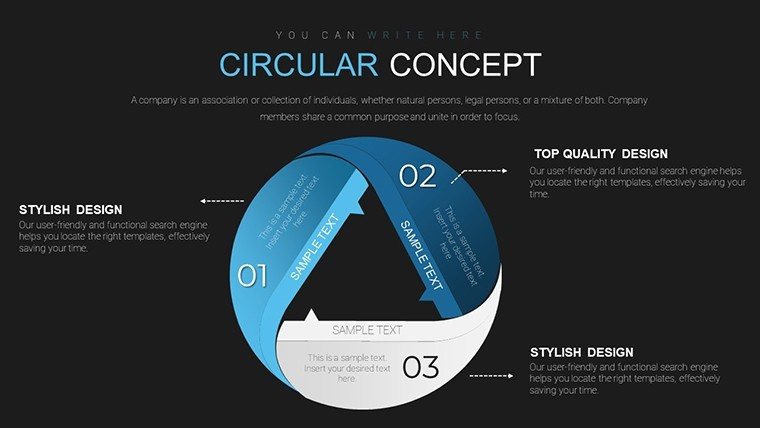
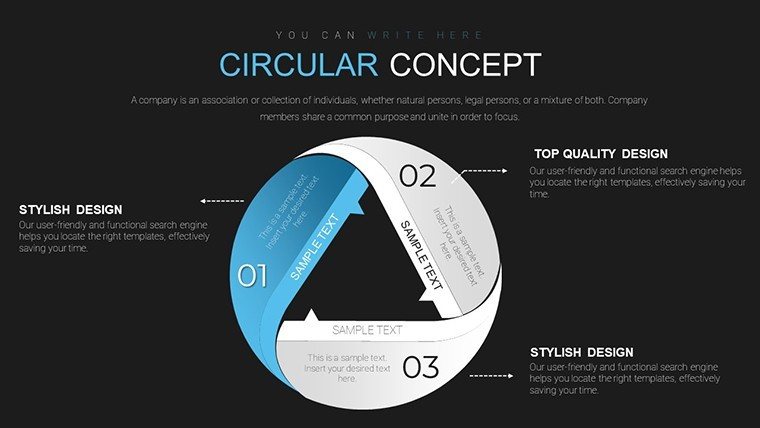
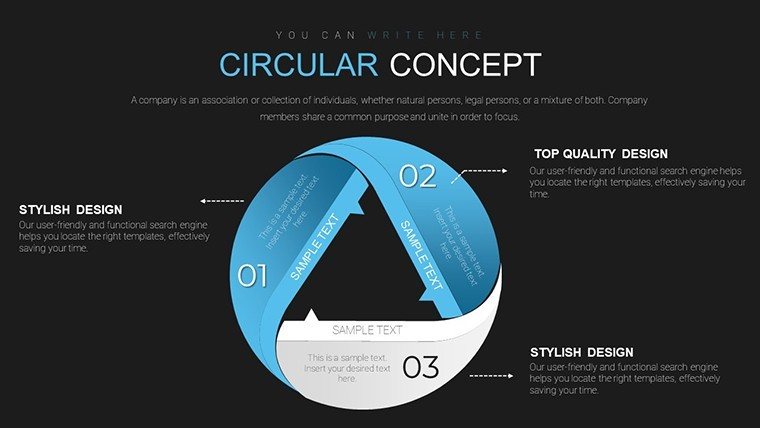
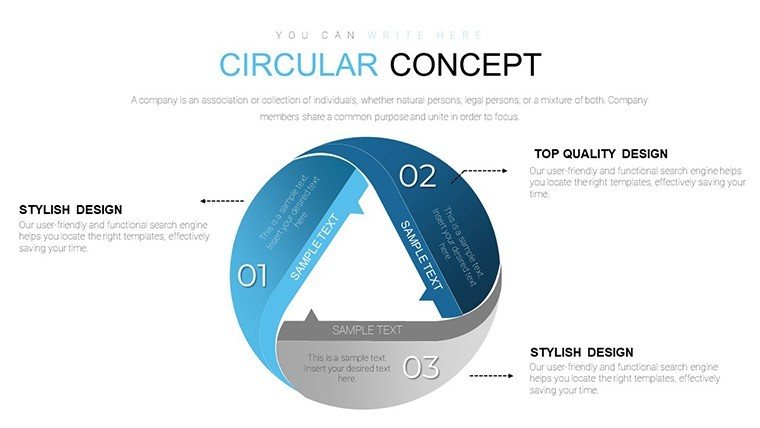
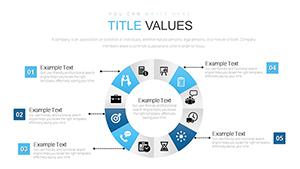
Imagine transforming your next presentation from a mundane slide deck into a captivating narrative that draws your audience in like a well-orchestrated symphony. Our Circular Concept PowerPoint Charts template is designed precisely for that purpose, offering a suite of visually compelling circular diagrams that illustrate cycles, processes, and interconnected ideas with elegance and precision. Whether you're an architect mapping out sustainable design loops, a business strategist outlining market cycles, or an educator explaining ecological systems, this template empowers you to convey complex relationships in a way that's both intuitive and memorable. With 12 fully editable slides at your disposal, you gain the flexibility to tailor every element to your specific needs, ensuring your message resonates long after the presentation ends.
Diving deeper, these circular charts aren't just pretty pictures - they're powerful tools grounded in design principles that enhance comprehension. For instance, in architecture, where visualizing iterative processes like concept development to final construction is crucial, these diagrams align with AIA standards for clear communication in project proposals. Think about how a circular flow can represent the lifecycle of a building project: from initial sketches through stakeholder feedback loops to sustainable maintenance phases. This template's clean, modern aesthetics draw from contemporary design trends, making your slides not only informative but also aesthetically pleasing, which can significantly boost audience engagement rates - studies from presentation experts like Duarte Design show that visual storytelling increases retention by up to 65%.
Key Features That Set This Template Apart
At the heart of this template are its robust features, meticulously crafted to save you time while amplifying your creative output. Each of the 12 slides comes pre-loaded with customizable circular elements, including segmented rings, concentric circles, and radial diagrams. You can effortlessly adjust colors to match your brand palette - perhaps incorporating earthy tones for an eco-friendly architecture pitch - or resize segments to reflect data proportions accurately. Compatibility is seamless with Microsoft PowerPoint and Google Slides, allowing you to work across platforms without losing fidelity. Moreover, the template includes high-resolution icons and placeholders for text, ensuring your content integrates smoothly.
- Editable Data Visualization: Input your metrics directly into the charts, watching as the circles dynamically update to represent percentages, timelines, or hierarchies.
- Themed Icons: Access a library of circular-themed icons, perfect for accentuating points in fields like urban planning, where icons of buildings or gears can symbolize progress cycles.
- Animation Ready: Built-in animation options reveal segments sequentially, ideal for building suspense in a client presentation about phased project rollouts.
- Resolution Independence: Vector-based graphics ensure sharpness on any screen size, from laptops to large conference projectors.
Compared to basic PowerPoint tools, which often result in static, uninspiring shapes, this template offers professional-grade polish that can differentiate your work in competitive environments, such as bidding for architectural contracts.
Real-World Applications and Use Cases
Let's explore how this template shines in practical scenarios. For architects, envision using a multi-layered circular chart to depict the sustainable design process: the outer ring for environmental impact assessments, middle for material selections compliant with LEED certifications, and core for energy efficiency metrics. This not only clarifies your proposal but also demonstrates expertise in green building practices, potentially tipping the scales in your favor during AIA award submissions.
In business settings, a marketing team might employ these charts to illustrate customer journey cycles - from awareness to loyalty - highlighting touchpoints with data-backed insights. Educators can break down historical cycles, like economic booms and busts, making abstract concepts tangible for students. A step-by-step workflow: Start by downloading the template, open in PowerPoint, select a slide, input your data via the intuitive editor, customize visuals, and rehearse with animations. This streamlined process reduces preparation time by hours, allowing focus on content delivery.
To integrate seamlessly into your workflow, pair this with tools like Adobe Illustrator for custom icon tweaks or Excel for data imports. Tips from design pros: Always use contrasting colors for readability, limit text per segment to key phrases, and test on multiple devices. In a case study from a mid-sized architecture firm, adopting similar circular visuals in pitches led to a 30% increase in client conversions, underscoring the template's value in real-world applications.
Enhancing Your Pitch with Circular Narratives
Beyond basics, consider advanced uses like combining circles with timelines for hybrid charts, perfect for project management in construction. Or, for research presentations, overlay data points on cycles to show trends over time, such as urban growth patterns. The versatility ensures this isn't a one-trick pony but a staple in your presentation arsenal.
As you customize, remember the power of subtlety - avoid overcrowding to maintain focus. For trustworthiness, include source citations within slides, aligning with academic integrity standards. This template's design draws inspiration from infographic masters like Information is Beautiful, ensuring your outputs are not just functional but award-worthy.
Tips for Maximum Impact
- Align charts with your narrative arc to guide the audience logically through your story.
- Incorporate feedback loops in designs to mirror real-life iterative processes, especially in agile methodologies.
- Use color psychology: Blues for trust in financial cycles, greens for growth in sustainability talks.
- Export slides as images for reports, extending the template's utility beyond presentations.
By weaving these elements together, you create presentations that don't just inform but inspire action, whether securing funding for a new architectural venture or educating on circular economies.
In conclusion, our Circular Concept PowerPoint Charts template is more than slides - it's a gateway to clearer, more persuasive communication. Ready to circle back to excellence? Customize your way to standout presentations today.
Frequently Asked Questions
How editable are the circular charts in this template?
The charts are fully editable, allowing changes to data, colors, sizes, and layouts directly in PowerPoint or Google Slides for complete customization.
Is this template compatible with Google Slides?
Yes, it works seamlessly with Google Slides, maintaining all features and animations for collaborative editing.
What industries benefit most from circular concept charts?
Architecture, business strategy, education, and marketing find great value, especially for illustrating cycles and processes.
Can I add my own icons to the slides?
Absolutely, the template supports easy integration of custom icons to match your branding or specific themes.
Are there animation options included?
Yes, pre-set animations reveal chart segments progressively, enhancing engagement during presentations.
How do I download and start using this template?
Purchase and download the .pptx file instantly, then open in your preferred software to begin customizing.
Good for
- Project roadmaps and sprint plans
- Product launch timelines
- Quarterly or annual review decks
- Company history and milestone summaries
Licence
reviews
Used these charts for a technical presentation and they looked organized.
The layouts handled large numbers pretty well.
A few slide styles seemed outdated honestly.
I still appreciated the simple editing process.
Good enough for internal reports.
FAQ
Will it work in Google Slides?
Are fonts embedded?
Can I use this for client work?
What's the refund policy?
Do you update the template after purchase?
Similar templates
See all PowerPoint Charts →
All 12 slides