 Click to zoom
Circle Processes PowerPoint Charts Template: Visualize Cycles with Ease
| Format | .pptx |
| Slides | 10 unique layouts |
| Aspect ratio | 16:9 |
| Compatibility | PowerPoint |
| Animated | No |
| Language | English |
| License | Commercial |
| File size | — |
| Version | v1.0 |
| Last updated | August 2023 |
What's inside
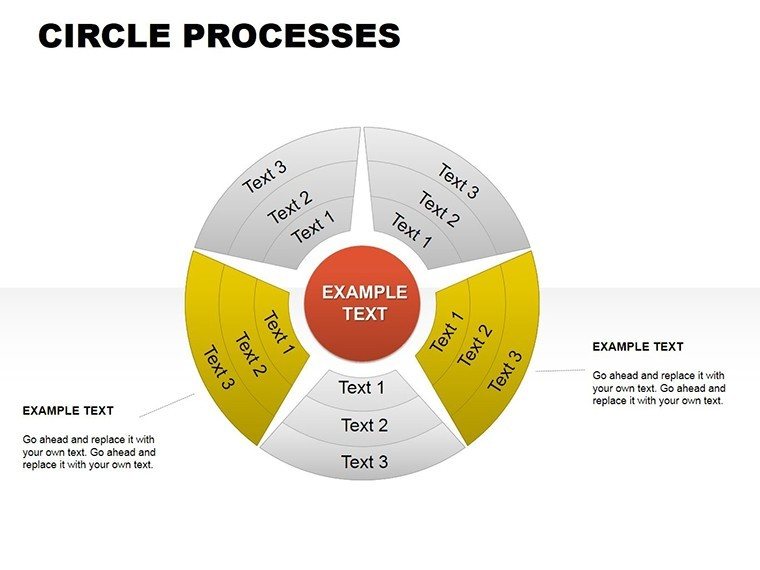
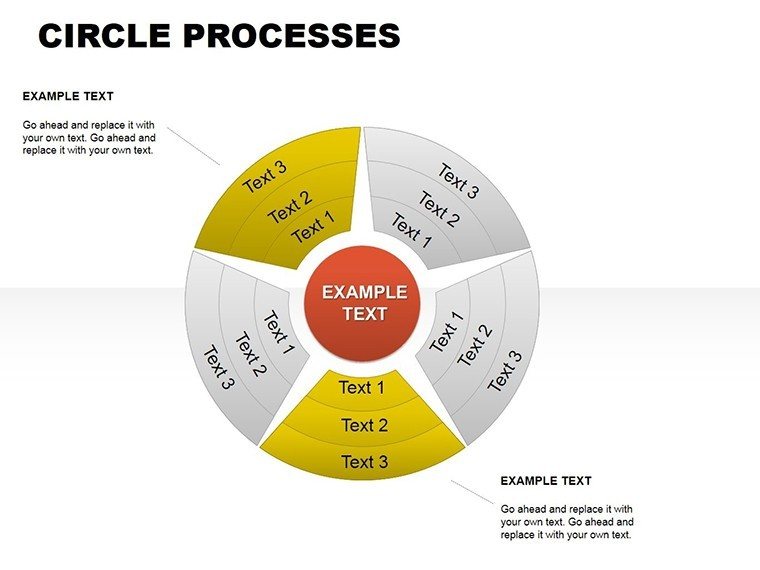
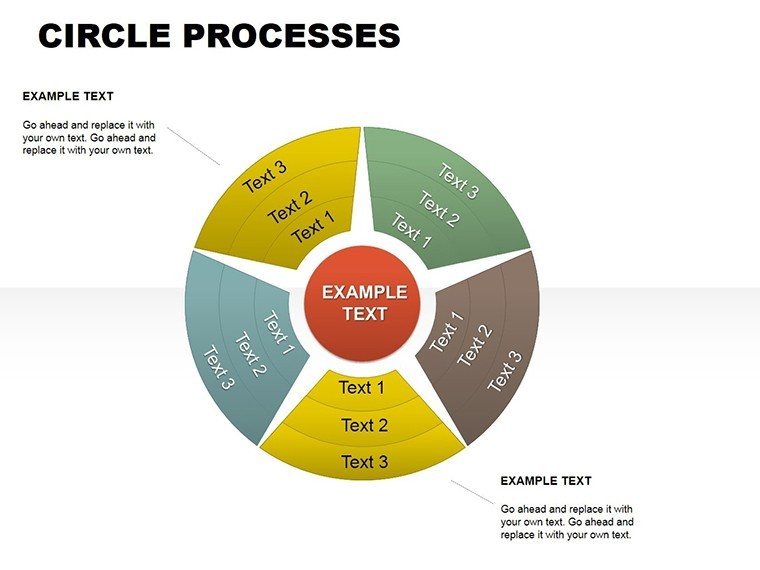
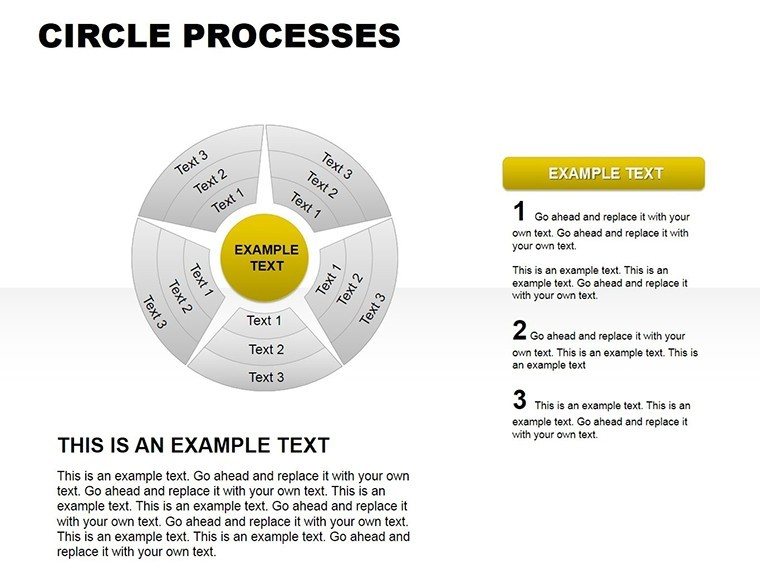
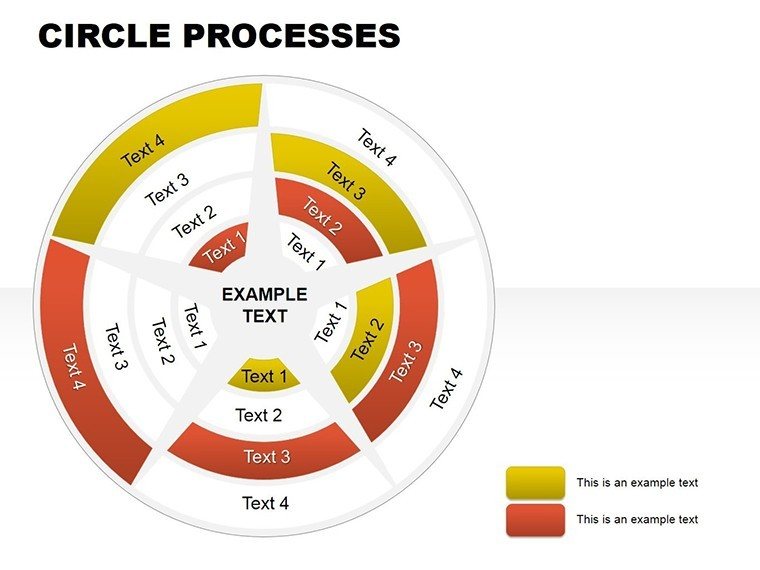
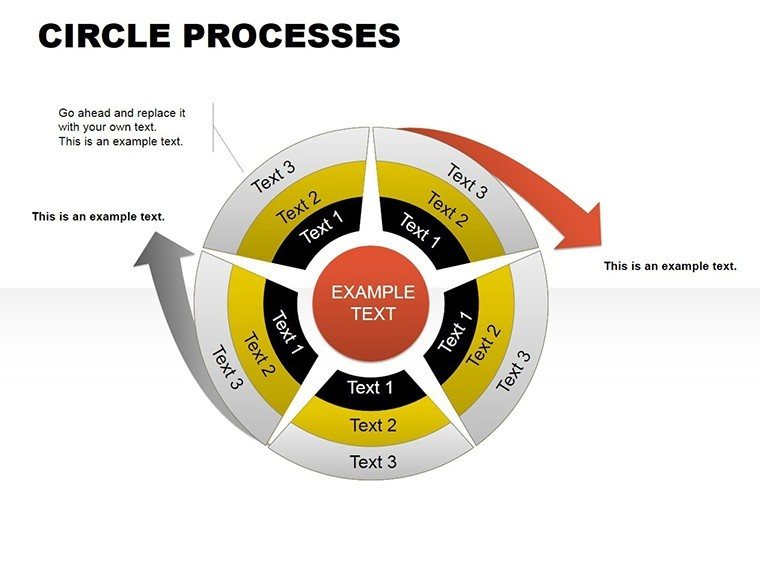
Picture this: You're in a high-stakes meeting, and instead of drowning in bullet points, your audience follows a smooth, circular flow that mirrors real-life processes. That's the power of our Circle Processes PowerPoint Charts Template. Tailored for those who juggle complex ideas daily, this collection of 10 editable slides transforms abstract cycles into tangible visuals. Whether you're a project manager outlining development phases or a trainer illustrating learning loops, this template bridges the gap between data and comprehension.
Inspired by methodologies like the Deming Cycle (Plan-Do-Check-Act), widely used in quality management per ISO 9001 standards, these charts help depict repetitive processes without redundancy. Fully compatible with PowerPoint and Google Slides, they allow for quick adaptations - change a segment's color to highlight bottlenecks or resize rings for emphasis. The result? Presentations that not only inform but inspire action, much like how circular economies in sustainability reports emphasize reuse and recycling.
Standout Features for Professional Polish
This template excels in flexibility. Each circle chart is built with layered elements, enabling you to break down processes into segments effortlessly. Unlike generic circle diagrams that look flat, these incorporate subtle 3D effects and gradients for depth, making your slides pop on any screen.
- Segmented Circles: Divide processes into 4-8 parts, with editable labels for steps like ideation to execution in product development.
- Color Customization: Match your company's scheme or use psychology-backed hues - blues for trust in financial cycles.
- Data Integration: Link to Excel for dynamic updates, ensuring your charts reflect the latest metrics.
- Icon Enhancements: Built-in arrows and symbols to denote direction, perfect for feedback loops.
In contrast to basic PowerPoint tools, which require hours to align segments perfectly, this template offers pre-aligned designs that save time while maintaining symmetry. It's like having a design assistant at your fingertips.
In-Depth Slide Overview
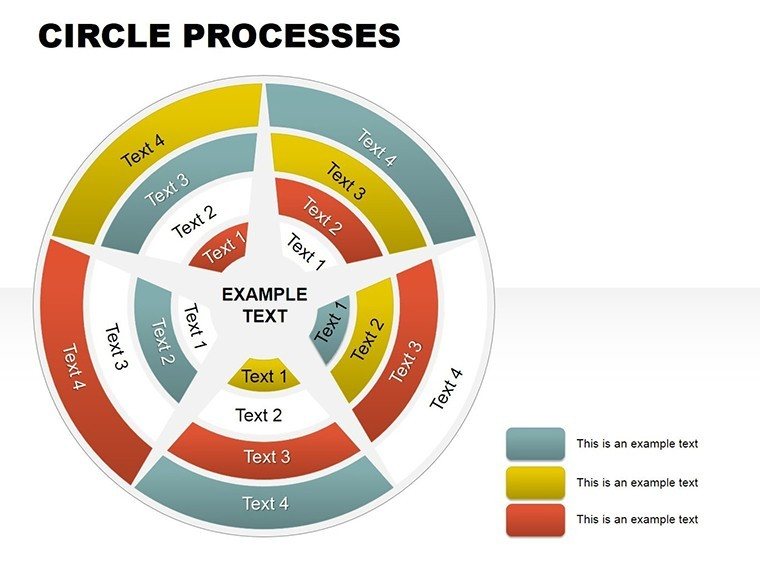
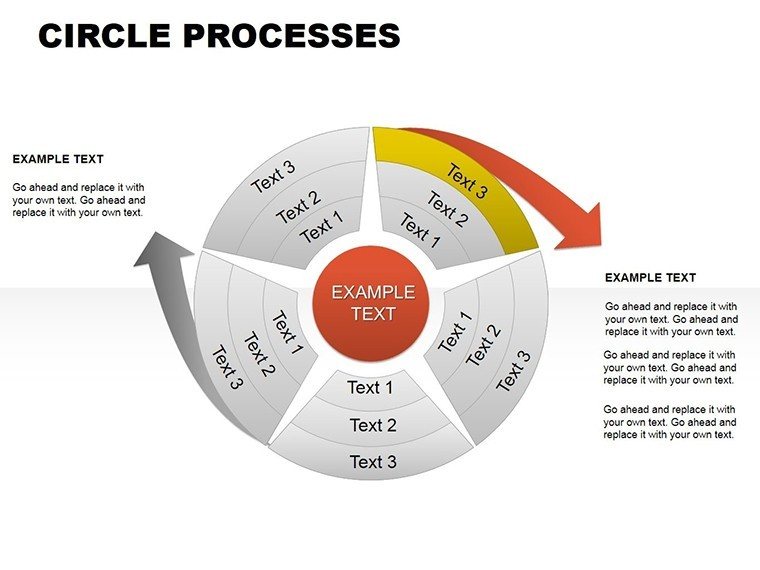
Slide 1 sets the stage with a basic circle, ideal for introductory overviews. Slides 2-4 build complexity with multi-ring cycles, suitable for nested processes like marketing funnels within sales strategies. By slide 7, you'll find interconnected circles for ecosystem mappings, such as supply chain dynamics.
The final slides, 9-10, include timeline-infused circles, blending linear and cyclic elements for hybrid narratives. Each comes with sample data, so you can experiment: Input quarterly goals into segments to track progress visually.
Practical Use Cases Across Industries
Harness this template for everyday challenges. Marketing specialists can map customer lifecycles, from awareness to advocacy, revealing retention opportunities. Educators might use it for curriculum planning, showing how lessons build upon each other in a continuous loop.
- Workflow Optimization: Diagram IT processes, identifying loops in troubleshooting to streamline operations.
- Training Sessions: Illustrate skill acquisition cycles, making abstract concepts like muscle memory in sports training concrete.
- Strategic Planning: Visualize business growth rings, expanding from core competencies outward.
A real example: In a case from a Fortune 500 company (echoing practices at firms like Toyota), circular process charts reduced project delays by clarifying iterative steps, as noted in Project Management Journal studies. Pair it with collaboration tools for team input, fostering inclusive refinements.
Pro Tips to Enhance Your Charts
Begin by defining your cycle's core - what's the central idea? Use animations to rotate segments, simulating motion for engaging reveals. Ensure accessibility with alt text for images and sufficient contrast. For integration, embed hyperlinks to detailed reports within segments.
Advanced trick: Overlay circles on infographics, like placing a process cycle over a globe for global operations, adding context without clutter.
Start Cycling Your Success Stories Now
Don't let linear thinking limit your impact. Download this circle processes template and circle back to presentations that truly connect. Transform your next session into a whirlwind of insight.
Frequently Asked Questions
How do I customize the circle segments? Simply click and edit text, colors, or add/remove parts directly in PowerPoint.
Does it support data from spreadsheets? Yes, link to Excel for automatic updates in your charts.
Is animation included? Pre-set rotations and fades for dynamic presentations.
Compatible with Mac versions? Fully works on PowerPoint for Mac and online editions.
Can I resell the template? No, it's for personal use only after purchase.
What if I need more slides? Duplicate and modify existing ones easily.
Good for
- Project roadmaps and sprint plans
- Product launch timelines
- Quarterly or annual review decks
- Company history and milestone summaries
Licence
reviews
Needed charts for a client update and these slides saved me stress.
The graphs looked clean after changing the fonts.
Some slide backgrounds felt outdated honestly.
Worked fine for showing monthly sales numbers.
I appreciated that the charts were easy to resize.
FAQ
Will it work in Google Slides?
Are fonts embedded?
Can I use this for client work?
What's the refund policy?
Do you update the template after purchase?
Similar templates
See all PowerPoint Charts →

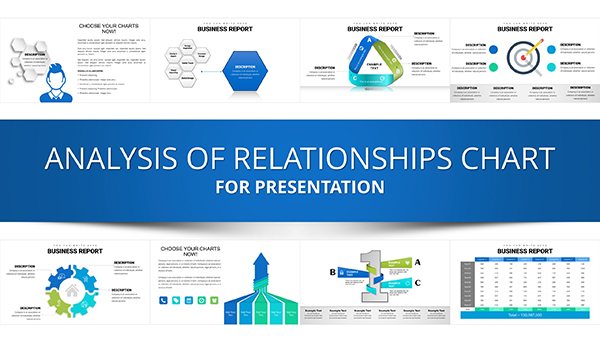
All 10 slides