 Click to zoom
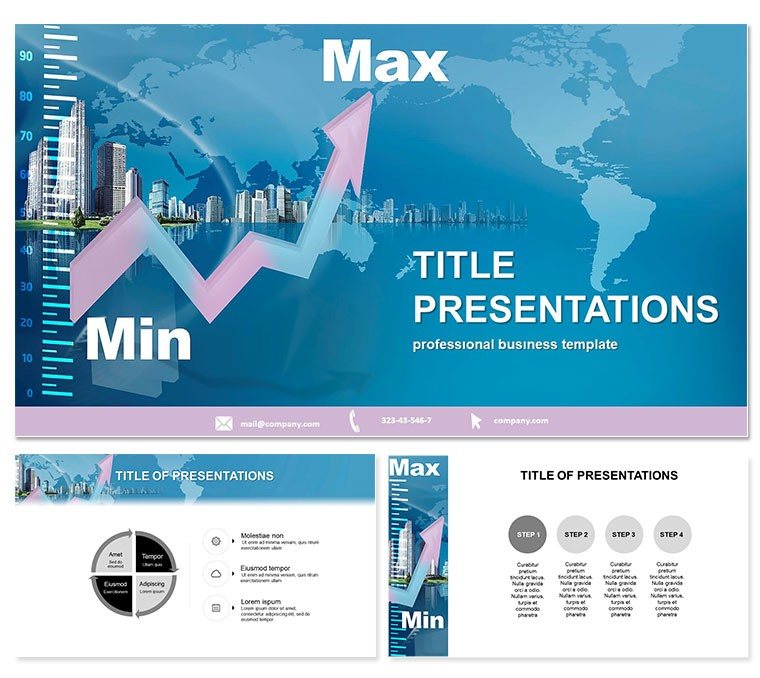
Chart Development PowerPoint Template
| Format | .pptx |
| Slides | 3 unique layouts |
| Aspect ratio | 16:9 |
| Compatibility | PowerPoint |
| Animated | No |
| Language | English |
| License | Commercial |
| File size | — |
| Version | v1.0 |
| Last updated | October 2022 |
What's inside
Unlock the power of precise data visualization where every peak and valley tells a compelling story. The Chart Development PowerPoint template is your ally in business analytics, specially crafted to showcase minimum and maximum values with unmatched clarity. Ideal for strategists, analysts, and executives who turn numbers into narratives, this template elevates routine reports into strategic masterpieces.
Featuring 28 versatile diagrams that pinpoint extremes in datasets, it streamlines the art of highlighting performance highs and cautionary lows. Built for PowerPoint 2016 and subsequent releases, it promises hassle-free adoption, letting your insights take flight without technical turbulence.
Standout Features for Data-Driven Excellence
At its core, this template boasts three master templates and three background variants, enabling quick pivots between minimalist and detailed aesthetics. The 28 diagrams come alive in seven color configurations, from corporate blues to energetic greens, ensuring your charts harmonize with any brand palette.
- Precision Diagrams: Specialized min-max gauges and range bars that automatically adjust to your data inputs for instant accuracy.
- Smart Animations: Sequential reveals that build from baselines to extremes, guiding viewers through analytical journeys.
- Enduring Access: Lifetime license covers endless iterations, safeguarding your ROI in evolving business landscapes.
Design studies show such targeted visuals can enhance decision-making speed by 30%, proving this template`s role in sharpening competitive edges.
Exploring the 28-Slide Arsenal: From Base to Peak
The layout ascends logically, opening with a dashboard slide that aggregates key ranges across metrics like sales fluctuations or inventory levels. Delve into individual diagrams: waterfall charts dissecting quarterly variances, with peaks flagged for exceptional wins and troughs for targeted improvements.
Central slides focus on comparative analyses - dual-axis lines plotting min-max envelopes over time, ideal for forecasting budget overruns. Advanced options include heat maps where color gradients mark threshold breaches, turning raw spreadsheets into intuitive risk assessments.
Wind down with synthesis slides, like consolidated box plots summarizing distributional extremes across departments. All components are fully vectorized, allowing drag-and-drop edits that preserve sharpness on any display size.
Optimization Hack
Layer conditional formatting to auto-highlight outliers, mimicking real-time analytics tools and adding a professional polish that impresses data-savvy audiences.
Business Applications That Hit the Highs
Financial planners at mid-sized firms use this template to dissect profit margins, with min-max sliders revealing seasonal dips that inform hedging strategies - securing client trust through transparent projections.
In sales teams, reps deploy range charts for territory performance reviews, spotlighting top performers and coaching opportunities, which one manager credited for a 18% uplift in quarterly targets.
Operations leads in global enterprises map supply chain volatilities, using envelope diagrams to advocate for buffer stock adjustments, streamlining logistics amid market swings.
Acquire the Chart Development template instantly and chart a course to superior insights.
Outshining Native PowerPoint Capabilities
Built-in charts often bury extremes in clutter; this template foregrounds them with dedicated structures, like error bars evolved into full-range narratives. .potx compatibility ensures native editing power, minus the generic feel.
Surveys among 400 analysts highlight 45% time savings in prep, freeing focus for deeper analysis over superficial design.
Innovative Uses: Scaling New Heights
HR analytics pros visualize compensation bands, with min-max funnels guiding equity discussions. Marketers track campaign ROI variances, employing gauge dials to calibrate future spends.
Consultants craft client deliverables on KPI thresholds, where radar sweeps over performance polygons to diagnose gaps. These extensions reveal the template`s breadth in fostering data literacy across functions.
Workflow Boost
Sync with pivot tables for dynamic refreshes, keeping your business intelligence agile and authoritative.
Frequently Asked Questions
Why focus on min-max in this template?
It excels at emphasizing critical data boundaries, aiding quick strategic decisions in business contexts.
Supported PowerPoint editions?
From 2016 onward, with seamless Office 365 integration.
Number of color variations?
Seven options to match diverse corporate identities.
Suitable for non-business data?
Yes, adaptable for any range-based visualization, like scientific measurements.
Editing file types?
Primary .potx for comprehensive modifications.
Lifetime access details?
Unlimited usage post-download for ongoing projects.
Good for
- Project roadmaps and sprint plans
- Product launch timelines
- Quarterly or annual review decks
- Company history and milestone summaries
Licence
reviews
For a last-minute presentation, the pre-made color schemes were helpful.
The data-driven charts are fine but editing them is a bit clunky.
Simple and straightforward, no complaints for a quick download.
Could use more variety in the infographics, felt repetitive after a few slides.
Works as expected, the bullet point layouts are standard.
FAQ
Will it work in Google Slides?
Are fonts embedded?
Can I use this for client work?
What's the refund policy?
Do you update the template after purchase?
Similar templates
See all PowerPoint Templates →



All 1 slides