 Click to zoom
Chain System Keynote Charts: Forge Unbreakable Links in Your Data Story
| Format | .pptx |
| Slides | 16 unique layouts |
| Aspect ratio | 16:9 |
| Compatibility | PowerPoint |
| Animated | No |
| Language | English |
| License | Commercial |
| File size | — |
| Version | v1.0 |
| Last updated | May 2017 |
What's inside
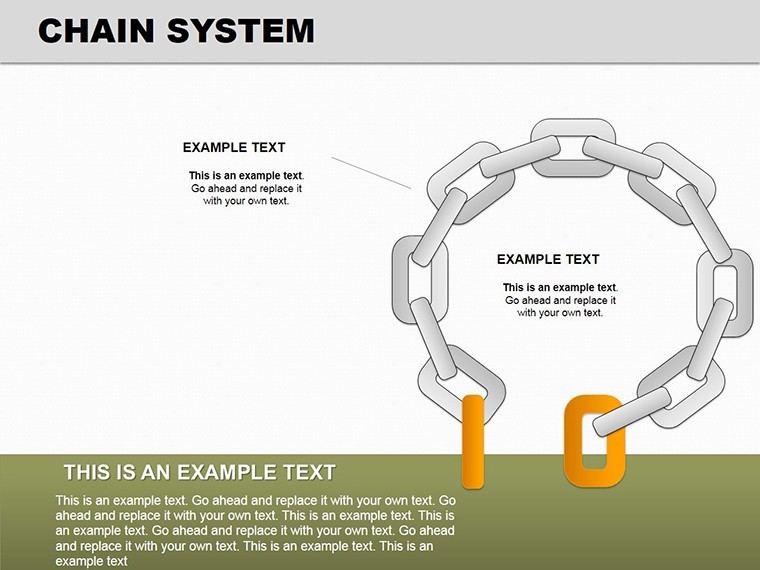
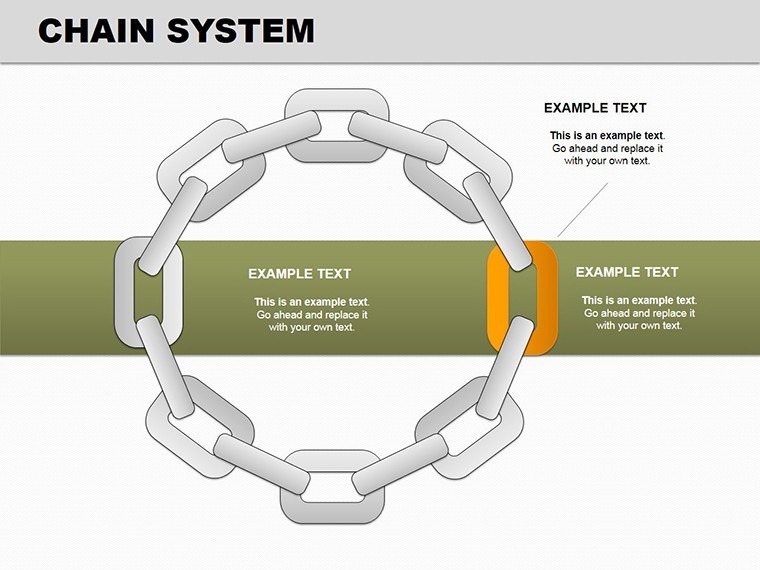
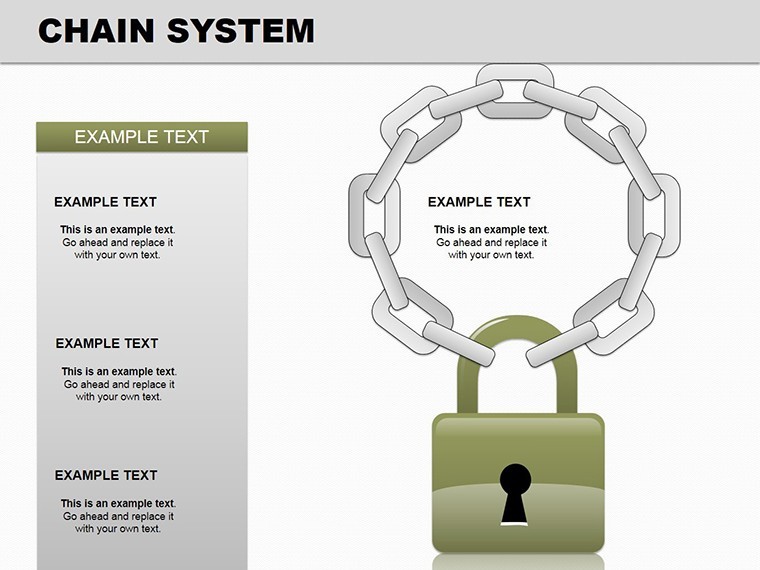
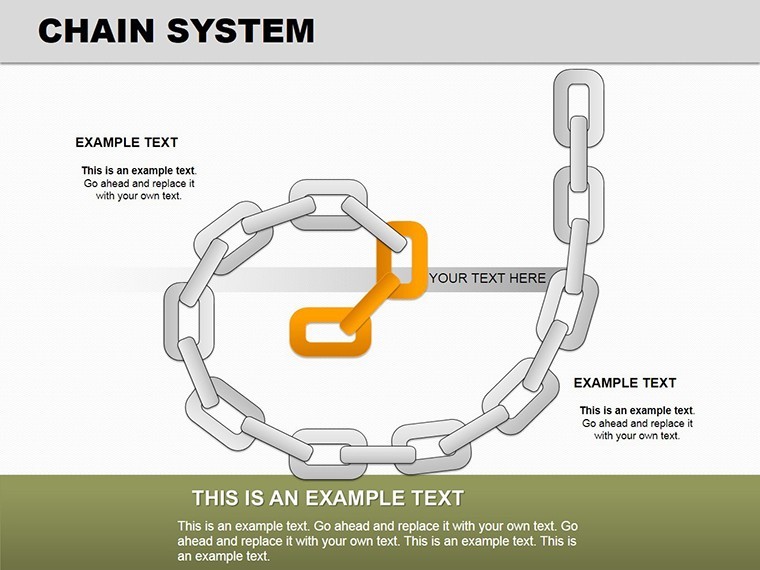
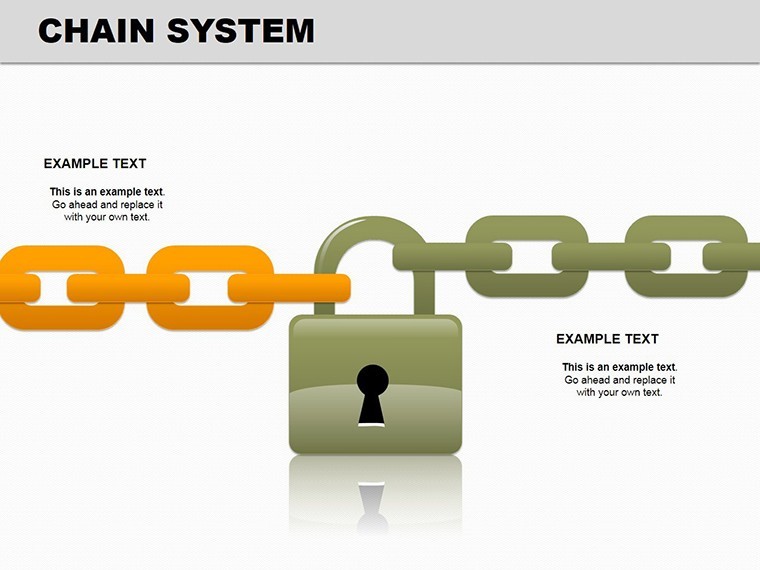
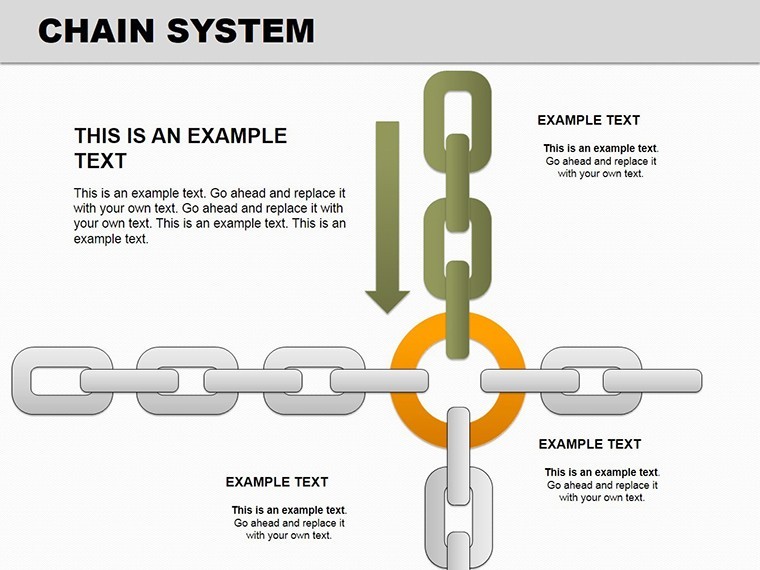
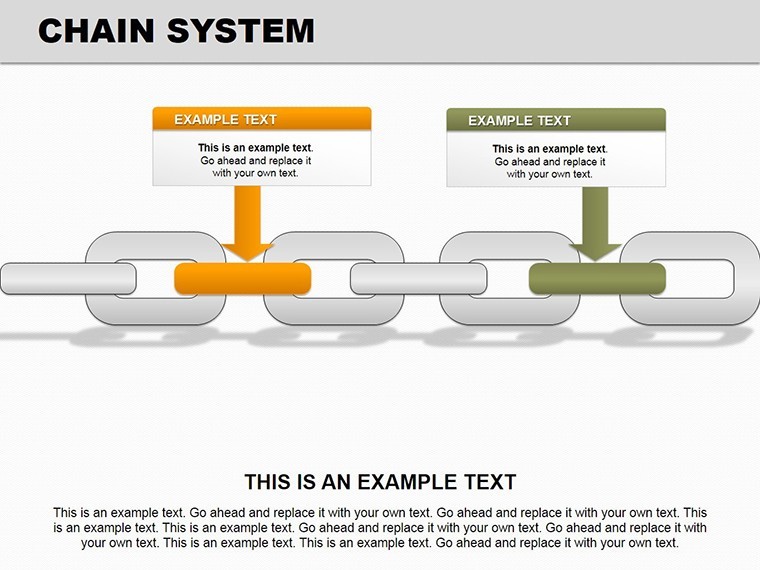
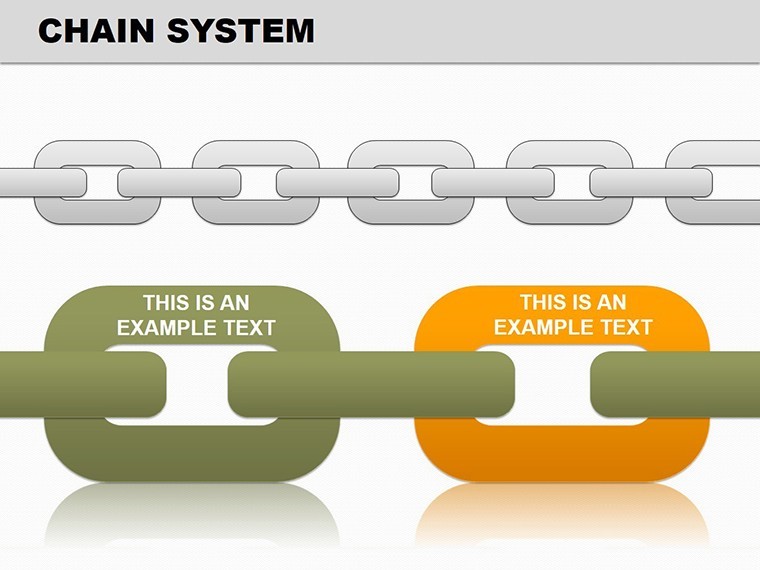
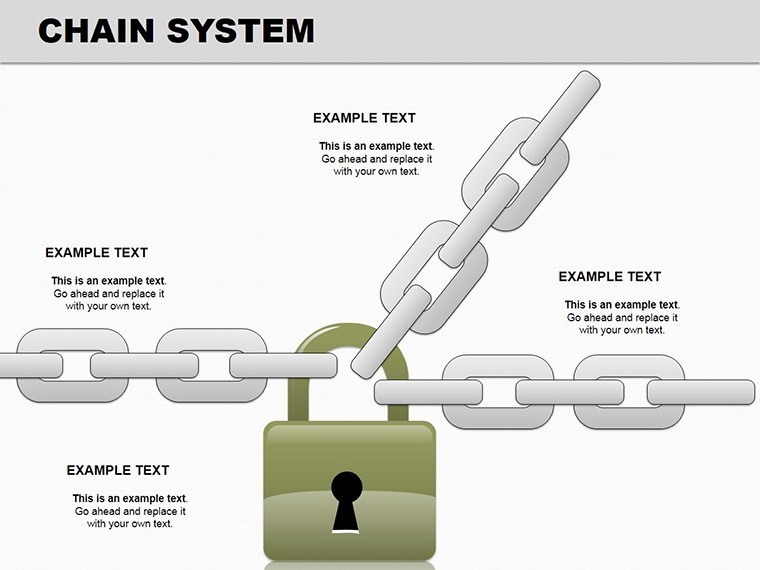
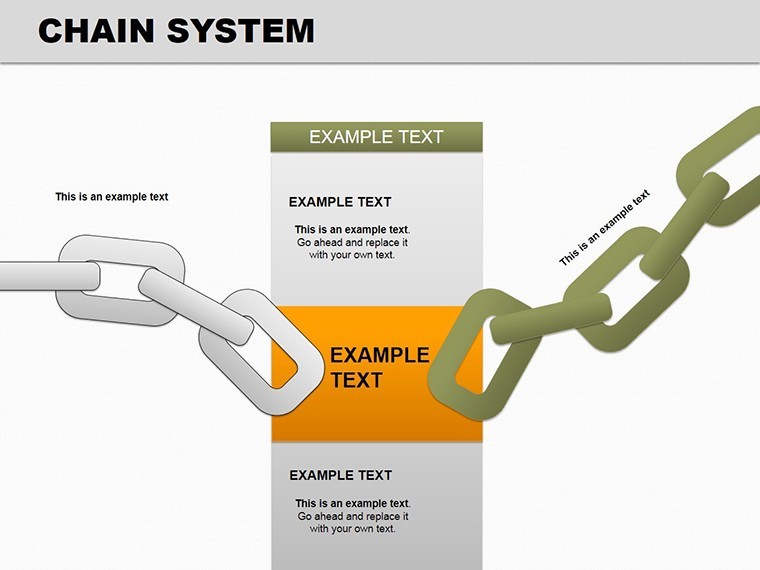
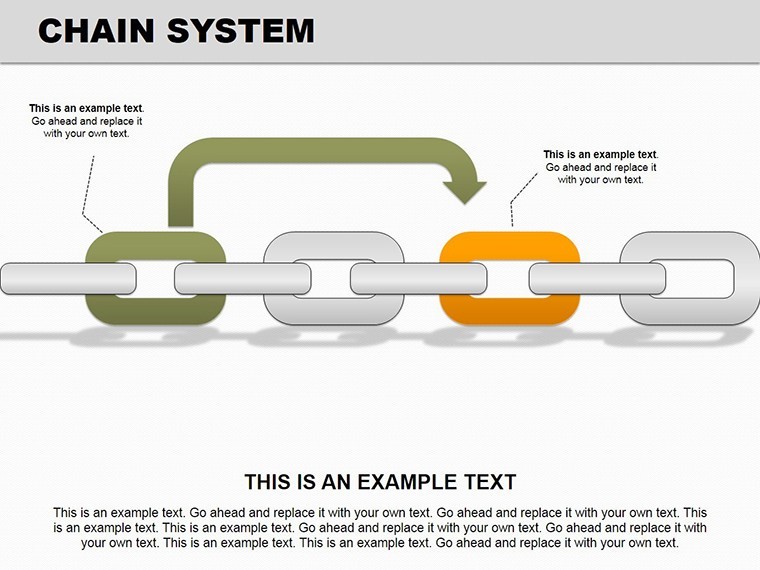
In the intricate web of business processes, one weak link can unravel everything. Enter our Chain System Keynote Charts template - a robust 16-slide arsenal built to illuminate relationships, spotlight errors, and chart operational triumphs. Crafted for operations managers, quality assurance teams, and process engineers, this template transforms tangled workflows into lucid chains that command attention and inspire confidence.
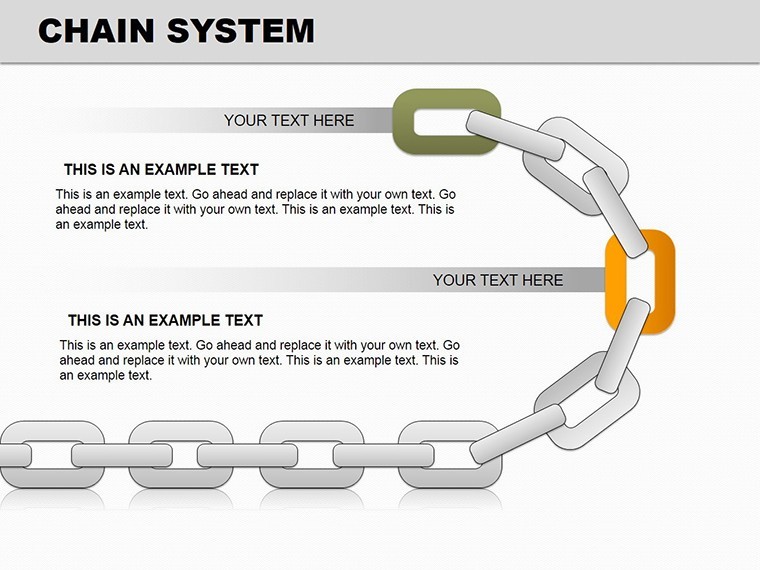
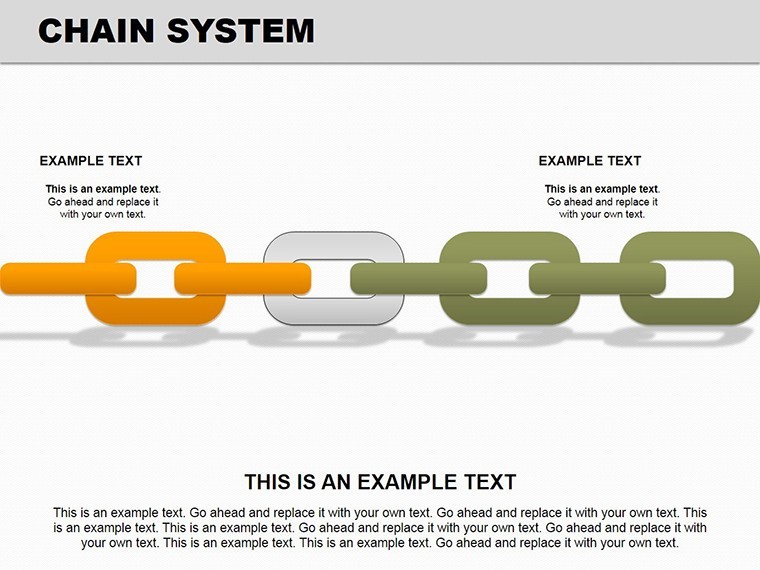
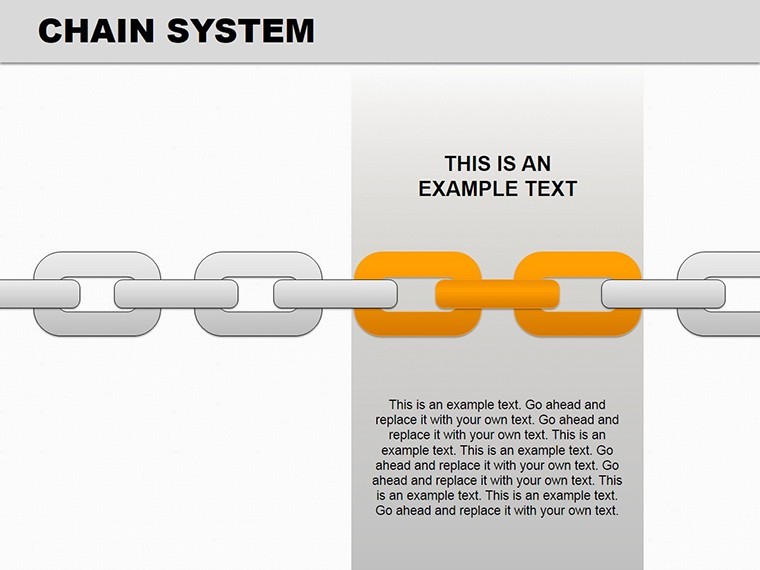
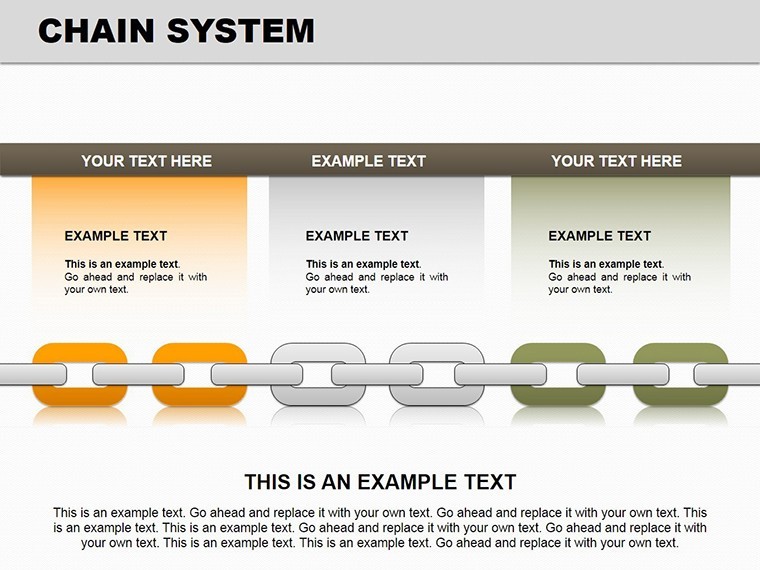
Each editable link in these charts isn't mere decoration; it's a narrative thread weaving causes to effects, successes to pitfalls. Keynote-optimized with PowerPoint versatility, the slides support widescreen and standard views, featuring a steel-gray and crimson palette that conveys resilience and urgency. Visualize a chain diagram where each segment pulses with metrics - supply chain delays highlighted in red, efficiencies in green - guiding your audience through the flow like a well-oiled machine.
Echoing methodologies from Six Sigma black belts, this tool emphasizes error-proofing (poka-yoke) through visual clarity. In a world where 70% of project failures stem from miscommunication (per PMI stats), these charts bridge gaps, turning reports into roadmaps. Whether auditing logistics or refining manufacturing, it's your shortcut to presentations that don't just inform - they fortify.
Strengthen Your Deck: Essential Features
Durability defines this template. With 16 vector slides, every chain element is manipulable - stretch links, color-code nodes, embed hyperlinks for drill-downs. It's process visualization at its finest, categorized under flowcharts but elevated for strategic depth.
- Interlinked Chains: Drag to reorder segments, revealing dependencies at a glance.
- Error Indicators: Built-in flags and annotations for risks, with customizable severity scales.
- Result Trackers: Terminal links tally outcomes, integrating formulas for real-time calcs.
- Modular Builds: Stack chains vertically or horizontally for complex hierarchies.
A logistics firm slashed audit times by 35% using chain visuals like these, as shared in their ISO certification case - proof of chains that bind progress.
Chain Reactions: Practical Scenarios
Apply it to supply chain optimization: Link vendor inputs to delivery outputs, flagging bottlenecks. An ops lead at a retail giant used this to negotiate better terms, saving 15% on costs.
For error analysis, trace mistake chains back to roots - ideal for root-cause sessions. It outpaces fishbone diagrams with its linear logic.
- Map the Chain: Outline steps from ERP exports.
- Tag Anomalies: Highlight variances with conditional formatting.
- Simulate Fixes: Duplicate slides to test scenarios.
- Present Powerfully: Animate links sequentially for cause-effect drama.
In team training, chains demystify protocols, reducing errors by visualizing "what ifs." Far superior to text walls, they engage kinesthetic learners.
Navigating the Slide Chain
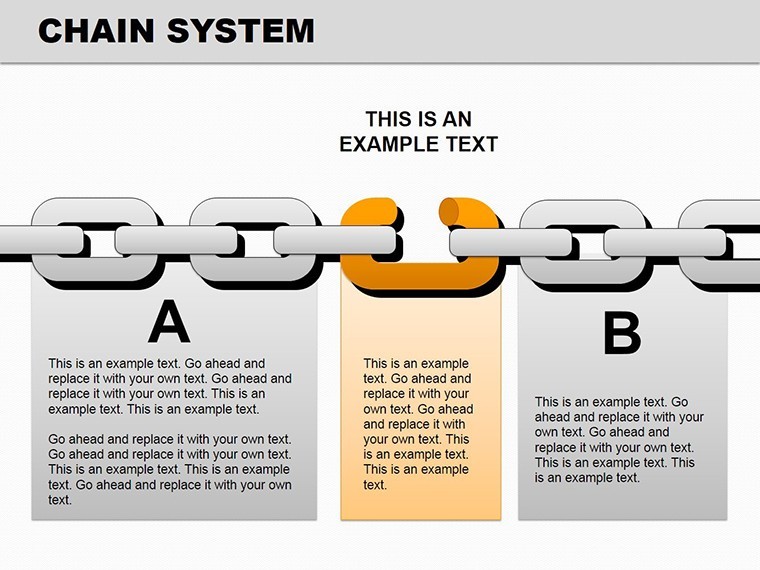
Slide #0 anchors with a foundational chain intro. #4 delves into relationship webs, with branching options. Mid-pack, #8 spotlights error clusters via highlighted breaks. Closer #15 synthesizes with a master chain overview. Previews hint at the linkage, but editing unlocks the forge.
Link-Up Tips from the Trenches
As a marketing analyst who's chained countless processes, advise: Start chains from the audience's end - reverse-engineer for relevance. Cite Kaizen principles for authority, and inject wit: "Don't let weak links sink your ship - chain 'em up!" Integrate with Lucidchart for hybrids.
Your processes deserve precision. Link up with Chain System Charts for $26 and weld winning workflows.
Frequently Asked Questions
Q: How do chains handle branching processes?A: Easily - add side links or forks with drag tools.
Q: Export to Visio?A: Yes, vector format ensures compatibility.
Q: Metrics integration?A: Supports basic calcs; link to sheets for advanced.
Q: Mobile-friendly?A: Optimized previews for on-the-go reviews.
Good for
- Project roadmaps and sprint plans
- Product launch timelines
- Quarterly or annual review decks
- Company history and milestone summaries
Licence
reviews
Needed charts for a weekly sales review and this helped.
The graphs looked clear after replacing the sample numbers.
A couple color combinations were too strong for me.
Still practical and easy to edit.
FAQ
Will it work in Google Slides?
Are fonts embedded?
Can I use this for client work?
What's the refund policy?
Do you update the template after purchase?
Similar templates
See all Keynote Charts →


All 16 slides