 Click to zoom
Cause Effect PowerPoint Diagrams: Decode Impacts with Precision
| Format | .pptx |
| Slides | 14 unique layouts |
| Aspect ratio | 16:9 |
| Compatibility | PowerPoint |
| Animated | No |
| Language | English |
| License | Commercial |
| File size | — |
| Version | v1.0 |
| Last updated | February 2026 |
What's inside
In boardrooms where decisions hinge on understanding ripples, the Cause Effect PowerPoint Diagrams template emerges as a beacon. With 14 editable slides, it equips strategists, analysts, and educators to map relationships between triggers and outcomes, turning vague hunches into structured revelations. Priced at $14, this .pptx powerhouse for PowerPoint 2016+ compatibility demystifies complexities, from market shifts to operational snags, empowering you to present not just what happened, but why - and what next.
Envision dissecting a sales dip: roots in supply delays branch to customer churn, all laid bare in fishbone-style diagrams that invite collaborative probing. This isn't generic charting; it's a versatile toolkit fostering clarity in chaos, ideal for teams dissecting processes or leaders forecasting scenarios.
Key Features Unlocking Relational Insights
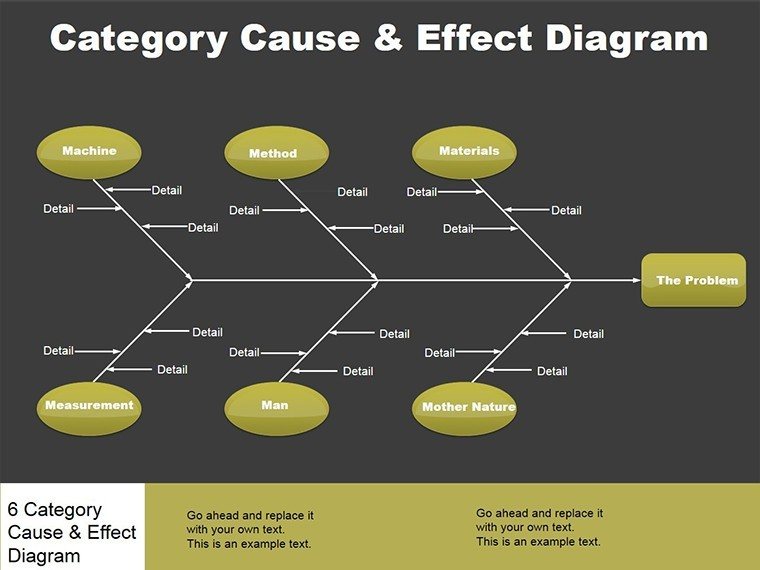
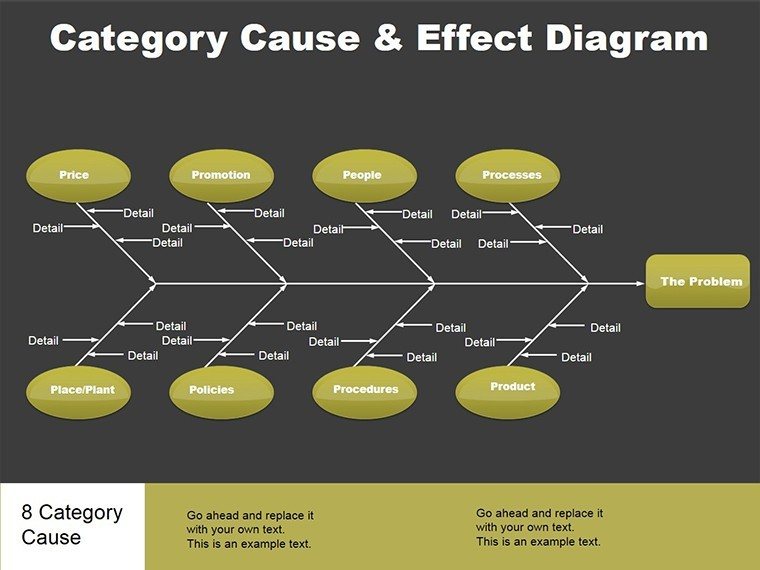
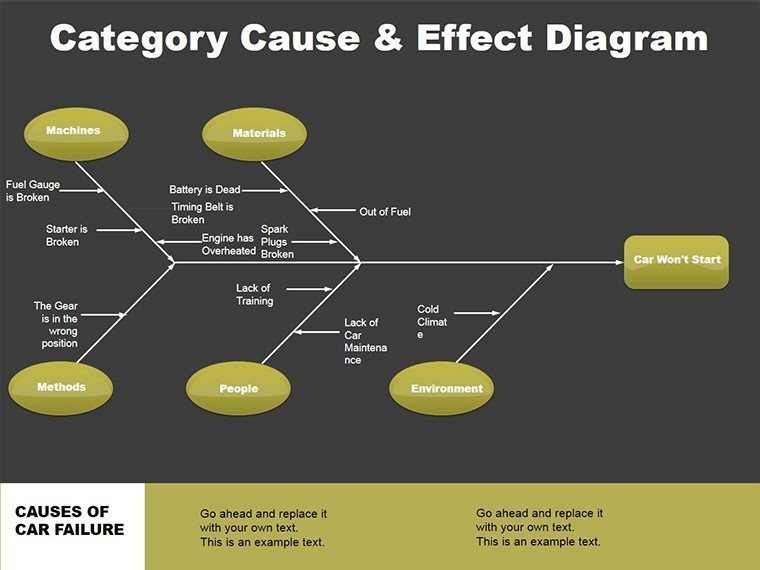
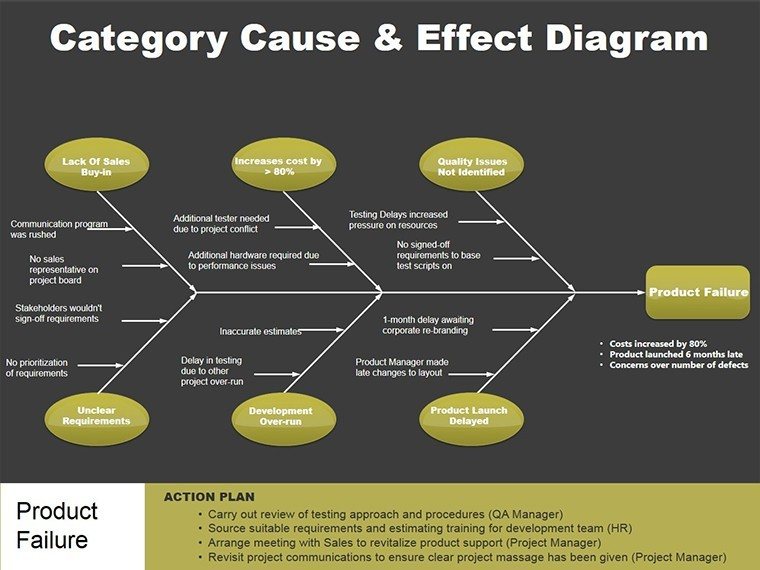
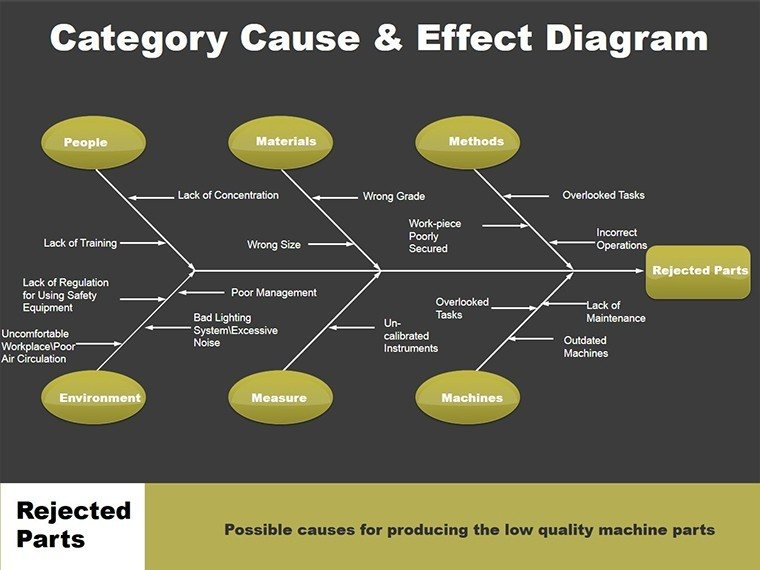
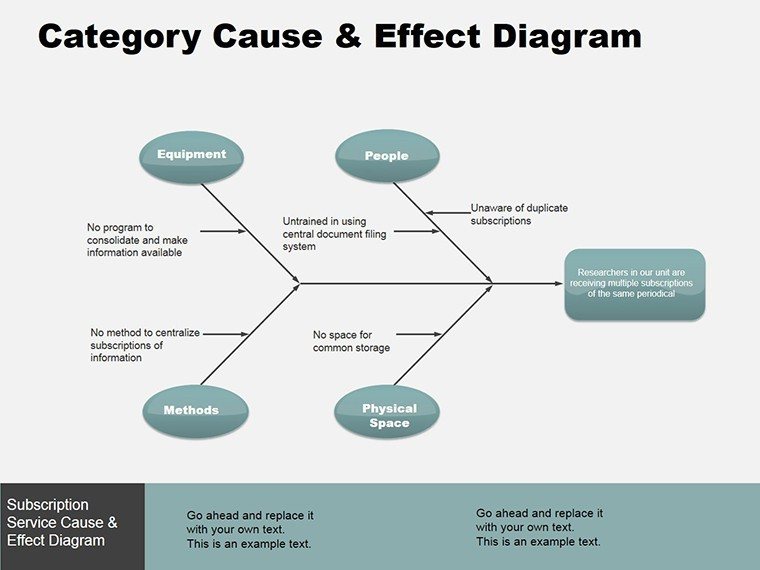
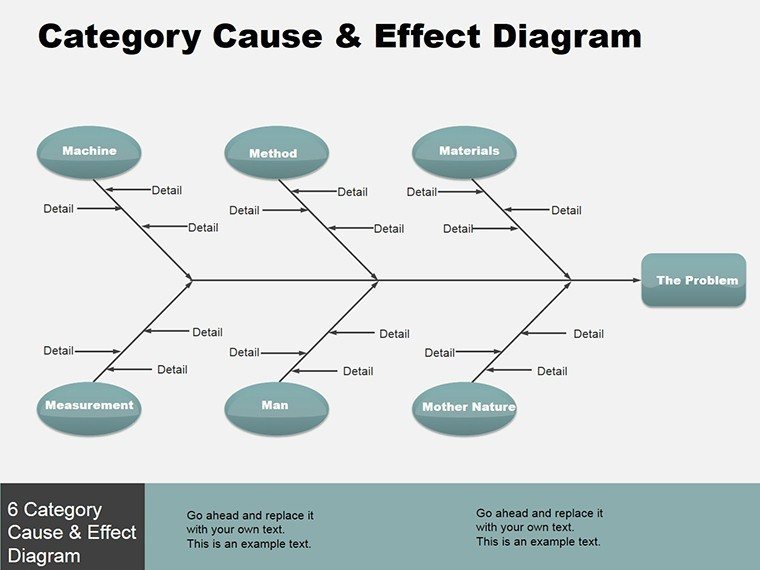
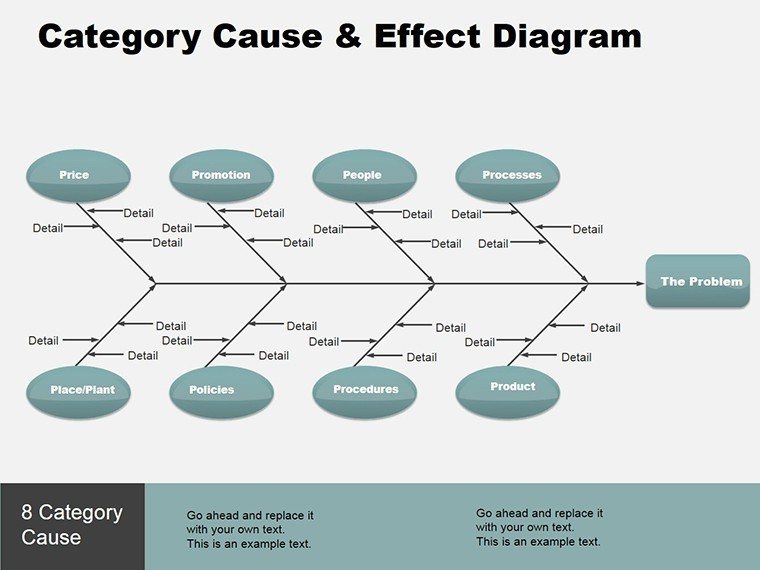
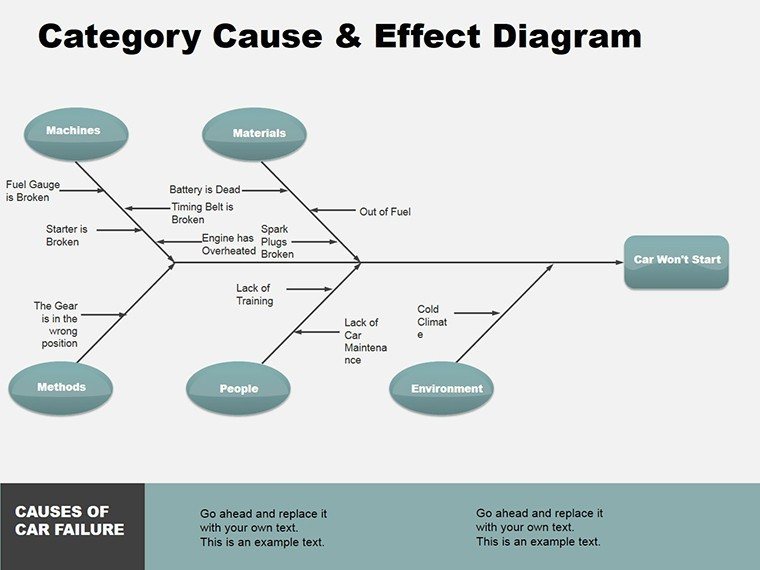
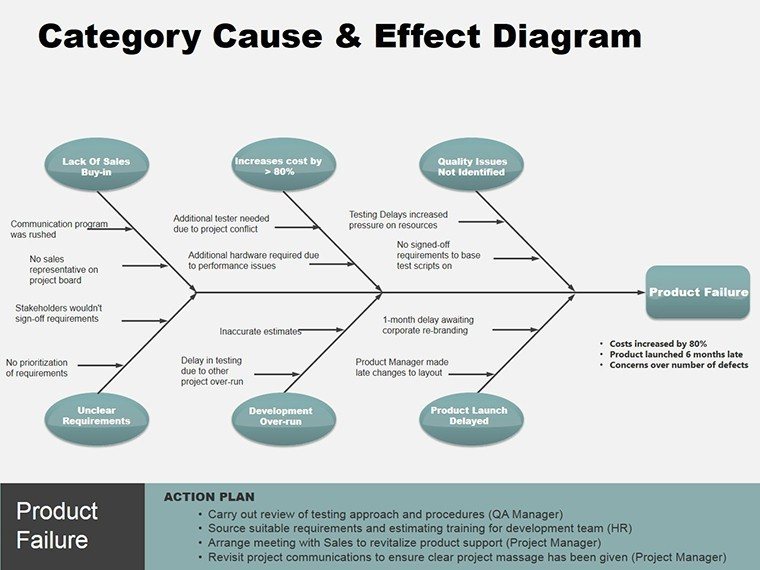
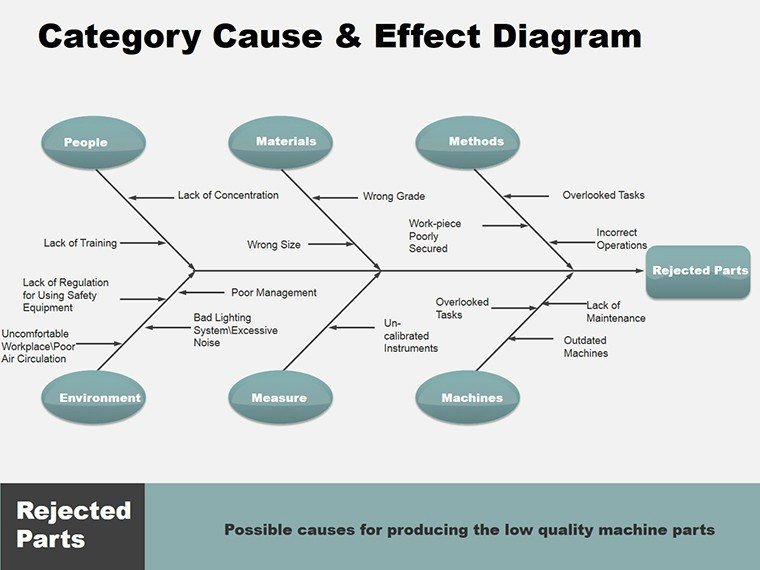
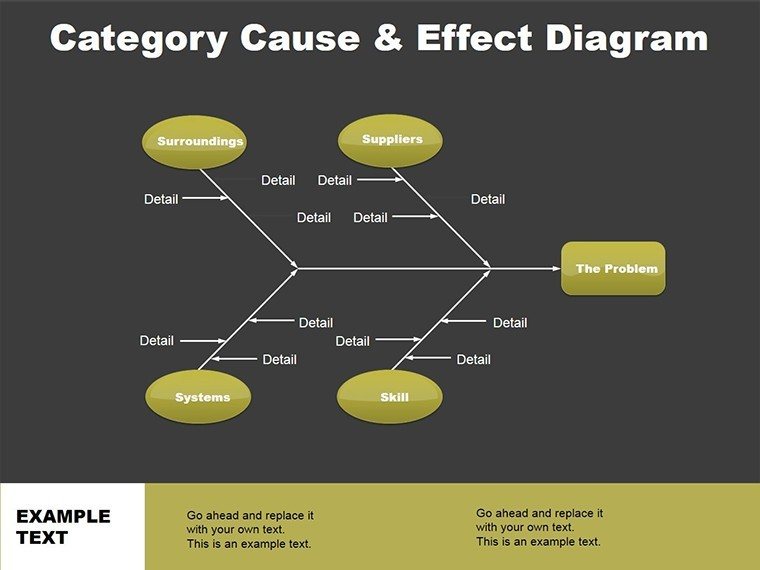
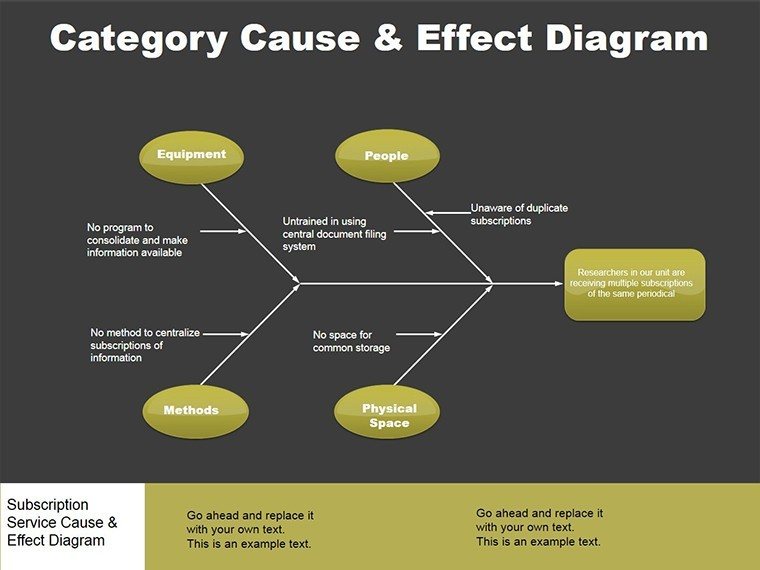
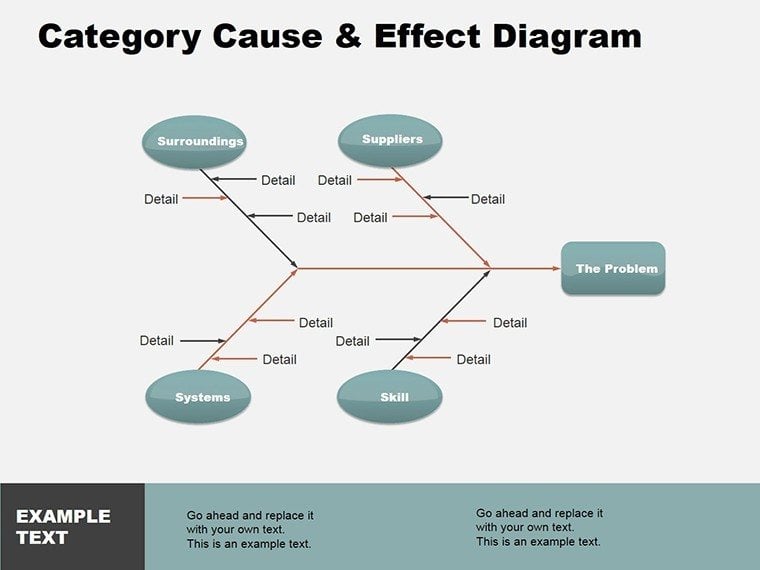
Slide 1 lays the groundwork with a classic fishbone diagram, spines for categories like people, methods, and materials - label and extend as needed for your context. Slide 2 evolves to a multi-layered cascade, where primary causes fork into secondary effects, with adjustable arrows for causal strength.
Slides 3-5 specialize in timelines: one for sequential impacts, another for parallel effects, and a third for cyclical loops, capturing feedback like in quality cycles. For quantitative ties, Slide 6's scatter-linked diagram correlates variables, editable axes scaling to your metrics.
Mid-deck, Slides 7-9 offer matrix views: cause-effect grids for prioritization, with color-coded cells signaling urgency. Slide 10 introduces root cause trees, drilling down from symptoms to origins. Slides 11-12 handle scenarios - best/worst case branches - while 13 integrates solutions mapping, linking fixes back to causes. The finale, Slide 14, synthesizes into an executive summary wheel, spokes radiating key takeaways.
- Dynamic Connectors: Auto-adjust as you reposition, maintaining clean lines.
- Icon Libraries: Built-in symbols for quick categorization, from gears for processes to people for human factors.
- Layered Transparency: Overlay effects without clutter, revealing depths on click.
Such features make dissecting dynamics not a chore, but a conversation starter in your PowerPoint sessions.
Targeted Applications: Solving Real Challenges
Think of a healthcare admin tracing patient wait times, echoing efficiency drives in busy clinics. Populate Slide 1's fishbone with staffing shortages as a head, branching to delayed diagnostics - add data labels for wait averages, then animate spines to build the narrative progressively.
In environmental consulting, Slide 10's tree mapped pollution sources to ecosystem hits, guiding policy briefs with visual logic over paragraphs. For sales teams, Slide 7's matrix ranked lead gen tactics by conversion uplift, prioritizing high-ROI efforts.
- Identify Core Issue: Center Slide 1 with the effect; brainstorm causes in a mind map first.
- Populate and Link: Drag icons to spines, type descriptions, connect with weighted lines.
- Validate Flow: Review for logical chains; adjust colors for emphasis.
- Present Interactively: Use zoom on branches for drill-downs during discussions.
This methodical approach embeds analytical rigor into presentations, turning slides into strategic assets.
Strategic Tips for Deeper Analysis
Leverage PowerPoint's equation editor for causal formulas in Slide 6, quantifying links where possible. Limit branches to 4-6 per diagram to preserve scannability, echoing principles from Deming's quality cycles. For global teams, incorporate multilingual labels via text boxes.
Adapt for forecasting: extend Slide 12's scenarios with probability sliders if using add-ins. A manufacturing lead once used the cascade for defect tracing, isolating machine variances - streamlining fixes and boosting output reliability.
Always end with action-oriented summaries; Slide 14's wheel prompts "So what?" ensuring impacts lead to initiatives.
Illuminate Your Next Analysis
Step from shadows of uncertainty into structured light with the Cause Effect PowerPoint Diagrams. Acquire it today and connect the dots that drive change.
Frequently Asked Questions
What diagram types are included?
Fishbones, cascades, matrices, and trees for comprehensive coverage.
Compatibility details?
Optimized for PowerPoint 2016+, seamless in .pptx.
Customization ease?
Vector edits allow full reshaping without quality loss.
Suitable for teams?
Yes, collaborative features like shared editing enhance group use.
Animation capabilities?
Pre-set builds for sequential reveals, customizable further.
Good for
- Project roadmaps and sprint plans
- Product launch timelines
- Quarterly or annual review decks
- Company history and milestone summaries
Licence
reviews
This one was decent for explaining project stages to my manager.
I mostly used the circle diagrams and ignored the rest.
Needed something last minute for class and these slides looked cleaner than my own.
The arrows were a little too big on some pages but not a huge issue.
It’s okay if you just need quick structure without designing everything yourself.
FAQ
Will it work in Google Slides?
Are fonts embedded?
Can I use this for client work?
What's the refund policy?
Do you update the template after purchase?
Similar templates
See all Powerpoint Diagrams →

All 14 slides